Governor Brown's new Executive Order, issued today is a banner day for our climate change efforts

From Bruce Riordan, at the Climate Readiness Institute. 

Bay Area Climate Stakeholders: Governor Brown's new Executive Order, issued today is a banner day for our climate change efforts. 

1. The Executive Order sets a new interim goal for GHG reduction—40% below 1990 levels by 2030.

2. The Executive Order, for the first time, outlines a series of steps the State will take to address climate adaptation and resilience. 

See the press release, reaction from world leaders, and the full Executive Order at: http://gov.ca.gov/home.php

Karin in the news! Google camera helps capture bay’s rising sea levels

Neat article about Google teaming up with the nonprofit San Francisco Baykeeper to use Google Street View technology to map tides and sea level rise around the Bay. Former kellylabber Karin Tuxen-Bettman is involved. 

http://www.sfgate.com/bayarea/article/Google-camera-helps-capture-bay-s-rising-sea-6080481.php#photo-7524438

Update from the White House on their Climate Data Initiative

Yesterday the White House launched the second phase of the Climate Data Initiative, focused on leveraging climate data and innovation to make food systems more resilient to climate change and reduce the impact of agriculture on climate change.  We are delighted to have a range of Administration announcements and private sector commitments that came together for today’s news.
 
Here is a fact sheet describing what they are announcing today: http://www.whitehouse.gov/the-press-office/2014/07/29/fact-sheet-empowering-america-s-agricultural-sector-and-strengthening-fo
 
And here’s a blog from White House Science Advisor John Holdren and Secretary of Agriculture Tom Vilsack on the launch: http://www.whitehouse.gov/blog/2014/07/29/unleashing-climate-data-empower-america-s-agricultural-sector

Please share these widely with your partners and networks. Thanks for your support for the initiative and your commitment to acting on climate change!

NASA challenge announced: Open NASA Earth Exchange 2014

President Obama has announced a series of executive actions to reduce carbon pollution and promote sound science to understand and manage climate impacts for the U.S. 

Following the President’s call for developing tools for climate resilience, NEX is hosting a workshop that will feature:
  1. Climate science through lectures by experts;
  2. Computational tools through virtual labs; and
  3. A challenge inviting participants to compete for prizes by designing and implementing solutions for climate resilience.

An particularly exciting part of this initiative is the possibility to win cash prizes for innovative research ideas. You can find more information about labs and lectures here at https://nex.nasa.gov/opennex
and to participate in the challenge, you can go directly at https://www.innocentive.com/ar/challenge/9933584.

Pay attention! Especially grad students and young researchers! The first part of the challenge is the ideation challenge which will close on the 31st of July, 2014 and will follow up with another solvers challenge based on the ideas as selected form the ideation challenge. This will run through October so ample time to participate and win prizes.

White House Launches new Climate Data Initiative...

We are in the lovely "Indian Treaty" room.And we were there! Kevin and I went to the White House (here is photographic proof) to represent Cal-Adapt.

The President’s Climate Data Initiative was launched March 19th with the tagline: Empowering America’s Communities to Prepare for the Effects of Climate Change. The initiative is a complex partnership of government, industry, academia and local public to get the US ready for climate change. The overall goal of the climate data initiative is "Spark Innovation": release data, articulate challenges, turn data scientists loose. Here is the fact sheet and a blog post from John Podesta and John Holdren.

We saw some very interesting short talks from a range of speakers. Here are some highlights:

Jack Dangermond highlighted the many initiatives that ESRI is pushing to help with climate resilience. Kathyrn Sullivan from NOAA discussed her concept of "Environmental Intelligence", which describes the use of data to create resilience. She says: "NOAA capture 20TB daily, they release 2TB daily. Upon that data stream are built all the climate businesses we have today. What would this industry be like if we release the other 18TB?" Ellen Stofan from NASA talked about new earth observation missions, including satellites for precipitation, soil moisture, CO2, winds, aerosols. She announced another of a series of data driven challenges called "coastal inundation in your community". Rachel Kyte from the World Bank called their multiple initiatives "Open Data for Resilience". She said that climate change may eradicate the mission of the World Bank, because of its disproportionate impact on poorer communities worldwide. Rebecca More from Google gave us a fantastic overview of the Landsat, climate and topography missions that Google Earth Engine is working on. Google is contributing 1PT cloud storage, and 50 million CPU hours of collaboration.

Videos:

All was very inspiring and informative.

Here are some press links about the Initiative:

Big Data for sustainability: an uneven track record with great potential

An interesting position piece on the appropriate uses of big data for climate resilience. The author, Amy Luers, points out three opportunities and three risks.

She sums up:

"The big data revolution is upon us. How this will contribute to the resilience of human and natural systems remains to be seen. Ultimately, it will depend on what trade-offs we are willing to make. For example, are we willing to compromise some individual privacy for increased community resilience, or the ecological systems on which they depend?—If so, how much, and under what circumstances?"

Read more from this interesting article here.

Just how much do we need the rain?

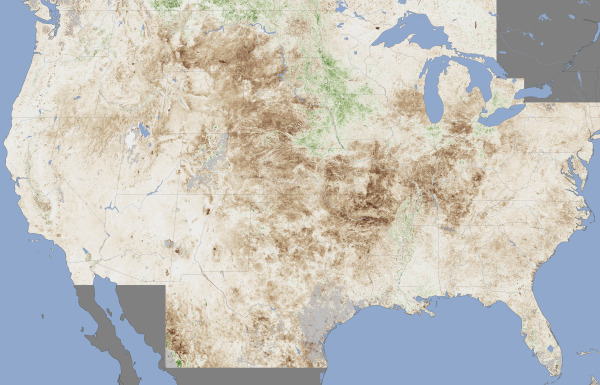
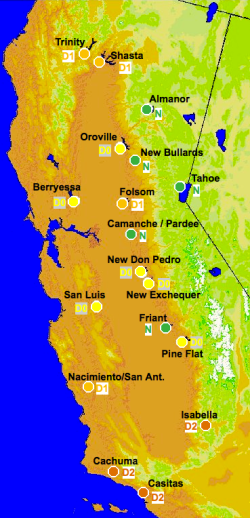
Reservoir Drought Monitor Categories - Sep 30, 2013

From DWR's California Data Exchange Center - Reservoirs.

Callfornia is a pretty dry state as we roll into the winter season, but the bad news is spread over the state in different ways.  As of September 30, 17 of the 18 main reservoirs in the state are below 50% of normal storage percentiles. That is not quite as bad as it sounds, 5 of these reservoirs - Friant, Tahoe, New Bullards Bar, Almador and our very own Camanche/Pardee (which catches the lovely water of the Mokolumne River and satiates us EBMUDders) - are classified as "Normal" status. Three reservoirs - Cachima, Casitas and Isabella - are classified as "Drought Severe" status. Those three are in the southern portion of the state.

For more on our water supplies, check out http://cdec.water.ca.gov.

In case you want to know more about the water we drink in Berkeley, the Mokelumne River is a 95-mile-long river flowing west from the central Sierra Nevada into the Central Valley and ultimately the Sacramento–San Joaquin River Delta, where it empties into the San Joaquin River. Together with its main tributary, the Cosumnes River, the Mokelumne drains 2,143 square miles (5,550 km2) in parts of five California counties.

The Upper Mokelumne River stretches from the headwaters to Pardee Reservoir in the Sierra foothills, and the Lower Mokelumne River is the portion of the river below Camanche Dam. Camanche and Pardee dams provide water for the east San Francisco Bay Area through the Mokelumne Aqueduct.

The name is Plains Miwok and is constructed from moke, meaning fishnet, and -umne, a suffix meaning "people of". Thanks Wikipedia!

San Francisco circa 2072

SF archipelago, c. 2072

Some fun before the semester starts! Like something out of a great scifi novel: from Burrito Justice (and via Mark O.) "March 20th, 2072 (AP), Northern California Association of City States: With the surprising acceleration of sea level rise due to the melting of both the Greenland and Antarctic ice sheets over the past decade, the San Francisco canal system was officially abandoned this week. Additional ferry service has been announced between the new major islands of the San Franciscan Archipelago while the boring machines make progress under the Van Ness Passage and Richmond Pass for new transit tunnels." This rad poster is available for sale!

California Climate Change Portal

Climate change is expected to have significant, widespread impacts on California's economy and environment. California's unique and valuable natural treasures - hundreds of miles of coastline, high value forestry and agriculture, snow-melt fed fresh water supply, vast snow and water fueled recreational opportunities, as well as other natural wonders - are especially at risk.

California is leading the way with prevention measures to reduce greenhouse gases, but no matter how quickly we cut our climate polluting emissions, climate impacts will still occur. Many impacts - increased fires, floods, severe storms and heat waves - are occurring already and will only become more frequent and more costly. There are many things we can do to protect against climate change impacts. Taking steps now to prepare for and adapt to climate change will protect public health and safety, our economy and our future.

The state of California has released the Climate Change Portal, where you will find resources you can use and actions you can take to address both climate change prevention and climate change adaptation. Cal-adapt is a big part of the portal.

Drought imagery from MODIS

As the warm weather moves west this week we think about those battling the drought in the midwest and northern states. Here is a shot from July from NASA's Moderate Resolution Imaging Spectroradiometer (MODIS) sensor, on the Terra satellite.  The map contrasts plant health in the United States between June 25 and July 10, 2012, against the average conditions between 2002 and 2012. Brown areas show where plant growth was less vigorous than normal; cream colors depict normal levels of growth; and green indicates abnormally lush vegetation. Data was not available in the gray areas due to snow or cloud cover. From NASA.

New Perpetual Ocean and Wind Map Animations

Two interesting natural phenomena spatial animations were recently released. The first is from NASA which visualizes ocean surface currents around the world from 2005 to 2007. The animations were generated from data modeled using NASA’s Estimating the Circulation and Climate of the Ocean, Phase II also known as ECCO2. For more information click here. See the video below:

The second is from HINT.FM which visualizes near real time wind movement patterns in the US using data from the National Digital Forecast Database. To see the animation click here. Here is a static screenshot from their website:

HINT.FM Wind Map

New Map Tool and Widgets: What’s Your Coastal Flood Risk?

This new interactive website SurgingSeas, a project of Climate Central, lets you see the combined coastal flood threat from sea level rise and storm surge, town by town and city by city from coast to coast. Type in your Zip code or the name of your community, choose a water level anywhere from 1 to 10 feet above the current high-tide line, and you can see what areas might be at risk of flooding from water that high. You can also go to any one of 55 tide gauges we studied around the country, and see the odds we’ve calculated for how soon flood waters may reach different elevations as the sea continues to rise. There are gauges close to most major coastal cities. If you want to embed the map in your own blog or website, there’s a widget for that, and you can make any view your default — not just the national one. - Michael D. Lemonick

New blue marble: history of its development on video

Recently, NASA released a new Blue Marble graphic, from sensors aboard TERRA. The Talk of the Nation Science Friday video of the week tells the story of these NASA's Blue Marble maps.  From the Apollo 8 crew's image from 1968, to the Apollo 17 mission of 1972, through the Voyager image, through modern remote sensing techniques, to 2002's original Blue Marble image (now used as the default background on the iphone), to this new release. They highlight the work of Rob Simmon and Gene Feldman, who discuss the composition of the product, highlighting the art that goes into the scientific product. Very cool! More discussion here.

Cal-Adapt featured on SmartPlanet

Smartplanet recently produced a video featuring Cal-Adapt.  See it here!

At UC Berkeley's Geospatial Innovation Facility software developers are building a Web-based mapping tool to help scientists prepare for the changing climate conditions in California. The team has culled data from various climate research organizations to get projection data of what different climates might look like over a 150-year period. SmartPlanet visits the lab to see a demo of how the tool works.

Details on ESRI's solar radiation tools

June solar radiation in YellowstoneA nice case study of detailed solar radiation modeling/mapping for Yellowstone National Park. All using existing ESRI spatial analyst tools.

Scientists at the National Aeronautics and Space Administration (NASA) Ames Research Center, including our buddy Chris Potter, the Yellowstone Ecological Research Center (YERC), the Creekside Center for Earth Observation (CCEO), and Esri have created 30-meter solar and temperature distribution maps in mountainous Yellowstone National Forest using tools in the ArcGIS Spatial Analyst extension. These products support ecological management in Yellowstone. 

An overview of ESRI's Solar Radiation Tools can be found here. Go forth and insolate.

Cal-adapt goes live: making California climate change data available to all

California - 2090 - Annual Average Temperature - High EmissionsThe exciting project the GIF staff have been working on for 9 months is ready to be revealed. Cal-Adapt is a web-based climate adaptation planning tool that will help local governments respond to climate change. The site was developed by UC Berkeley’s Geospatial Innovation Facility with funding and oversight from the California Energy Commission’s Public Interest Energy Research Program. The information for Cal-Adapt was gathered from California’s scientific community and represents the most current data available.


“Cal-Adapt will allow people to identify climate change risks in specific areas around the state.” said Secretary for Natural Resources, John Laird. “This tool will be especially beneficial to government agencies and city and county planners, as they will now have access to climate change information in a very user-friendly application.”


UC Berkeley press release.

USGS seeks input for new carbon accounting plan

A draft methodology is proposed in response to requirements by the Energy Independence and Security Act of 2007 to assess ecosystems for carbon stocks, carbon sequestration, and greenhouse-gas fluxes. The assessment will be conducted to estimate capacities of ecosystems to increase carbon sequestration and reduce greenhouse-gas fluxes, in contexts of land-use, land-cover, and land-management scenarios as well as other controlling processes, such as climate change and wildland fires. Results of the assessment will be useful for evaluating a range of choices for formulating mitigation strategies and other land management policies.

A year in the life of the world's precipitation: video

John Chiang gave the geolunch last week, and discussed the possible changes to tropical rainfall in the future. Tropical precipitation is controlled much differently than precipitation at the mid-latitudes.  To illustrate this, at the begining of his talk he showed us this video from UCAR/NCAR visualization team, which is a simluation for one year from the CommunitA snap from the video showing a Pacific storm about to drench Cali.y Climate System Model (CCSM), a coupled climate model for simulating Earth's climate system using the Community Atmosphere Model (CAM), the latest in a series of global atmosphere models developed at NCAR for the weather and climate research communities. Watch storms develop in the mid-latitudes as clear easterly moving systems; in the tropics you have daily convective action governing precipitation.