Landsat 8 imagery available

From Kelly:

Data collected by the Operational Land Imager (OLI) and the Thermal Infrared Sensor (TIRS) onboard the Landsat 8 satellite are available to download at no charge from GloVis, EarthExplorer, or via the LandsatLook Viewer

Orbiting the Earth every 99 minutes, Landsat 8 images the entire Earth every 16 days in the same orbit previously used by Landsat 5. Data products are available within 24 hours of reception. Check it.

Past fire visualization: SandTable to SimTable

Chips fire via SimTableWhile up at Forestry Camp, Mike DeLasaux turned us on to this site: SimTable. Apparently in the early days (and still today) sandtables were used to practice for wildland fire management. A few pictures are shown here. A nice tool developed to update the sandtable idea using digital data and fire modeling is SimTable. Their website also has some great visualizations of past fires with real fire perimeter data.

For example, check out the spread of the Chips fire using their website (image at right). The fire was first sighted on July 29, 2012, burning about 20 miles (32 km) west of Quincy, California. It burned through the begining of September 2012, eventually burning about 75,000 acres in Plumas and Lassen national forests. In late August, a series of backfires along the eastern flank of the fire were lit (check out the forest treatments in purple on the map) to slow the spread. News article about the backfire here. The site is: http://apps.simtable.com/fireProgression/tests/chips/simpleOverlay.html.

Here is the Chips burn scar from NASA.

PROBA-V satellite launched May 7

Proba-V’s first image of FranceI haven't used PROBA imagery, but many colleagues in Europe rely on this sensor.

PROBA-V (i.e. "vegetation") was launched May 7. The miniature satellite is designed to map land cover and vegetation growth across the entire planet every two days. The data can be used for alerting authorities to crop failures or monitoring the spread of deserts and deforestation.

Less than a cubic metre in volume, Proba-V is a miniaturised ESA satellite tasked with a full-scale mission: to map land cover and vegetation growth across the entire planet every two days.

Proba-V is flying a lighter but fully functional redesign of the Vegetation imaging instruments previously flown aboard France’s full-sized Spot-4 and Spot-5 satellites, which have been observing Earth since 1998.

Check it out: http://www.esa.int/Our_Activities/Technology/Proba_Missions/Proba-V_opens_its_eyes

LDCM releases first images of Earth!

Turning on new satellite instruments is like opening new eyes. This week, the Landsat Data Continuity Mission (LDCM) released its first images of Earth, collected at 1:40 p.m. EDT on March 18. The first image shows the meeting of the Great Plains with the Front Ranges of the Rocky Mountains in Wyoming and Colorado. The natural-color image shows the green coniferous forest of the mountains coming down to the dormant brown plains. The cities of Cheyenne, Fort Collins, Loveland, Longmont, Boulder and Denver string out from north to south. Popcorn clouds dot the plains while more complete cloud cover obscures the mountains.

Much more on the story and the images here:

http://www.nasa.gov/mission_pages/landsat/news/first-images-feature.html

Landsat 8 is up and orbiting!

Atlas 5 Rocket With Landsat PayloadFun day today watching the LDCM (Landsat Data Continuity Mission) make its successful launch of the newest and coolest sensor in the Landsat family. The flawless launch from Vandenburg AFB was witnessed with lots of cheering and earth-themed cupcakes in Mulford Hall!

While I am not actively using Landsat imagery, I used Landsat 4 and 5 imagery for my dissertation, back in the day, and use it still to introduce geographic concepts in class. And I am super excited to see the new imagery. The sensor has similar spectral bands to the ETM+ sensor on Landsat 7, but also I think includes a new coastal aerosol band (443 nm) and cirrus detection band (1375 nm). The legacy of the Landsat program is tremendous; the program has given us reliable, comprehensive, and detailed views of a dynamic earth for decades. It is a government sponsored science program with lasting impact.

Some nice write-ups about Landsat:

NASA Earth Observatory Landsat Looks and Sees
NASA Landsat: http://www.nasa.gov/mission_pages/landsat/main/index.html
USGS Landsat Missions: http://landsat.usgs.gov/
Landsat Top 10: http://www.nasa.gov/mission_pages/landsat/news/landsat-40th-top10.html

Anyway, it was nice to have everyone on board to witness the launch! Thanks GIF folks and everyone else in the lab. Now we just have to watch out for DA14 on Friday!

How to Download Lots of Lidar from the Digital Coast

Via LASTOOLS: Kirk Waters, physical scientist at NOAA, describes in his latest blog entry how to efficiently download lots of compressed LiDAR data in LAZ format from NOAA's Digital Coast servers:

http://www.csc.noaa.gov/digitalcoast/geozone/how-to-download-lots-of-lidar-on-digital-coast


He also conjectures that more LiDAR software will be able to input and output the LAZ format soon. After FME, TopoDOT, GlobalMapper, RiProcess, QT Modeler / QT Reader, ... (see http://laszip.org for a complete list of LAZ-enabled software and LAZ download sites).

The Coastal Services Center, home of the Digital Coast, is one cool place. I visited there in the 1990s while at NOAA-Beaufort and working with the C-CAP program.

Check out the GIF workshops for Spring 2013

The GIF workshop schedule for Spring 2013 has been posted! We have a new workshop this semester on Lidar! check it out!

GIF workshops offer hands-on applications oriented training in a variety of geospatial topics. Workshop fees are available at a subsidized rate of $84 for all UC students (graduate and undergraduate), faculty, and staff. Workshop fees are $224 for all non-UC affiliates.

Undergraduate students can apply for financial assistance to take a workshop through the GIF Undergraduate Scholarship Program.

Check them all out here.

New Landsat Satellite set to launch Feb 11th

NASA's Landsat Data Continuity Mission (LDCM) is scheduled to launch Feb. 11 from Vandenberg Air Force Base in California. A joint NASA and U.S. Geological Survey (USGS) mission, LDCM will add to the longest continuous data record of Earth's surface as viewed from space.

LDCM is the eighth satellite in the Landsat series, which began in 1972. The mission will extend more than 40 years of global land observations that are critical in many areas, such as energy and water management, forest monitoring, human and environmental health, urban planning, disaster recovery and agriculture. NASA and the USGS jointly manage the Landsat Program. Check out more info.

Lisa Schile is off to Abu Dhabi

Dr. Lisa Schile is off to Abu Dhabi for a postdoctoral research position with the Smithsonian Institution. She'll be working on a project monitoring carbon sequestration in wetlands. We checked out some of the available Abu Dhabi imagery on-line. The country has a long and interesting coastline, with many mangroves and wetlands, and of course the ever increasing coastal development. Here is a snapshot from NASA of coastal development. Lisa has started a blog, and taking lots of pics for us to see.

Launch of Sonoma County Veg Mapping Program

The Sonoma County Agricultural Preservation and Open Space District has begun a 3-5 year program to map Sonoma County’s diverse plant communities.

An accurate, up-to-date map of vegetation and habitat type is key to ensuring good planning and management for watershed protection, flood control, fire and fuels management, and wildlife habitat conservation. A vegetation map is also critical to assessing climate benefits provided by the landscape, such as the amount of carbon being absorbed from the atmosphere or the degree to which the landscape is buffering extreme weather events.

These folks are using 3-6-inch CIR imagery and obia to map vegetation across Sonoma County. GIF is serving up the imagery! Check it out!

Report from the Lidar and NCALM workshop

December 2 2012 the GIF and UC Merced scientists hosted a workshop on lidar for CZO support. This is an annual workshop organized by Dr. Qinghua Guo.

Qinghua presented an overview of his lidar work, which is pretty extensive, and Juan Carlos Fernandez Diaz from NCALM presented an overview of the NCALM program. He talked about the NCALM workflow and their instruments, including their new bathymetric lidar instrument (that can get bathy and terrestrial simultanously for coastal studies), their waveform lidar instrument, and their new balloon-based lidar instrument (cool!) They can run a suite of instruments at the same time: waveform and camera, etc. One of the great things he brought up is the support for graduate students:

The National Center for Airborne Laser Mapping surveys up to ten projects (each generally covering no more than 40 square kilometers) each year for graduate student PIs who need Airborne Laser Swath Mapping data. Beginning in 2012, graduate student PIs can specify either near infrared (Optech Gemini, 1064 nm) or green (Optech Aquarius, 532 nm) bathymetric ALSM data (only one wavelength can be selected), as well as optionally request high resolution aerial photography in conjunction with the ALSM collection. Graduate student proposals must define a basic research question in the geosciences (broadly defined). Check it out!

Introduction to the Web-enabled Landsat Data (WELD) products using open source software

Introduction to the Web-enabled Landsat Data (WELD) products using open source software

At American Geophysical Union Fall 2012 Meeting, San Francisco December 6, 2012
______________________________

The NASA funded Web-enabled Landsat Data (WELD) project is providing near-continental scale 30m Landsat time series products (http://weld.cr.usgs.gov).

This 4.5 hour training workshop will provide student and expert users with tips and techniques to handle the WELD products.

Participants will bring their own laptops and a Linux-like Virtual Machine will be installed with remote sensing and GIS open source software, sample WELD products, scripts, and example exercises that illustrate a variety of WELD environmental monitoring and assessment applications. Participants will be assisted through the example exercises and all training material will be available for their later consultation. New WELD product versions will be available and participant feedback and suggestions to evolve the WELD processing
algorithms, product contents and format will be sought.
More information at http://globalmonitoring.sdstate.edu/projects/weld/weldtraining.html

Cost: Free (No AGU Registration Fee Needed)
Date: December 6, 2012
Time: 6:00pm - 10:30pm
Location: San Francisco Marriott
Room: Sierra A

Aerial photography highlighted on new US Forever Stamps

Check out some of the gorgeous imagery that will be featured on a new series of US stamps. NASA imagery is highlighted, and the South Bay Salt ponds are featured on one stamp (see below). From the US Postal Service:

"Depicting America’s diverse landscapes on photos taken from ultra lights to satellites, the Earthscapes stamps provide a view of the nation’s diverse landscapes in a whole new way — from heights ranging from several hundred feet above the earth to several hundred miles in space.

south bay salt pondsThe stamps provide an opportunity to see the world in a new way by presenting examples of three categories of earthscapes: natural, agricultural, and urban. The photographs were all taken high above the planet’s surface, either snapped by satellites orbiting the Earth or carefully composed by photographers in aircraft. Howard E. Paine of Delaplane, VA, was the art director."


ESRI MODIS Toolbox

Cool MODIS NDVI tool pointed out to us from Jenny P.

This toolbox contains scripts that download NASA satellite imagery from MODIS and import it into ArcMap. The four data products currently supported are: evapotranspiration, land surface temperature, normalized difference vegetation index (NDVI), and enhanced vegetation index (EVI).

These products are available for the entire surface of the Earth at 1 km resolution and for any month going back to January 2000, when MODIS first launched aboard the satellite Terra.

http://resources.arcgis.com/gallery/file/geoprocessing/details?entryID=9CC382D2-1422-2418-34F8-DC9F97B24052

Bing Maps completes Global Ortho project for US

The Bing Maps team has anounced the completion of the Global Ortho Project for the US.  The project provides 30cm resolution imagery for the entire US, all acquired within the last 2 years.  You can access all of the imagery now through Bing Maps, it is pretty amazing to see such detail for all of the far off places that typically don't get high resolution attention. 

Find out more about the project from the Bing Maps Blog, or view the data for yourself.

See the bigger picture. Make a better world.

Earlier this week we in ESPM heard a report from the folks in the SWIRL marketing team, who have been working to extract the essence of what we do in ESPM and in CNR. Their proposed tagline for us is: "See the bigger picture. Make a better world." Which aptly describes what we do in applied geospatial sciences. I kinda wish I'd thought it up myself. And since this summer marks the 40th anniversary of the Landsat program, I thought I'd use this post to talk about how our ability to observe the earth from space does indeed fit this new tagline.

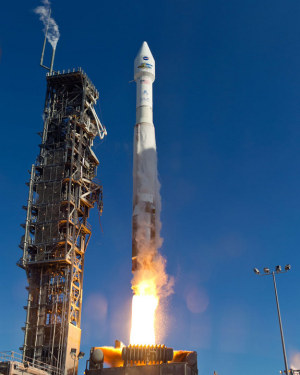
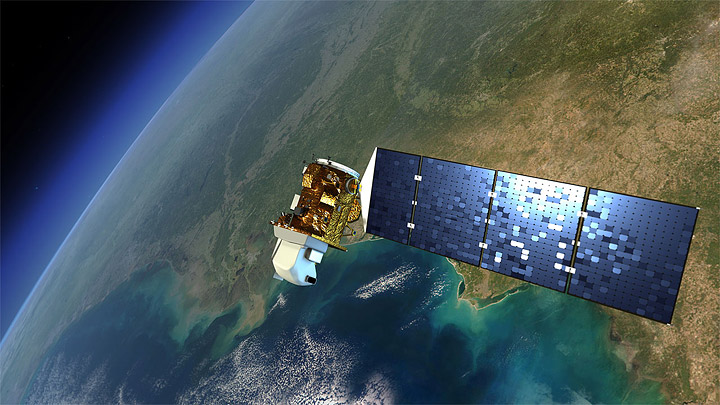
July 23, 1972 ERTS Earth Resources Technology Satellite (ERTS), later christened Landsat 1, was launched into a near-polar orbit. We had our first earth-watching, civilian science satellite. ERTS instruments recorded information in four spectral bands: red, green, and two infrared.

Remote sensing missions have continued through the decades that followed, making modern earth system science, landscape ecology, agriculture prediction, and many other fields possible. The Landsat missions continue with some blips: Landsat2 was launched in 1975, Landsat 3 in 1978; Landsat 4 in 1982 and Landsat 5 in 1984; in 1993 funds were found to keep Landsat 4 and 5 operational just before Landsat 6 failed upon launch in 1993 and ended up in the Indian Ocean. Landsat 5 only recently gave out after 27 year of imaging; Landsat 7, launched in 1999 continues its work as well.  The eighth satellite, dubbed the Landsat Data Continuity Mission (LDCM), is scheduled for launch in 2013. It will be the next chapter for the longest-operating Earth-observing program in the world. More information here: http://earthobservatory.nasa.gov.

Landsat 7 is entirely government owned and operated, and after launch, the USGS was charged with distributing the data at government (nonprofit) rates. Today, the USGS distributes Landsat data over the Internet for free, and usage has exploded. Back in the day, we had to pay for each scene individually. This tended to limit the ability to work at regional, let alone global scales.  The new model of data distribution has made a number of on-line resources and visuzalizations possible.  Additionally, there are currently a quarter of a million science citations that use Landsat imagery, focusing on agriculture, oceans, land change, urban and natural areas.

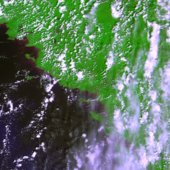
The first fully operational Landsat image taken on July 25, 1972, inaugurating a 40-year run when the first satellite was known as the Earth Resources Technology Satellite, or ERTS. Credit: NASA’s Earth Observatory

This image above was the first image from the Landsat program. It shows Dallas, TX. Check out those reservoirs!

Some nice write-ups about Landsat:

Landsat imagery:

Happy Fall Semester 2012!

Drought imagery from MODIS

As the warm weather moves west this week we think about those battling the drought in the midwest and northern states. Here is a shot from July from NASA's Moderate Resolution Imaging Spectroradiometer (MODIS) sensor, on the Terra satellite.  The map contrasts plant health in the United States between June 25 and July 10, 2012, against the average conditions between 2002 and 2012. Brown areas show where plant growth was less vigorous than normal; cream colors depict normal levels of growth; and green indicates abnormally lush vegetation. Data was not available in the gray areas due to snow or cloud cover. From NASA.

ASPRS 2012 Wrap-up

ASPRS 2012, held in Sacramento California, had about 1,100 participants. I am back to being bullish about our organization, as I now recognize that ASPRS is the only place in geospatial sciences where members of government, industry, and academia can meet, discuss, and network in a meaningful way. I saw a number of great talks, met with some energetic and informative industry reps, and got to catch up with old friends. Some highlights: Wednesday's Keynote speaker was David Thau from Google Earth Engine whose talk "Terapixels for Everyone" was designed to showcase the ways in which the public's awareness of imagery, and their ability to interact with geospatial data, are increasing. He calls this phenomena (and GEE plays a big role here): "geo-literacy for all", and discussed new technologies for data/imagery acquisition, processing, and dissemination to a broad public(s) that can include policy makers, land managers, and scientists. USGS's Ken Hudnut was Thursday's Keynote, and he had a sobering message about California earthquakes, and the need (and use) of geospatial intelligence in disaster preparedness.

Berkeley was well represented: Kevin and Brian from the GIF gave a great workshop on open source web, Kevin presented new developments in cal-adapt, Lisa and Iryna presented chapters from their respective dissertations, both relating to wetlands, and our SNAMP lidar session with Sam, Marek, and Feng (with Wenkai and Jacob from UCMerced) was just great!

So, what is in the future for remote sensing/geospatial analysis as told at ASPRS 2012? Here are some highlights:

  • Cloud computing, massive datasets, data/imagery fusion are everywhere, but principles in basic photogrammetry should still comes into play;
  • We saw neat examples of scientific visualization, including smooth rendering across scales, fast transformations, and immersive web;
  • Evolving, scaleable algorithms for regional or global classification and/or change detection; for real-time results rendering with interactive (on-the-fly) algorithm parameter adjustment; and often involving open source, machine learning;
  • Geospatial data and analysis are heavily, but inconsistently, deployed throughout the US for disaster response;
  • Landsat 8 goes up in January (party anyone?) and USGS/NASA are looking for other novel parterships to extend the Landsat lifespan beyond that;
  • Lidar is still big: with new deployable and cheaper sensors like FLASH lidar on the one hand, and increasing point density on the other;
  • Obia, obia, obia! We organized a nice series of obia talks, and saw some great presentations on accuracy, lidar+optical fusion, object movements; but thorny issues about segmentation accuracy and object ontology remain; 
  • Public interaction with imagery and data are critical. The Public can be a broader scientific community, or a an informed and engaged community who can presumably use these types of data to support public policy engagement, disaster preparedness and response.

AAG 2012 Wrap-up

NY skyline from Tim DeChant's blogAAG was a moderately large conference (just under 9,000) this year, held in mid-town NY. It was a brief trip for me, but I did go to some great talks across RS, GIScience, cartography, and VGI. I also went to a very productive OpenGeoSuite workshop hosted by OpenGeo. Some brief highights from the conference: Muki Hacklay discussed participation inequities in VGI: when you mine geoweb data, you are mining outliers, not society; there are biases in gender, education, age and enthusiasm. Agent-based modeling is still hot, and still improving. I saw some great talks in ABM for understanding land use change. Peter Deadman showed how new markets in a hot crop (like Acai) can transform a region quite quickly. Landsat 8 will likely be launched in early 2013, but further missions are less certain. My talk was in a historical ecology session, and Qinghua Guo and I highlighted some of the new modeled results of historic oak diversity in California using VTM data and Maxent.

Saturday evening I had the great pleasure of being locked in after hours at the NY Public Library for a session on historic maps. David Rumsey, with Humphrey Southall (University of Portsmouth) and Petr Pridal (Moravian Library) led a presentation introducing a new website: oldmapsonline.org. The website's goal is to provide a clearer way to find old maps, and provide them with a stable digital reference.