Sonoma County's historic aerial photographs

As part of the massive ongoing effort to map Sonoma County with high-res imagery and lidar, historic imagery of the county was collected and georeferenced. The Sonoma County Agricultural Preservation and Open Space District funded SFEI to mosaic 72 historic aerials taken over Sonoma County by the Department of Defense in 1942. Mark Tukman put together this web service with a image swiping tool showing the combination of the 2011 imagery service and the mosaiced historic imagery.
 
Sonomaopenspace.maps.arcgis.com

About the historic imagery: In 1942, the Department of War collected air photos in anticipation of a possible strike.  These photos are the earliest complete image set for Sonoma County and give us an unprecedented look at Sonoma County's agriculture and open space prior to the post World War II baby boom.

These images are snaps from the service, both from an area outside Rohnert Park in Sonoma County: on the left is the image from 1942, on the right is the area in 2011 showing considerable development.

2011 image

1942 aerial

Web mapping of high res imagery helps conservation

One of our collaborators on the Sonoma Vegetation Mapping Project has sent work on how web mapping and high resolution imagery has helped them do their job well. These are specific comments, but might be more generally applicable to other mapping and conservation arenas.

  1. Communicating with partnering agencies.
    • In the past year this included both large wetland restoration projects and the transfer of ownership of several thousands of acres to new stewards.
  2. Articulating to potential donors the context and resources of significant properties that became available for purchase.
    • There are properties that have been identified as high priority conservation areas for decades and require quick action or the opportunity to protect would pass.
  3. Internal communication to our own staff.
    • We have been involved in the protection of over 75 properties, over 47,000 acres. At this time we own 18 properties (~6500 acres) and 41 conservation easements (~7000  acres). At this scale high quality aerial imagery is essential to the size of land we steward and effective broad understanding. The way it is served as a seamless mosaic means it is available to extremely experienced and intelligent people who find the process of searching and joining orthorectified imagery by the flight path and row cumbersome or inefficient.
  4. Researching properties of interest.
    • Besides our own internal prioritization of parcels to protect, I understand that we receive a request a week for our organization’s attention towards some property in Sonoma. Orienting ourselves to the place always includes a map with the property boundary using the most recent and/or high quality imagery for the parcel of interest and its neighbors.  This is such a regular part of our process that we created a ArcGIS Server based toolset that streamlines this research task and cartography. The imagery service we consume as the basemap for all these maps is now the 2011 imagery service.  This imagery is of high enough resolution that we can count on it for both regional and parcel scale inspection to support our decisions to apply our resources.
  5. Orienting participants to site.
    • Our On the Land Program uses the imagery in their introduction maps to help visitors on guided hikes quickly orient to the place they are visiting and start folding their experience and sense of place into their visit.
  6. Complementing grant applications.
    • Grants are an important part of the funding for major projects we undertake. High quality imagery facilitates our ability to orient the grant reviewer and visually support the argument we are making which is that our efforts will be effective and worthy of funds that are in short supply.
  7. Knowing what the resources on a property are is an essential part of thoughtfully managing them.
    • In one example we used the aerial imagery (only a year old at the time) as a base map for botanists to classify the vegetation communities. These botanists are not experts in GIS, but by using paper maps with high resolution prints in the field they were easily able to delineate what they were observing on the ground on features interpreted in the photo.  We then scanned and confidently registered their hand annotations to the same imagery, allowing staff to digitized the polygons that represent the habitat observed. These vegetation observations are shared with Sonoma County and its efforts to map all the vegetation of Sonoma County.
  8. Conservation easement monitoring makes extensive use of aerial imagery.
    • In some cases we catch violations of our easements that are difficult to view on the ground, for example unpermitted buildings by neighbors on the lands we protect, illegal agriculture or other encroachment. It is often used to orient new and old staff to a large property before walking their and planning for work projects that might be part of prescribed management.
  9. The imagery helps reinforce our efforts to communicate the challenge to preserve essential connectivity in the developed and undeveloped areas of Sonoma County.
    • In the Sonoma Valley there is a wildlife corridor of great interest to us as conservation priority. Aerial imagery has been an important part of discussing large land holdings such as the Sonoma Developmental Center, existing conserved land by Sonoma Land Trust and others, and the uses of the valley for housing and agriculture.
  10. Celebration of the landscape cannot be forgotten.
    • We often pair this high quality aerial imagery with artful nature photography. The message of the parts and their relation to the whole are succinctly and poetically made. This is essential feedback to members and donors who need to see the numbers of acres protected with their support and have the heartfelt sense of success.

We look forward to the continued use of this data and the effective way it is shared.
 
We hope that future imagery and other raster or elevation data can be served as well as this, it would benefit many engaged in science and conservation.

Thanks to Joseph Kinyon, GIS Manager, Sonoma Land Trust

New GIF Director: Nancy Thomas

The GIF welcomes our new Executive Director Nancy Thomas, who joins us Monday November 10th. Nancy comes to us from the Spatial Analysis Center at Stanford. She has over 18 years of experience in managing successful remote sensing and GIS projects in both consulting and academic arenas. She was a early employee of Pacific  Meridian, one of the first remote sensing companies on the west coast. She has extensive experience in the development and analysis of geospatial data to map, monitor, and model land use and land cover for a variety of domestic and international natural resource management applications. She's given numerous presentations and workshops on geospatial technologies, and has facilitated numerous successful collaborations and training of geospatial research methods.

Please stop by the GIF and welcome her to the Berkeley community!

Mapping Intimidation

Violence against those who help manage and protect our public lands is an unfortunate reality in the United States.  Though the recent Cliven Bundy standoff served to publicly highlight tensions between public lands managers and private citizens, that was not an isolated incident.  High Country News has just released a map that its staff compiled to show incidents of intimidation of Federal officials across the West (http://www.hcn.org/issues/46.18/incidents-map).  As the map shows, these issues are widespread. 

Citizen science vs. MODIS on producing maps of atmospheric dust

Measurements by thousands of citizen scientists in the Netherlands using their smartphones and the iSPEX add-on are delivering accurate data on dust particles in the atmosphere that add valuable information to professional measurements. The iSPEX team, led by Frans Snik of Leiden University, analyzed all measurements from three days in 2013 and combined them into unique maps of dust particles above the Netherlands. The results match and sometimes even exceed those of ground-based measurement networks and satellite instruments. Here is the comparison of the maps produced by citizen science versus MODIS:

iSPEX map compiled from all iSPEX measurements performed in the Netherlands on July 8, 2013, between 14:00 and 21:00. Each blue dot represents one of the 6007 measurements that were submitted on that day. At each location on the map, the 50 nearest iSPEX measurements were averaged and converted to Aerosol Optical Thickness, a measure for the total amount of atmospheric particles. This map can be compared to the AOT data from the MODIS Aqua satellite, which flew over the Netherlands at 16:12 local time. The relatively high AOT values were caused by smoke clouds from forest fires in North America, which were blown over the Netherlands at an altitude of 2-4 km. In the course of the day, winds from the North brought clearer air to the northern provinces.

Read more at: 

http://phys.org/news/2014-10-citizen-science-network-accurate-atmospheric.html#jCp

King fire burn severity

The King Fire is out, but it leaves us with alot to ponder. It started September 13 and quickly jumped on a northward run through National Forest and private forestlands. At the end, it burned 97,717 acres. 12 houses and several other minor structures were lost. More worrying is the fact that it burned through many California Spotted Owl PACs in the Eldorado National Forest. We are waiting to hear from the SNAMP Owl team on what their assessment of the situation is. In the meantime, here is a map of burn severity for the fire, made by Stefania from data from the USFS. Clearly it burned hot.

Tracking a Discipline's Evolution

In lab group meetings we have been discussing the evolution and future of Spatial Data Science as a discipline.

Therefore when I recently stummbled upon a article about a reserarch project looking at the evolution of Geography based on a database of Doctoral Dissertation Titles, I couldn't help but be excited, and intrigued by the connection.

This reasearch from Kent University Professors David Kaplan and Jennifer Mapes is also reminiscent of Kelly Lab's own Shufei Lei's  recent work analyzing and mapping textual data in the context of ecological systems and adapative managment!

Just like spatial data science, Geography as a discipline has struggled with defining its' complex identity, its principles and concepts spanning and borrowing from several established discipinces. 

From the article:

"Geography is a relatively young discipline in terms of university academics, and for much of its history, geographers have struggled to define what exactly the discipline includes, said Keith Woodward, an assistant professor of geography at the University of Wisconsin at Madison.

So for a historical perspective, this type of database would be helpful looking at a timeline of how geographers defined their field, Woodward said."

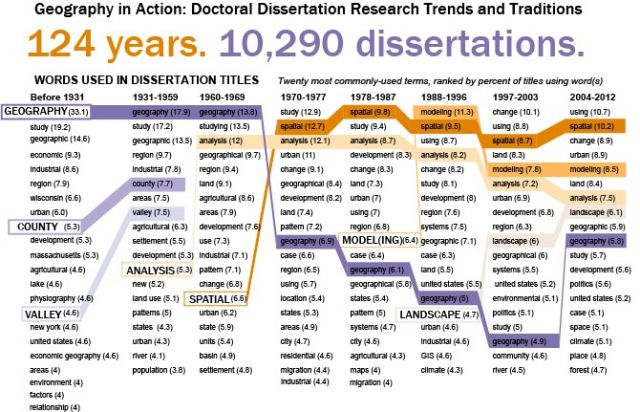
The database is a compliation of 10,290 dissertations ranging back to the late 1800's with the goal of understanding the trends, concentrations, and expansion of Geography as a discipline over time. 

Although currently unpublished (look out for an article in Geographical Review early 2015) there are a few preliminary findings and possibilites that sound immensly interesting:

"The study maps which universities have high percentages of dissertations focused on domestic or foreign regions, and also shifts in which regions of the world were popular topics for dissertations."

"A database of dissertations could provide a glimpse into what academics are interested in and how their focuses shifts as de-colonization and globalization occurs, Woodward said."

"Much of the focus so far has been on the words within the dissertation titles and how they’re used. Geographers today like to explain the field as a study of space and place, Mapes said. But those words didn’t become popular in dissertations until the 1960s."

Read the full article here and look out for an article in Geographical Review early 2015.
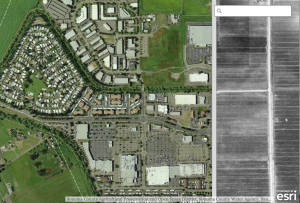
Workshop: create maps for Ebola's first responders

Workshop: HOW TO CREATE MAPS FOR EBOLA's FIRST RESPONDERS which are used by Doctors Without Borders, Red Cross, WHO and others. The workshop quickly shows how to easily use a humanitarian mapping freeware so anyone can contribute to this global mapping collaboration.


Easy‐to‐Learn and Then Map on Your Own Time

Volunteer now! Join contributors world‐wide and help create the maps which are being used in the fight against Ebola. Easy to make, these maps are for first responders including the World Health Organization, Red Cross, Doctors Without Borders and others.

Come and Learn how to map rooftops in cities and the paths and roadways to remote villages using Open Street Map and satellite images. First responders need your help today.

  • You’ll learn about this global collaboration

  • You’ll see how to use OpenStreetMap’s humanitarian mapping freeware which is quickly becoming the communication tool used by international first

    responders

  • And, you can share your ideas on how you can participate in this collaborative effort.
  •  

D‐LAB (356 Barrows Hall)

Thursday, October 30th, 1:00 – 2:00 p.m.
Friday, October 31st, 10:00 – 11:00 a.m.

Register:  http://dlab.berkeley.edu/training

Patty's update from the Geospatial Computational Social Sciences conference at Stanford

Patty Frontiera from the D-Lab went to the Geospatial Computational Social Sciences conference at Stanford on Monday 10/20 (https://css-center.stanford.edu/geospatial-computational-social-science-conference).

Here is her summary:

1. GIS for Exploratory Data Analysis

  • The presentations showed that geospatial analysis and mapping using desktop GIS, R and python are an extremely important part of exploratory data analyses in the social sciences.

2. GIS for Communication / Visualization

  • Digital maps and web maps are an important part of communicating the results of scientific analysis. However effective communication with any kind of graphic / visualization tool may require additional funding for design professionals which researchers typically are not.

3. Garbage in Garbage out - or good computational tools don't replace good thinking.

  • Ed Chi a research scientist at Google gave a great talk on the analysis of implicit location data in twitter content. One point he made is that there are great tools for parsing and analyzing these data but bad data can creep in when the tools are used without thoughtful consideration of the data inputs and outputs. For example, just because someone entered "Donkey-Kong, Texas" as their home town and a geocoder parsed that and returned a valid coordinate pair does not mean that that town exists. He would be a great speaker to get at Berkeley.

4. Uses of GIS in Social Science

  • A panel discussed the uses of GIS in social science research. The key points they made were:
    • GIS is an important tool for linking social and environmental data.
    • GIS is important for exploring data at different geographic and temporal scales.
    • The use of GIS in social science research requires and benefits from an interdisciplinary approach.

5. Academia-Industry Collaboration

  • There were three industry speakers, one each from Facebook, Google, and EBay. They discussed collaboration with academia, making the following points:
    • Because it takes so long to establish a working relationship and because a tremendous amount of effort goes into creating data sets that can be made available for social science research, universities should work on developing long term relationships with industry rather than come ask for data for one-off projects.
    • Academia should participate in the development of open standards for space-time geospatial data formats.
    • Academia should not insist on overly restrictive licensing terms.
    • Industry likes collaborating with social scientists (as opposed to computer scientists) because they have different goals from industry and thus it is more of a mutually beneficial rather than competitive relationship.

6. Social Science Research Needs with regard to Geospatial computational Analysis:

  1. Social scientists need training in the following areas: GIS, R, Python, SQL, data cleaning, geospatial data file formats, and computing infrastructure.
  2. Data reuse and research replication: because of how long it takes to obtain and clean data, social scientists need infrastructure to facilitate data sharing and reuse.
  3. Academia needs to recognize the value of data intensive social science though the use of alt metrics. Stanford Press just received a Mellon grant to explore alt metrics movement.

7. Social scientist..data scientist..computer scientist?

  • There was a heated discussion on whether or not a social scientist needs to become a computer scientist and what the nature of the relationship should be between these two fields.  This was a really good discussion which may be worth having at Berkeley.
    • Do social scientists need to become data scientists?
    • What level of computational training is enough?
    • Do computer scientists need social scientists too?
    • There is a tension in the disciplines of applied computer science (maker culture) and social sciences/humanities (idea culture).


Workshop on Oct 19: Planet Mapping: The Science of 3D Maps

swissnex San Francisco
730 Montgomery St., San Francisco, 94111
- See more at: http://www.swissnexsanfrancisco.org/event/planetmapping/#sthash.G5iIInIJ.dpuf
swissnex San Francisco
730 Montgomery St., San Francisco, 94111
- See more at: http://www.swissnexsanfrancisco.org/event/planetmapping/#sthash.G5iIInIJ.dpuf

Planet Mapping: The Science of 3D Maps. Find out what tools and techniques are enabling today’s modern cartographers to render 3D maps.

Location: swissnex San Francisco
730 Montgomery St., San Francisco, 94111

Our world is constantly being captured through GPS, cameras, satellites, and scanners and rendered by algorithms into navigable maps of Planet Earth. But how are 3D maps really made? How is the data collected?
Hear from some of the hottest startups in the field about the science and technology behind 3D map making—from data collection, to processing, to display—and discover how you can make your own 3D maps.
During the event, enjoy the visual stimulation of the PLACEMAKERS exhibit on view at swissnex San Francisco.

Program:

  • 6:30 pm doors open
  • 7:00 pm intro
  • 7:10 pm talks + Q&A
  • 8:45 pm networking reception

See more at: http://www.swissnexsanfrancisco.org/event/planetmapping/#sthash.G5iIInIJ.dpuf

Our world is constantly being captured through GPS, cameras, satellites, and scanners and rendered by algorithms into navigable maps of Planet Earth. But how are 3D maps really made? How is the data collected?

Hear from some of the hottest startups in the field about the science and technology behind 3D map making—from data collection, to processing, to display—and discover how you can make your own 3D maps.

During the event, enjoy the visual stimulation of the PLACEMAKERS exhibit on view at swissnex San Francisco.

Program

6:30 pm doors open
7:00 pm intro
7:10 pm talks + Q&A
8:45 pm networking reception

- See more at: http://www.swissnexsanfrancisco.org/event/planetmapping/#sthash.G5iIInIJ.dpuf

Mapping Ebola Over Time

HealthMap is an automated electronic information system that monitors data from electronic media sources (e.g. social media, government websites, physician social networks) in order to visualize and foster an understanding of infectious disease outbreaks around the world.  The system is credited with recognizing the current Ebola epidemic in West Africa nine days before the World Health Organization was able to do so (see: http://www.politico.com/story/2014/08/healthmap-ebola-outbreak-109881.html?hp=l8).  Here you can access their visualization of the spread of Ebola across West Africa, and later into Europe and the United States: http://healthmap.org/ebola/#timeline.

ASPRS scholarship application deadline Oct 31

ASPRS SCHOLARSHIPS APPLICATION DEADLINE FOR THE 2015 AWARDS YEAR IS OCTOBER 31, 2014

New for 2015, the DigitalGlobe Foundation Award for the Application of High-Resolution Digital Satellite Imagery will make available one new collection of imagery in addition to the archive imagery previously available.  Applicants may apply for one new collection from any of DigitalGlobe’s five satellites (IKONOS, QuickBird, GeoEye-1, WorldView-1, and WorldView-2), not exceeding 500 square kilometres. Grant of a new collection may not compete with areas experiencing high demand for satellite resources or with DigitalGlobe Regional Affiliates (Contact the DigitalGlobe Foundation for details). This is limited to one new collection that will be granted within one calendar year, conditioned upon satellite availability and a strong application.
 
The SAIC/Estes Memorial Teaching Award will now be supported by Leidos whose mission ‘…is built on a commitment to do the right thing for our customers, our people, and our community.”  The Award will be known as the Leidos/Estes Memorial Teaching Award.
 
FOR SCHOLARSHIP DETAILS, GO TO: http://www.asprs.org/ASPRS-Awards-and-Scholarships.html

Upcoming local conferences of interest

IMAGE as LOCATION

Wednesday, October 22, 9:00 AM – 5:30 PM. Banatao Auditorium, 310 Sutardja Dai Hall, UC Berkeley

Tickets available online: http://www.eventbrite.com/e/image-as-location-conference-tickets-12860529189

When man-made images constitute the evidence of our environment and even our existence, how is our perception of the world manipulated and shaped?  The IMAGE as LOCATION conference brings together artists, technologists, and theorists to discuss how images define our understanding of our environment by allowing us to access the inaccessible. Beginning at the microscopic scale and moving through our human dimensions into planetary orbits, we will discover what it means to wrap our world in visual artifacts both from a cultural and public policy perspective.

Stanford’s Geospatial Computational Social Science Conference

Monday, October 20, 2014, 8:30 - 5:15, Mackenzie Room (#300), Huang Engineering Center, 475 Via Ortega, Stanford, CA 94305

Speakers join us from Airbnb, Facebook, Google, and more. 

Students! Apply for the NASA DEVELOP

All students (grad, undergrad, recent graduates) interested in geospatial technology: the application for the NASA DEVELOP Program in Spring 2015 term opens this Monday, September 29th, and runs through November 7th. 

The NASA DEVELOP National Program fosters an interdisciplinary research environment where applied science research projects are conducted under the guidance of NASA and partner science advisors. DEVELOP is unique in that young professionals lead research projects that focus on utilizing NASA Earth observations to address community concerns and public policy issues. With the competitive nature and growing societal role of science and technology in today’s global workplace, DEVELOP is fostering an adept corps of tomorrow’s scientists and leaders.

This is a great program, and several CNR students have been involved, and have great things to report.

Students can apply here: http://develop.larc.nasa.gov/apply.html

High resolution free DEM data released for Africa

SRTM 3 Arc-Second (approx. 90m) SRTM 1 Arc-Second (approx. 30m) Landsat 7 December 17, 2000

Just in time for class on topography and rasters tomorrow: new high res shuttle DEM data is being released for Africa. The image above shows the Niger River Delta in 90m res, 30m res, and landsat.

From the press release: In Africa, accurate elevation (topographic) data are vital for pursuing a variety of climate-related studies that include modeling predicted wildlife habitat change; promoting public health in the form of warning systems for geography and climate-related diseases (e.g. malaria, dengue fever, Rift Valley fever); and monitoring sea level rise in critical deltas and population centers, to name just a few of many possible applications of elevation data.

On September 23, the National Aeronautics and Space Administration (NASA), the National Geospatial-Intelligence Agency (NGA), and the U.S. Geological Survey (USGS, a bureau of the U.S. Department of the Interior) released a collection of higher-resolution (more detailed) elevation datasets for Africa. The datasets were released following the President’s commitment at the United Nations to provide assistance for global efforts to combat climate change. The broad availability of more detailed elevation data across most of the African continent through the Shuttle Radar Topography Mission (SRTM) will improve baseline information that is crucial to investigating the impacts of climate change on African communities.

Enhanced elevation datasets covering remaining continents and regions will be made available within one year, with the next release of data focusing on Latin America and the Caribbean region. Until now, elevation data for the continent of Africa were freely available to the public only at 90-meter resolution. The datasets being released today and during the course of the next year resolve to 30-meters and will be used worldwide to improve environmental monitoring, climate change research, and local decision support. These SRTM-derived data, which have been extensively reviewed by relevant government agencies and deemed suitable for public release, are being made available via a user-friendly interface on USGS’s Earth Explorer website.

Nice slider comparing the 90m to the 30m data here.

Raining on the King Fire

wunderground mapWundermap has a nice interface where you can add fires to your animated weather radar map. I caught this snap as our rare September storm (an atmospheric river apparently) moved over the King fire this afternoon. It radically changed the flow of the smoke plume, which shifted from northeastly to northerly. According to Scott, who talked to Rob, it was dumping up at Blodgett. So we will see what this means for the fire tomorrow.

How Scotland voted

Reds are Yes, blues are NoHere is a map of voting results from yesterday's historic independence vote in Scotland. Overall the Nos carried the day - 55% - 45%. Interestingly, Motherwell and Hamilton, two towns in my family's life, were split. Motherwell voted Och Aye and Hamilton voted the Noo.

From http://www.ctvnews.ca/world/how-scotland-voted-map-of-referendum-results-1.2014138

King fire update

Blodgett looks like it is going to be OK, but the King fire is burning through the SNAMP Eldorado study area. This is where the SNAMP owl reasearchers are doing their work. We are getting a response from them to post on the SNAMP website.

Center for Forestry map of the King Fire

Inciweb (why don't they publish the fire boundary file any more????)

Carlin Starrs gets her perimeters from http://ftpinfo.nifc.gov/

Geomac - http://www.geomac.gov/asp-bin/GeoMACKML/getKML.aspx

and the NIFC FTP server at ftp://ftp.nifc.gov/Incident_Specific_Data/CALIF_N/!2014_FEDERAL_Incidents/CA-ENF-023461_King/IR/

We will keep our eyes on it.

And Happy 100th Anniversary Berkeley Forestry!