I started this last year when I was working on a retrospective of remote sensing of forests in California for the centennial of Berkeley Forestry. In the article I tried to highlight some of the pioneering work done by remote sensors that focused on Californian forests from the 1960s through the use of lidar today. As is often the case, the paper changed into something a bit more focused on lidar technology, and I had to cut most of the Colwell stuff. So, I reprise some information about him here, add my perspective on his work as antecedants to modern OBIA approaches, and include his rad interior design ideas.
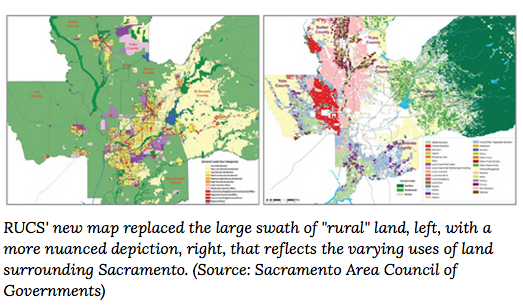
 Early musings on forest objects by Colwell in 1964.
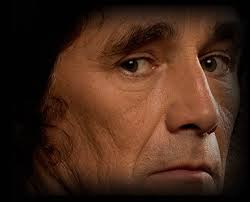
Dr. Colwell was an internationally renowned remote sensing scientist; he was former associate director of the Space Sciences Laboratory at the UC Berkeley, and he was the instructor of remote sensing in our own Mulford Hall from 1947 until his retirement in 1983. He was NASA co-investigator for Apollo IX, and his research in the 1960s on reflectance and multispectral reconnaissance were the primary basis for selecting the type of sensors and the spectral bands implemented in Landsat. Neat guy, and we all benefit from his intellectual legacy.
Finding meaningful blobs - a geographer’s quest
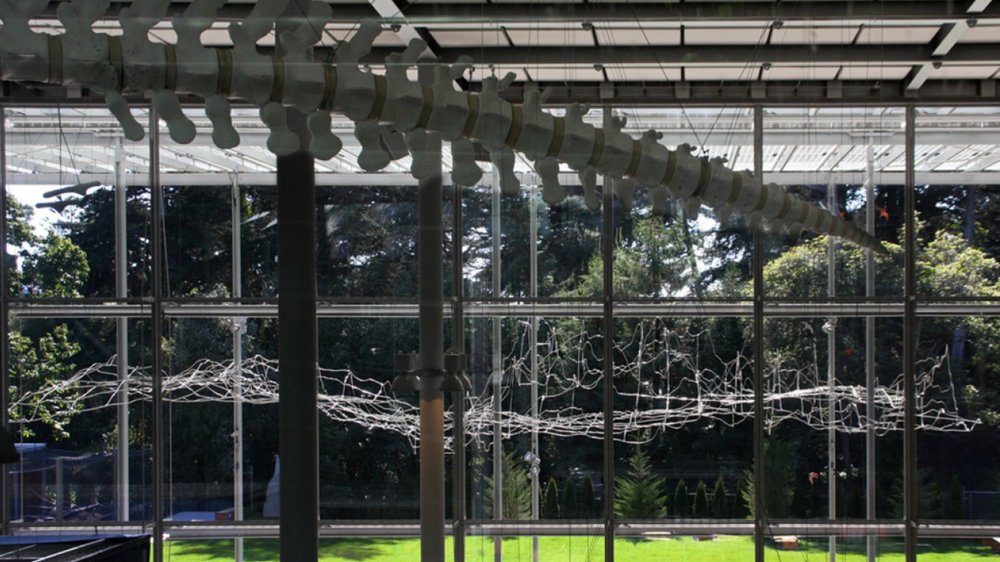
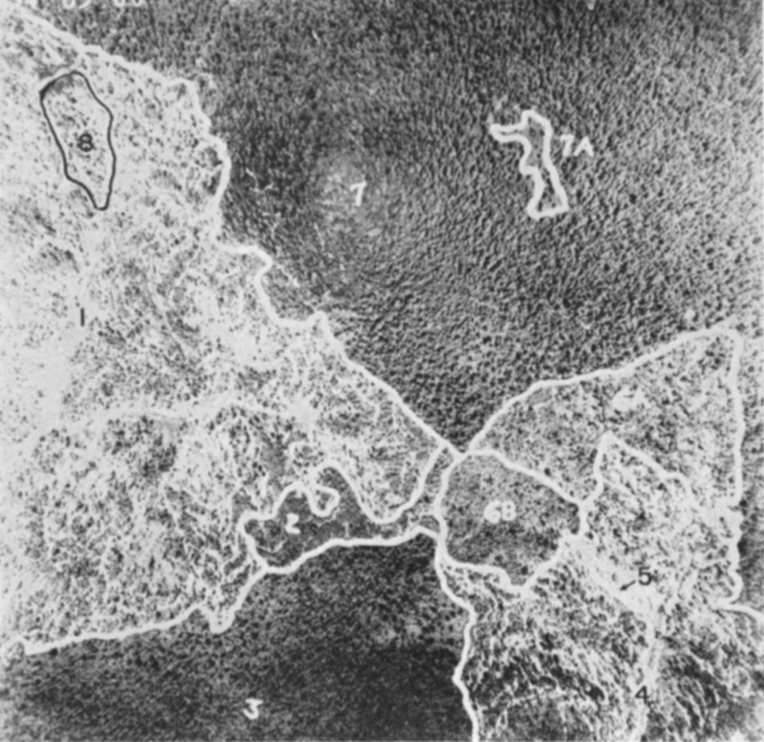
In our new Taylor and Francis book chapter, Thomas Blaschke, Helena Merschdorf, and I discuss Object-Based Image Analysis: Evolution, History, State of the Art, and Future Vision (Book website). I did some work looking into Colwell's work, and found lots of discussion of nascent work describing object based approaches to image analysis. He struggled with the inability of algorithms to pull from digital imagery meaningful "blobs". See the examples here.
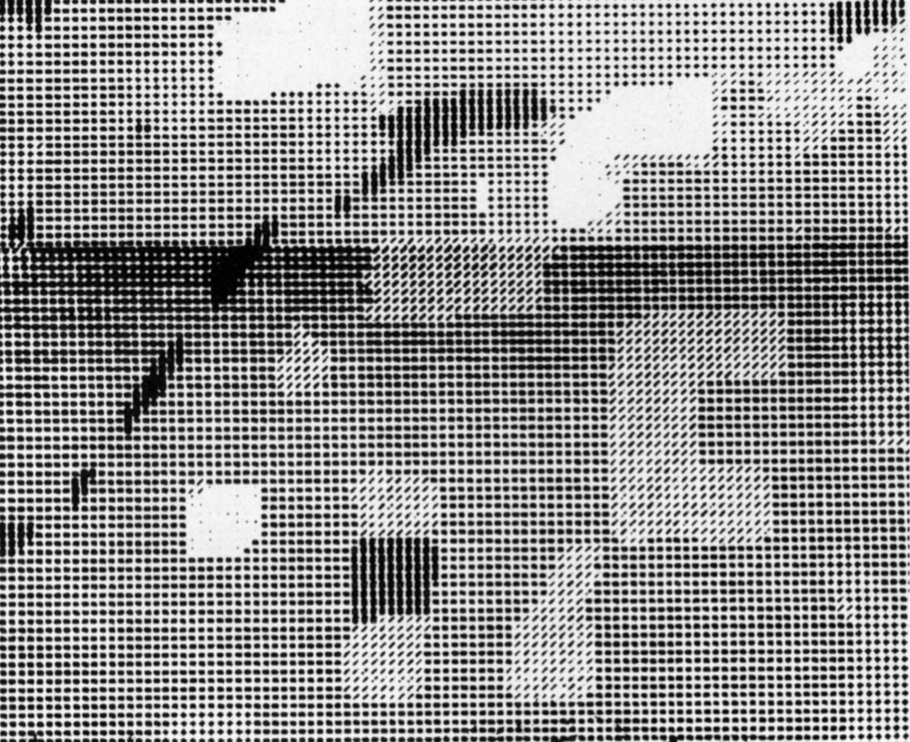 One of Colwell's early attempts at object based work from 1973. Printout on a dot matrix printer?
His assessment of the potential for automation of an object recognition process depended on the capacities of a digital scanner and the ability of an algorithm to assess the differences, in photographic tone, between a "blob" and its surroundings (Colwell 1964, 1965). Colwell was an important advisor on the Landsat 1 mission, and his ideas on extraction of meaningful features transferred to his ambitions for the satellite missions (Colwell 1973).
Maps as hipster decorations
I read some of his work as he transitioned from aerial photography to digital imaging, and I came across this picture. Mulford is just off the scene in the upper left corner, and Hearst Gym pool is visible in lower part.
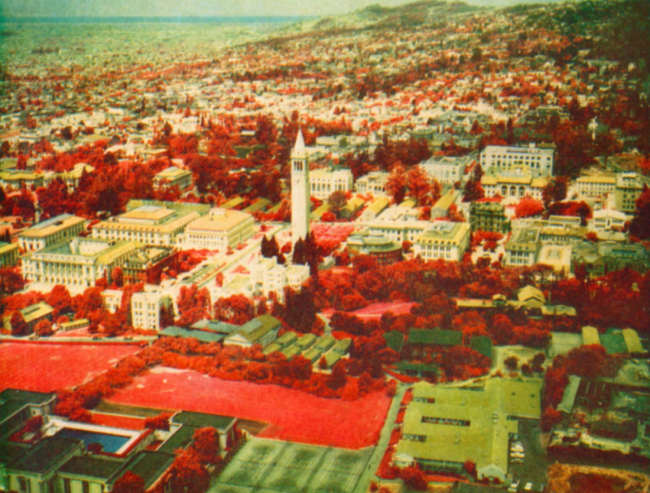 Oblique aerial view of Berkeley Campus of University of California taken with Camouflage Detection film. Robert N. Colwell
In his caption he says:
"Oblique aerial view of Berkeley Campus of University of California taken with Camouflage Detection film."(That is what they used to call color infrared.) "Such photography is superior to any other for certain photo interpretation purposes as indicated by some of the preceding examples. Note in this photo how color values for each species of tree tend to remain uniform from foreground to background because of the superior haze penetration offered by this film. The relatively long wavelengths to which this infrared-sensitive film reacts are scattered but very little by atmospheric haze particles, thus accounting for the uniform color values and for excellent image sharpness." I dig this part: "The original color transparencies have the same color values as seen here and consequently make very attractive panels for lamp shades, although certain of their colors fade upon prolonged exposure to light."
The trend for using map products as kitchy home decorations PRE-DATES 1970! Take that hipsters!
Articles mentioned:
Colwell, R.N. 1964. Aerial photography - A valuable sensor for the scientist. American Scientist, Vol. 52, No. 1 (MARCH 1964), pp. 16-49
Colwell, R.N., 1973. Remote Sensing as an Aid to the Management of Earth Resources. American Scientist. 61(2): 175-183.
Some more about him here: http://senate.universityofcalifornia.edu/inmemoriam/robertcolwell.htm
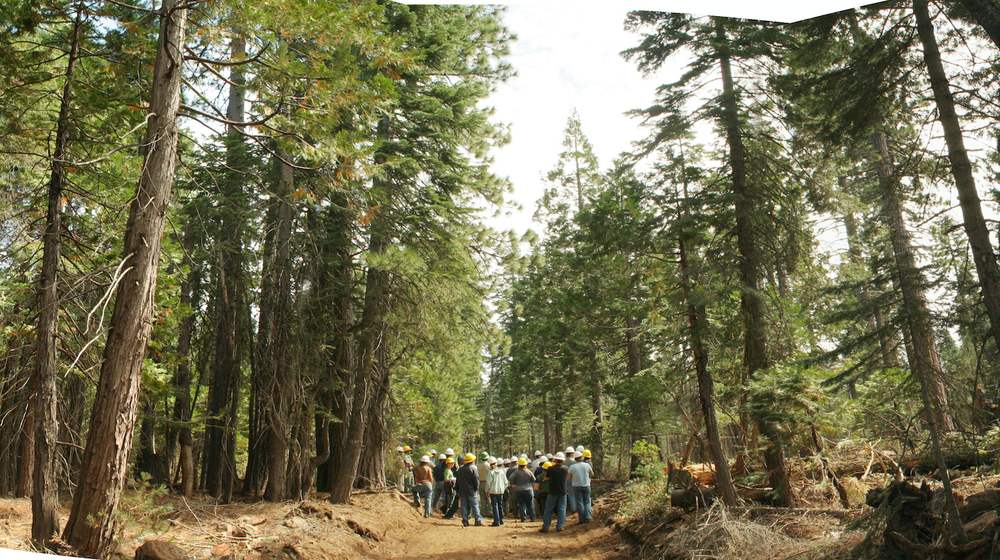
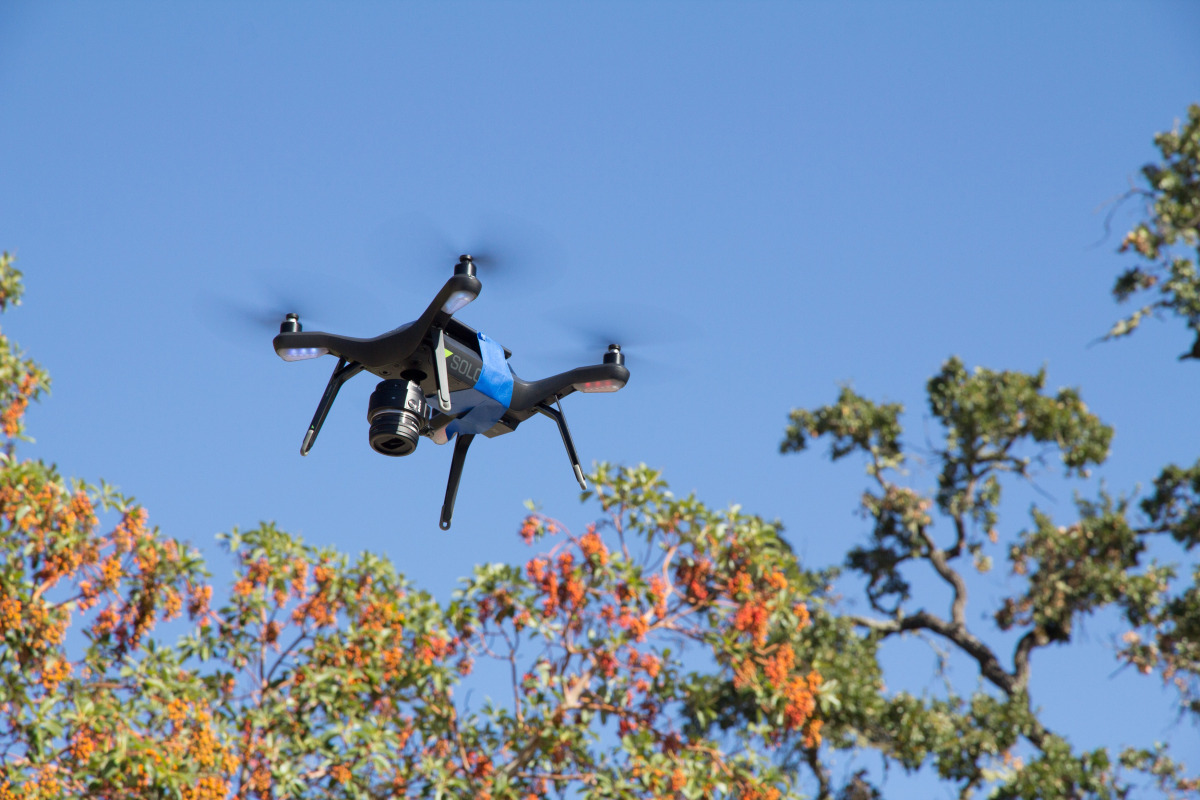
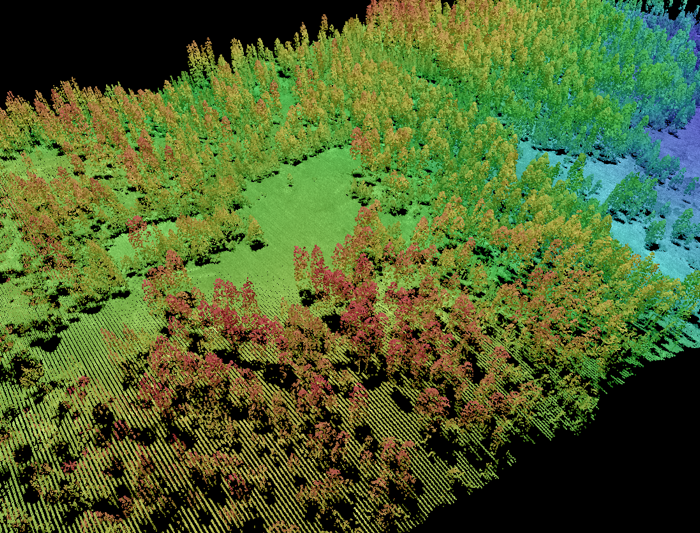 Lidar point cloud forest stand: Marek Jakubowski