Distillation from the NEON Data Institute

So much to learn! Here is my distillation of the main take-homes from last week. 

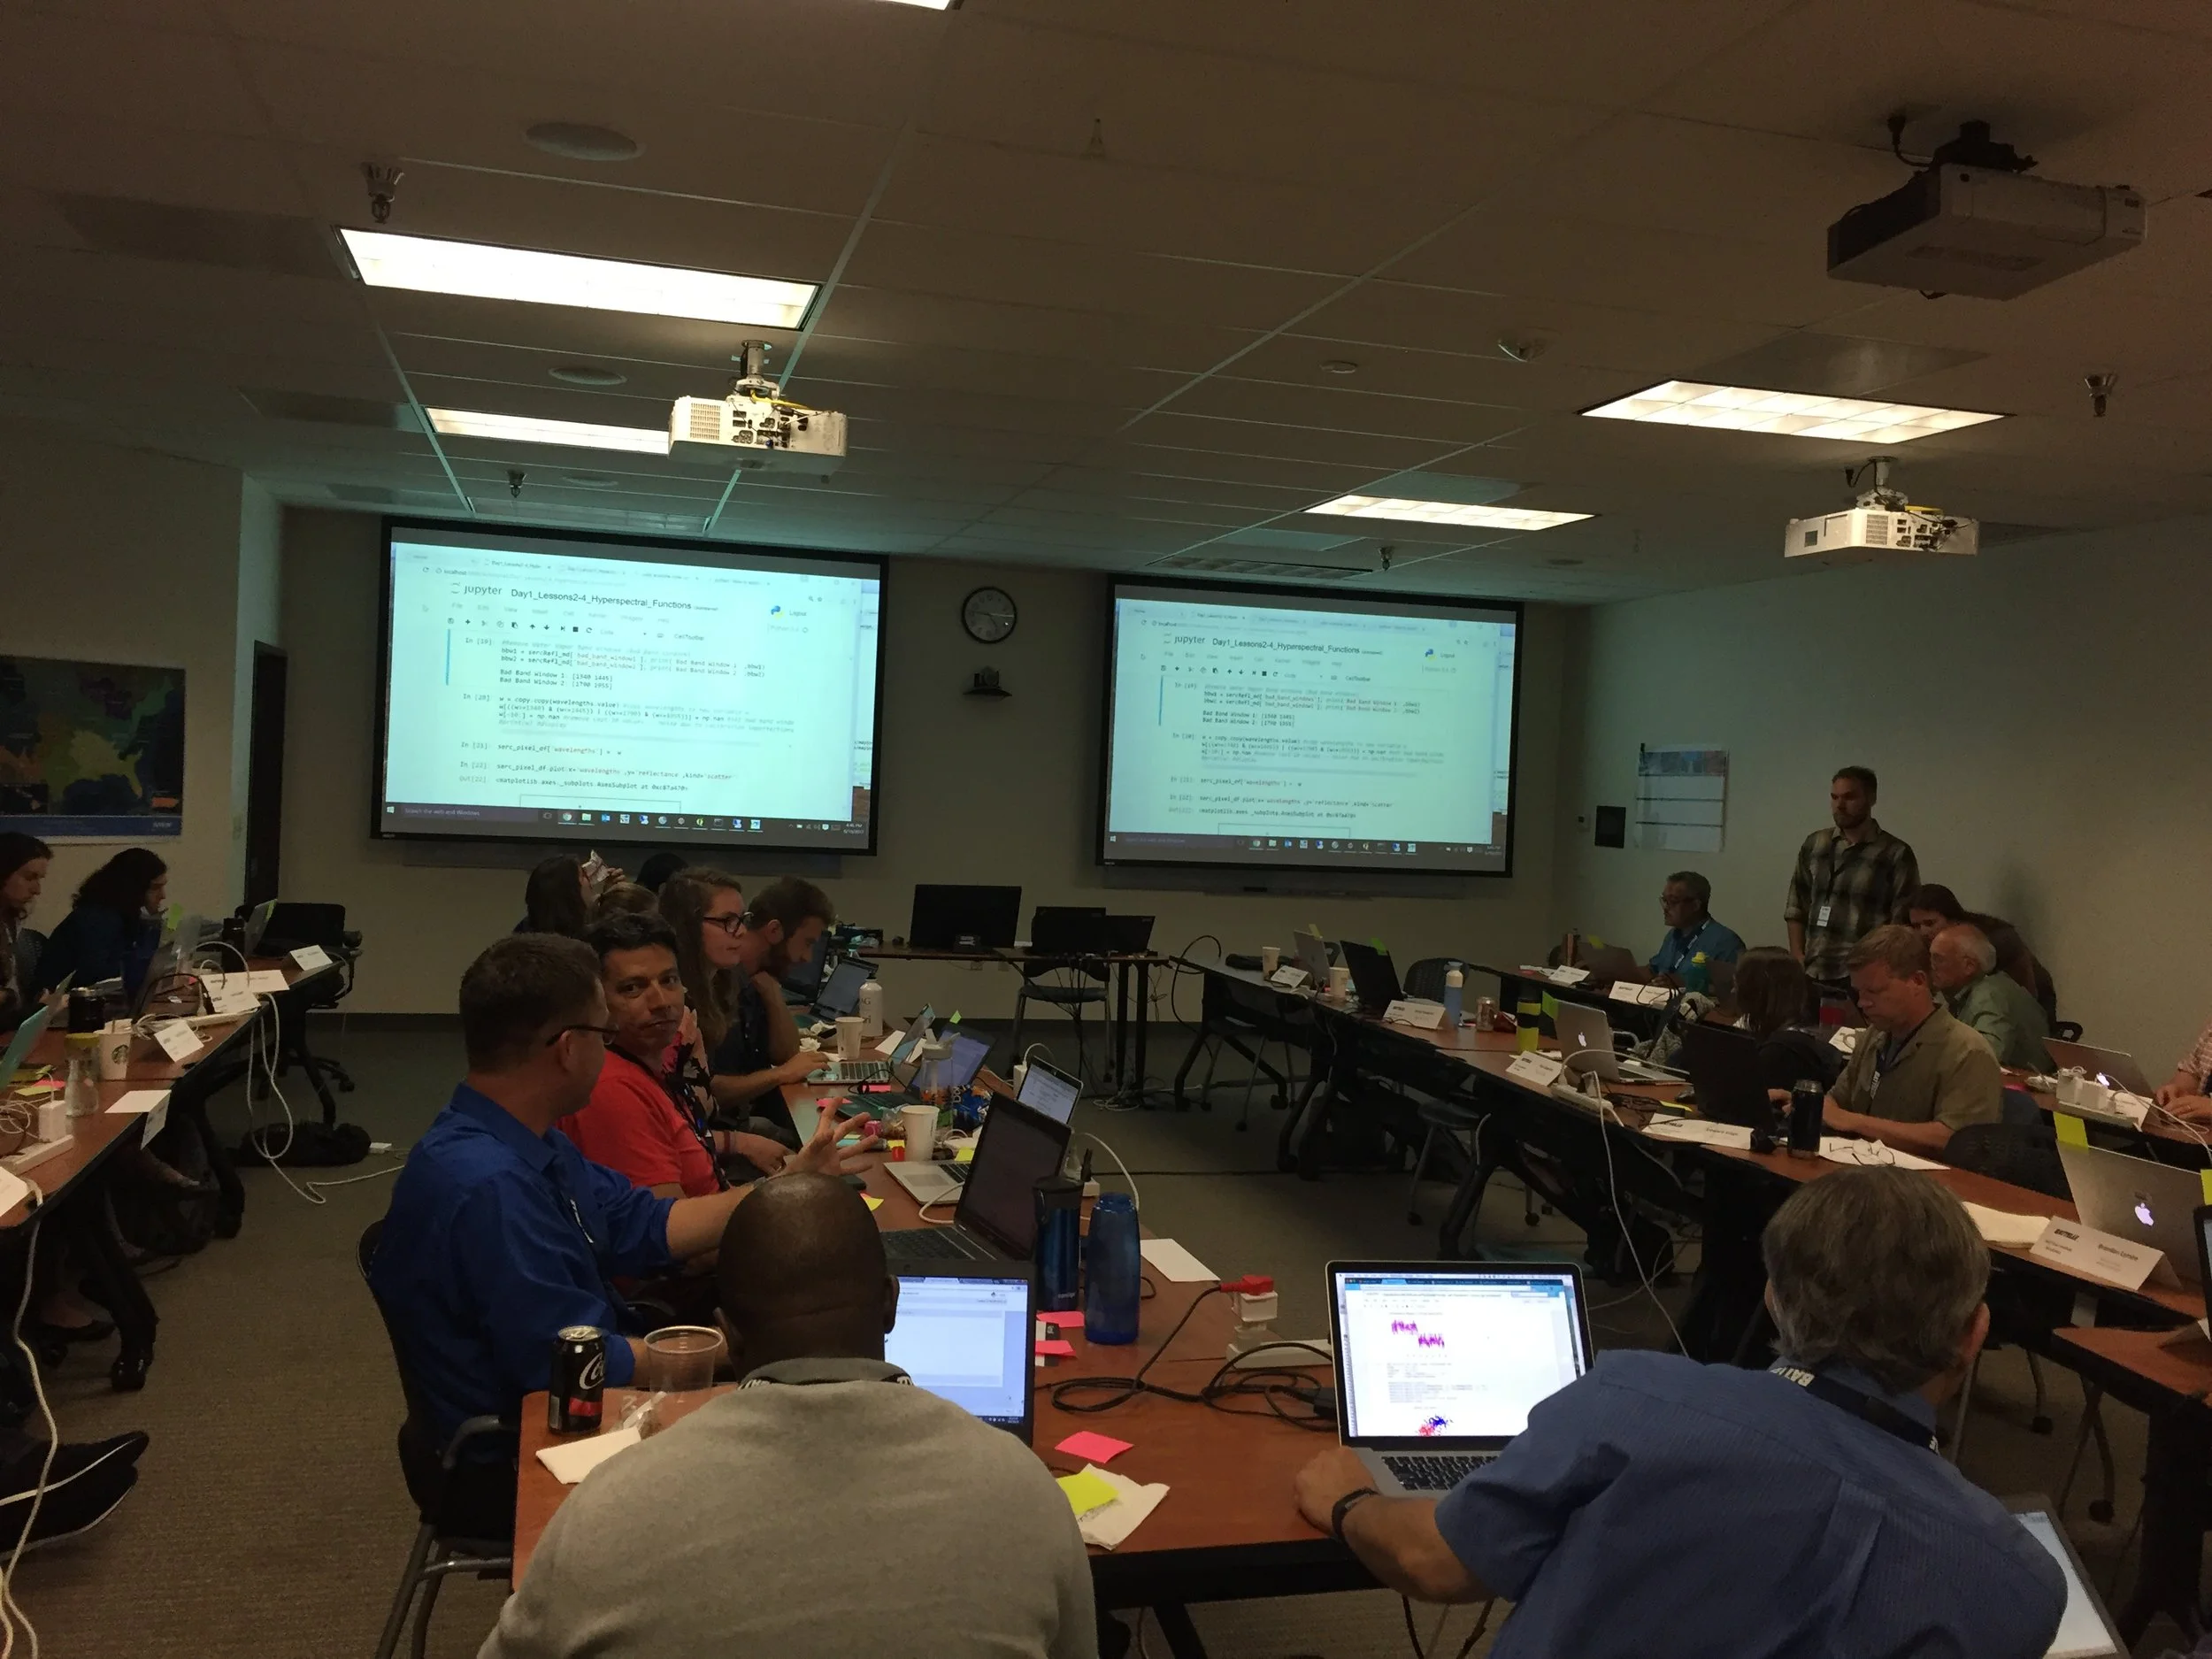
Notes about the workshop in general:

NEON data and resources:

Other misc. tools:

Day 1 Wrap Up
Day 2 Wrap Up 
Day 3 Wrap Up
Day 4 Wrap Up

Day 2 Wrap Up from the NEON Data Institute 2017

First of all, Pearl Street Mall is just as lovely as I remember, but OMG it is so crowded, with so many new stores and chains. Still, good food, good views, hot weather, lovely walk.

Welcome to Day 2! http://neondataskills.org/data-institute-17/day2/
Our morning session focused on reproducibility and workflows with the great Naupaka Zimmerman. Remember the characteristics of reproducibility - organization, automation, documentation, and dissemination. We focused on organization, and spent an enjoyable hour sorting through an example messy directory of misc data files and code. The directory looked a bit like many of my directories. Lesson learned. We then moved to working with new data and git to reinforce yesterday's lessons. Git was super confusing to me 2 weeks ago, but now I think I love it. We also went back and forth between Jupyter and python stand alone scripts, and abstracted variables, and lo and behold I got my script to run. All the git stuff is from http://swcarpentry.github.io/git-novice/

The afternoon focused on Lidar (yay!) and prior to coding we talked about discrete and waveform data and collection, and the opentopography (http://www.opentopography.org/) project with Benjamin Gross. The opentopography talk was really interesting. They are not just a data distributor any more, they also provide a HPC framework (mostly TauDEM for now) on their servers at SDSC (http://www.sdsc.edu/). They are going to roll out a user-initiated HPC functionality soon, so stay tuned for their new "pluggable assets" program. This is well worth checking into. We also spent some time live coding with Python with Bridget Hass working with a CHM from the SERC site in California, and had a nerve-wracking code challenge to wrap up the day.

Fun additional take-home messages/resources:

Thanks to everyone today! Megan Jones (our fearless leader), Naupaka Zimmerman (Reproducibility), Tristan Goulden (Discrete Lidar), Keith Krause (Waveform Lidar), Benjamin Gross (OpenTopography), Bridget Hass (coding lidar products).

Day 1 Wrap Up
Day 2 Wrap Up 
Day 3 Wrap Up
Day 4 Wrap Up

Our home for the week

Our home for the week

Day 1 Wrap Up from the NEON Data Institute 2017

I left Boulder 20 years ago on a wing and a prayer with a PhD in hand, overwhelmed with bittersweet emotions. I was sad to leave such a beautiful city, nervous about what was to come, but excited to start something new in North Carolina. My future was uncertain, and as I took off from DIA that final time I basically had Tom Petty's Free Fallin' and Learning to Fly on repeat on my walkman. Now I am back, and summer in Boulder is just as breathtaking as I remember it: clear blue skies, the stunning flatirons making a play at outshining the snow-dusted Rockies behind them, and crisp fragrant mountain breezes acting as my Madeleine. I'm back to visit the National Ecological Observatory Network (NEON) headquarters and attend their 2017 Data Institute, and re-invest in my skillset for open reproducible workflows in remote sensing. 

Day 1 Wrap Up from the NEON Data Institute 2017
What a day! http://neondataskills.org/data-institute-17/day1/
Attendees (about 30) included graduate students, old dogs (new tricks!) like me, and research scientists interested in developing reproducible workflows into their work. We are a pretty even mix of ages and genders. The morning session focused on learning about the NEON program (http://www.neonscience.org/): its purpose, sites, sensors, data, and protocols. NEON, funded by NSF and managed by Battelle, was conceived in 2004 and will go online for a 30-year mission providing free and open data on the drivers of and responses to ecological change starting in Jan 2018. NEON data comes from IS (instrumented systems), OS (observation systems), and RS (remote sensing). We focused on the Airborne Observation Platform (AOP) which uses 2, soon to be 3 aircraft, each with a payload of a hyperspectral sensor (from JPL, 426, 5nm bands (380-2510 nm), 1 mRad IFOV, 1 m res at 1000m AGL) and lidar (Optech and soon to be Riegl, discrete and waveform) sensors and a RGB camera (PhaseOne D8900). These sensors produce co-registered raw data, are processed at NEON headquarters into various levels of data products. Flights are planned to cover each NEON site once, timed to capture 90% or higher peak greenness, which is pretty complicated when distance and weather are taken into account. Pilots and techs are on the road and in the air from March through October collecting these data. Data is processed at headquarters.

In the afternoon session, we got through a fairly immersive dunk into Jupyter notebooks for exploring hyperspectral imagery in HDF5 format. We did exploration, band stacking, widgets, and vegetation indices. We closed with a fast discussion about TGF (The Git Flow): the way to store, share, control versions of your data and code to ensure reproducibility. We forked, cloned, committed, pushed, and pulled. Not much more to write about, but the whole day was awesome!

Fun additional take-home messages:

Thanks to everyone today, including: Megan Jones (Main leader), Nathan Leisso (AOP), Bill Gallery (RGB camera), Ted Haberman (HDF5 format), David Hulslander (AOP), Claire Lunch (Data), Cove Sturtevant (Towers), Tristan Goulden (Hyperspectral), Bridget Hass (HDF5), Paul Gader, Naupaka Zimmerman (GitHub flow).

Day 1 Wrap Up
Day 2 Wrap Up 
Day 3 Wrap Up
Day 4 Wrap Up

Spatial Data Science Bootcamp 2016!

Last week we held another bootcamp on Spatial Data Science. We had three packed days learning about the concepts, tools and workflow associated with spatial databases, analysis and visualizations. Our goal was not to teach a specific suite of tools but rather to teach participants how to develop and refine repeatable and testable workflows for spatial data using common standard programming practices.

2016 Bootcamp participants

On Day 1 we focused on setting up a collaborative virtual data environment through virtual machines, spatial databases (PostgreSQL/PostGIS) with multi-user editing and versioning (GeoGig). We also talked about open data and open standards, and moderndata formats and tools (GeoJSON, GDAL).  On Day 2 we focused on open analytical tools for spatial data. We focused on Python (i.e. PySAL, NumPy, PyCharm, iPython Notebook), and R tools.  Day 3 was dedicated to the web stack, and visualization via ESRI Online, CartoDB, and Leaflet. Web mapping is great, and as OpenGeo.org says: “Internet maps appear magical: portals into infinitely large, infinitely deep pools of data. But they aren't magical, they are built of a few standard pieces of technology, and the pieces can be re-arranged and sourced from different places.…Anyone can build an internet map."

All-in-all it was a great time spent with a collection of very interesting mapping professionals from around the country. Thanks to everyone!

ESRI @ GIF Open GeoDev Hacker Lab

We had a great day today exploring ESRI open tools in the GIF. ESRI is interested in incorporating more open tools into the GIS workflow. According to www.esri.com/software/open, this means working with:

  1. Open Standards: OGC, etc.

  2. Open Data formats: supporting open data standards, geojson, etc.

  3. Open Systems: open APIs, etc.

We had a full class of 30 participants, and two great ESRI instructors (leaders? evangelists?) John Garvois and Allan Laframboise, and we worked through a range of great online mapping (data, design, analysis, and 3D) examples in the morning, and focused on using ESRI Leaflet API in the afternoon. Here are some of the key resources out there.

Great Stuff! Thanks Allan and John

Spatial Data Science Bootcamp March 2016

Register now for the March 2016 Spatial Data Science Bootcamp at UC Berkeley!

We live in a world where the importance and availability of spatial data are ever increasing. Today’s marketplace needs trained spatial data analysts who can:

  • compile disparate data from multiple sources;
  • use easily available and open technology for robust data analysis, sharing, and publication;
  • apply core spatial analysis methods;
  • and utilize visualization tools to communicate with project managers, the public, and other stakeholders.

To help meet this demand, International and Executive Programs (IEP) and the Geospatial Innovation Facility (GIF) are hosting a 3-day intensive Bootcamp on Spatial Data Science on March 23-25, 2016 at UC Berkeley.

With this Spatial Data Science Bootcamp for professionals, you will learn how to integrate modern Spatial Data Science techniques into your workflow through hands-on exercises that leverage today's latest open source and cloud/web-based technologies. We look forward to seeing you here!

To apply and for more information, please visit the Spatial Data Science Bootcamp website.

Limited space available. Application due on February 19th, 2016.

MODIS and R: a dream partnership

Found by Natalie: 

Tuck, Sean L., Helen RP Phillips, Rogier E. Hintzen, Jörn PW Scharlemann, Andy Purvis, and Lawrence N. Hudson. "MODISTools–downloading and processing MODIS remotely sensed data in R." Ecology and evolution 4, no. 24 (2014): 4658-4668. And it is Open Access!

Abstract

Remotely sensed data available at medium to high resolution across global spatial and temporal scales are a valuable resource for ecologists. In particu- lar, products from NASA’s MODerate-resolution Imaging Spectroradiometer (MODIS), providing twice-daily global coverage, have been widely used for eco- logical applications. We present MODISTools, an R package designed to improve the accessing, downloading, and processing of remotely sensed MODIS data. MODISTools automates the process of data downloading and processing from any number of locations, time periods, and MODIS products. This auto- mation reduces the risk of human error, and the researcher effort required compared to manual per-location downloads. The package will be particularly useful for ecological studies that include multiple sites, such as meta-analyses, observation networks, and globally distributed experiments. We give examples of the simple, reproducible workflow that MODISTools provides and of the checks that are carried out in the process. The end product is in a format that is amenable to statistical modeling. We analyzed the relationship between spe- cies richness across multiple higher taxa observed at 526 sites in temperate for- ests and vegetation indices, measures of aboveground net primary productivity. We downloaded MODIS derived vegetation index time series for each location where the species richness had been sampled, and summarized the data into three measures: maximum time-series value, temporal mean, and temporal vari- ability. On average, species richness covaried positively with our vegetation index measures. Different higher taxa show different positive relationships with vegetation indices. Models had high R2 values, suggesting higher taxon identity and a gradient of vegetation index together explain most of the variation in species richness in our data. MODISTools can be used on Windows, Mac, and Linux platforms, and is available from CRAN and GitHub (https://github.com/ seantuck12/MODISTools). 

rOpenSci- new R package to search biodiversity data

Awesome new (ish?) R package from the gang over at rOpenSci 

Tired of searching biodiversity occurance data through individual platforms? The "spocc" package comes to your rescue and allows for a streamlined workflow in the collection and mapping of species occurrence data from range of sites including: GBIF, iNaturalist, Ecoengine, AntWeb, eBird, and USGS's BISON.

There is a caveat however, since the sites use alot of the same repositories the authors of the package caution to check for dulicates. Regardless what a great way to simplify your workflow!

Find the package from CRAN: install.packages("spocc") and read more about it here!

Turf: Advanced geospatial analysis for browsers and node

Mapbox introduced a new javascript library for spatial analysis called Turf.js. On the "Guides to getting started" page, it claims that Turf "helps you analyze, aggregate, and transform data in order to visualize it in new ways and answer advanced questions about it."

Turf provides you with functions like calculating buffers and areas. Other common functions include aggregation, measurement, transformation, data filtering, interpolation, joining features, and classification. The detailed explanations of these functions can be found on this page.

Turf seems like a cool tool to try out if you want to provide spatial analysis functions on your webGIS applications.

Workshop wrap up: Google Earth Higher Education Summit 2013

For three days in late July 2013 Kevin Koy, Executive Director of the GIF and Maggi spent time at Google with 50+ other academics and staff to learn about Google Earth's mapping and outreach tools that leverage cloud computing. The meeting was called Google Earth for Higher Education Summit, and it was jam packed with great information and hands-on workshops. Former Kellylabber Karin Tuxen-Bettman was at the helm, with other very helpful staff (including David Thau - who gave the keynote at last year's ASPRS conference). Google Earth Outreach has been targeting non-profits and K-12 education, and are now increasingly working with higher education, hence the summit. We learned about a number of valuable tools for use in classrooms and workshops, a short summary is here.  

Google Mapping Tools - the familiar and the new

  • Google Earth Pro. You all know about this tool, increasing ability to plan, measure and visualize a site, and to make movies and maps and export data.
  • Google Maps Engine Lite. This is a free, lite mapping platform to import, style and embed data. Designed to work with small (100 row) spreadsheets.
  • Google Maps Engine Platform. The scaleable and secure mapping platform for geographic data hosting, data sharing and map making. streamlines the import of GIS data: you can import shapefiles and imagery. http://mapsengine.google.com.
  • Google Earth Engine. Data (40 years of global satellite imagery - Landsat, MODIS, etc.) + methods to analyze (Google's and yours, using python and javascript) + the Cloud make for a fast analytical platform to study a changing earth. http://earthengine.google.org/#intro
  • TimeLapse. A new tool showcasing 29 years of Landsat imagery, allows you to script a tour through a part of the earth to highlight change. Features Landsat 4, 5 7 at 30m, with clouds removed, colors normalized with MODIS. http://earthengine.google.org/
  • Field Mobile Data Collection. GME goes mobile, using Open Data Kit (ODK) - a way to capture structured data and locate it and analyze after home.
  • Google Maps APIs. The way to have more hands-on in map styling and publishing. developers.google.com/maps
  • Street View. They have a car in 32 countries, on 7 continents, and are moving into national parks and protected areas. SV is not just for roads anymore. They use trikes, boats, snowmobiles, trolleys; they go underwater and caves, backpacks.

Here are a couple of my first-cuts:

ANR Statewide Program on GIS

Mission Statement: IGIS aims to support high-priority programs to advance research and extension projects that enhance agricultural productivity, natural resource conservation and healthy communities into the future by providing Informatics and Geospatial Information Systems tools and applications.

ANR Recently announced the development of a new Statewide Program called the Informatics and GIS (IGIS) program. The new program aims to over the next five years become the nexus for ANR’s rich and diverse geospatial and ecological data, research information, and resources for academics and the public who rely on geospatial and informatics data, analysis and display.  Through data capture, information sharing, and collaboration, we aim to increase our ability to make meaningful predictions of the agricultural, ecosystem, and community response to future change, to increase our understanding of California’s diverse natural, agricultural and human resources, and to support research and outreach projects that enhance agricultural productivity, natural resource conservation and healthy communities into the future.

The IGIS team needs your input to design this resource to be an efficient and helpful delivery of information and GIS support. If you are affiliated with ANR, please take a few minutes to complete the Survey of Informatics and GIS Needs, Knowledge and Data Availability.  This is a short and comprehensive survey that will assess GIS, data and information needs, evaluate your level of informatics and GIS expertise and use of geospatial tools and data.  Your response will be of great assistance toward building a successful State-wide program.

Mapping and interactive projections with D3

D3 is a javascript library that brings data to life through an unending array of vizualizations.  Whether you've realized it or not, D3 has been driving many of the most compeling data visualizations that you have likely seen throughout the last year including a popular series of election tracking tools in the New York Times.

You can find a series of examples in D3's gallery that will keep you busy for hours!

In addition to the fantastic charting tools, D3 also enables a growing list of mapping capabilities.  It is really exciting to see where all this is heading.  D3's developers have been spending a lot of time most recently working on projections transformations.  Check out these amazing interactive projection examples:

Projection Transitions

Comparing Map Projections

Adaptive Composite Map Projections (be sure to use chrome for the text to display correctly)

Can't wait to see what the future has in store for bringng custom map projections to life in more web map applications!