New York City Solar Map Released
/An interactive web-based map called The New York City Solar Map was recently released by the New York City Solar America City Partnership, led by Sustainable CUNY. The map allows users to search by neighborhood and address or interactively explore the map to zoom and click on a building or draw a polygon to calculate a number metrics related to building roof tops and potential solar power capacity including: potential energy savings, kilowatt output (in a time series), carbon emission reductions, payback, and a calculator for examining different solar installation options and savings with your utility provider. The map is intended to encourage solar panel installations and make information regarding solar panel capacity easier to access. Lidar data covering the entire city was collected last year and was used to compute the metrics used to determine solar panel capacity.
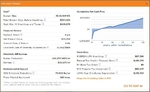 Solar Energy CalculatorThe data reveals that New York City has the potential to generate up to 5,847 megawatts of solar power. The installed solar capacity in the US today is only 2,300 megawatts. 66.4 percent of the city’s buildings have roof space suitable for solar panels. If panels were installed on those roof tops 49.7 percent of the current estimated daytime peak demand and about 14 percent of the city’s total annual electricity use could be met.
This map showcases the utility and power of webGIS and how it can be used to disseminate complex geographic information to anyone with a browser, putting the information needed to jump start solar panel installation in the hands of the city’s residents. The map was created by the Center for Advanced Research of Spatial Information (CARSI) at CUNY’s Hunter College and funded primarily by a United States Department of Energy grant.
Source: Click here for a NYTimes Article on the project for more information.
Click here to view the New York City Solar Map.
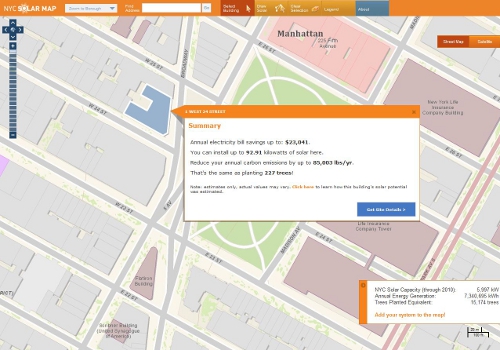 New York City Solar Map