NASA Data and the Distributed Active Archive Centers
/I’ve been away from the blog for awhile, but thought I’d catch up a bit. I am in beautiful Madison Wisconsin (Lake Mendota! 90 degrees! Rain! Fried cheese curds!) for the NASA LP DAAC User Working Group meeting. This is a cool deal where imagery and product users meet with NASA team leaders to review products and tools. Since this UWG process is new to me, I am highlighting some of the key fun things I learned.
What is a DAAC?
A DAAC is a Distributed Active Archive Center, run by NASA Earth Observing System Data and Information System (EOSDIS). These are discipline-specific facilities located throughout the United States. These institutions are custodians of EOS mission data and ensure that data will be easily accessible to users. Each of the 12 EOSDIS DAACs process, archive, document, and distribute data from NASA's past and current Earth-observing satellites and field measurement programs. For example, if you want to know about snow and ice data, visit the National Snow and Ice Data Center (NSIDC) DAAC. Want to know about social and population data? Visit the Socioeconomic Data and Applications Data Center (SEDAC). These centers of excellence are our taxpayer money at work collecting, storing, and sharing earth systems data that are critical to science, sustainability, economy, and well-being.
What is the LP DAAC?
The Land Processes Distributed Active Archive Center (LP DAAC) is one of several discipline-specific data centers within the NASA Earth Observing System Data and Information System (EOSDIS). The LP DAAC is located at the USGS Earth Resources Observation and Science (EROS) Center in Sioux Falls, South Dakota. LP DAAC promotes interdisciplinary study and understanding of terrestrial phenomena by providing data for mapping, modeling, and monitoring land-surface patterns and processes. To meet this mission, the LP DAAC ingests, processes, distributes, documents, and archives data from land-related sensors and provides the science support, user assistance, and outreach required to foster the understanding and use of these data within the land remote sensing community.
Why am I here?
Each NASA DAAC has established a User Working Group (UWG). There are 18 people on the LP DAAC committee, 12 members from the land remote sensing community at large, like me! Some cool stuff going on. Such as...
New Sensors
Two upcoming launches are super interesting and important to what we are working on. First, GEDI (Global Ecosystem Dynamics Investigation) will produce the first high resolution laser ranging observations of the 3D structure of the Earth. Second, ECOSTRESS (The ECOsystem Spaceborne Thermal Radiometer Experiment on Space Station), will measure the temperature of plants: stressed plants get warmer than plants with sufficient water. ECOSTRESS will use a multispectral thermal infrared radiometer to measure surface temperature. The radiometer will acquire the most detailed temperature images of the surface ever acquired from space and will be able to measure the temperature of an individual farmer's field. Both of these sensors will be deployed on the International Space Station, so data will be in swaths, not continuous global coverage. Also, we got an update from USGS on the USGS/NASA plan for the development and deployment of Landsat 10. Landsat 9 comes 2020, Landsat 10 comes ~2027.
Other Data Projects
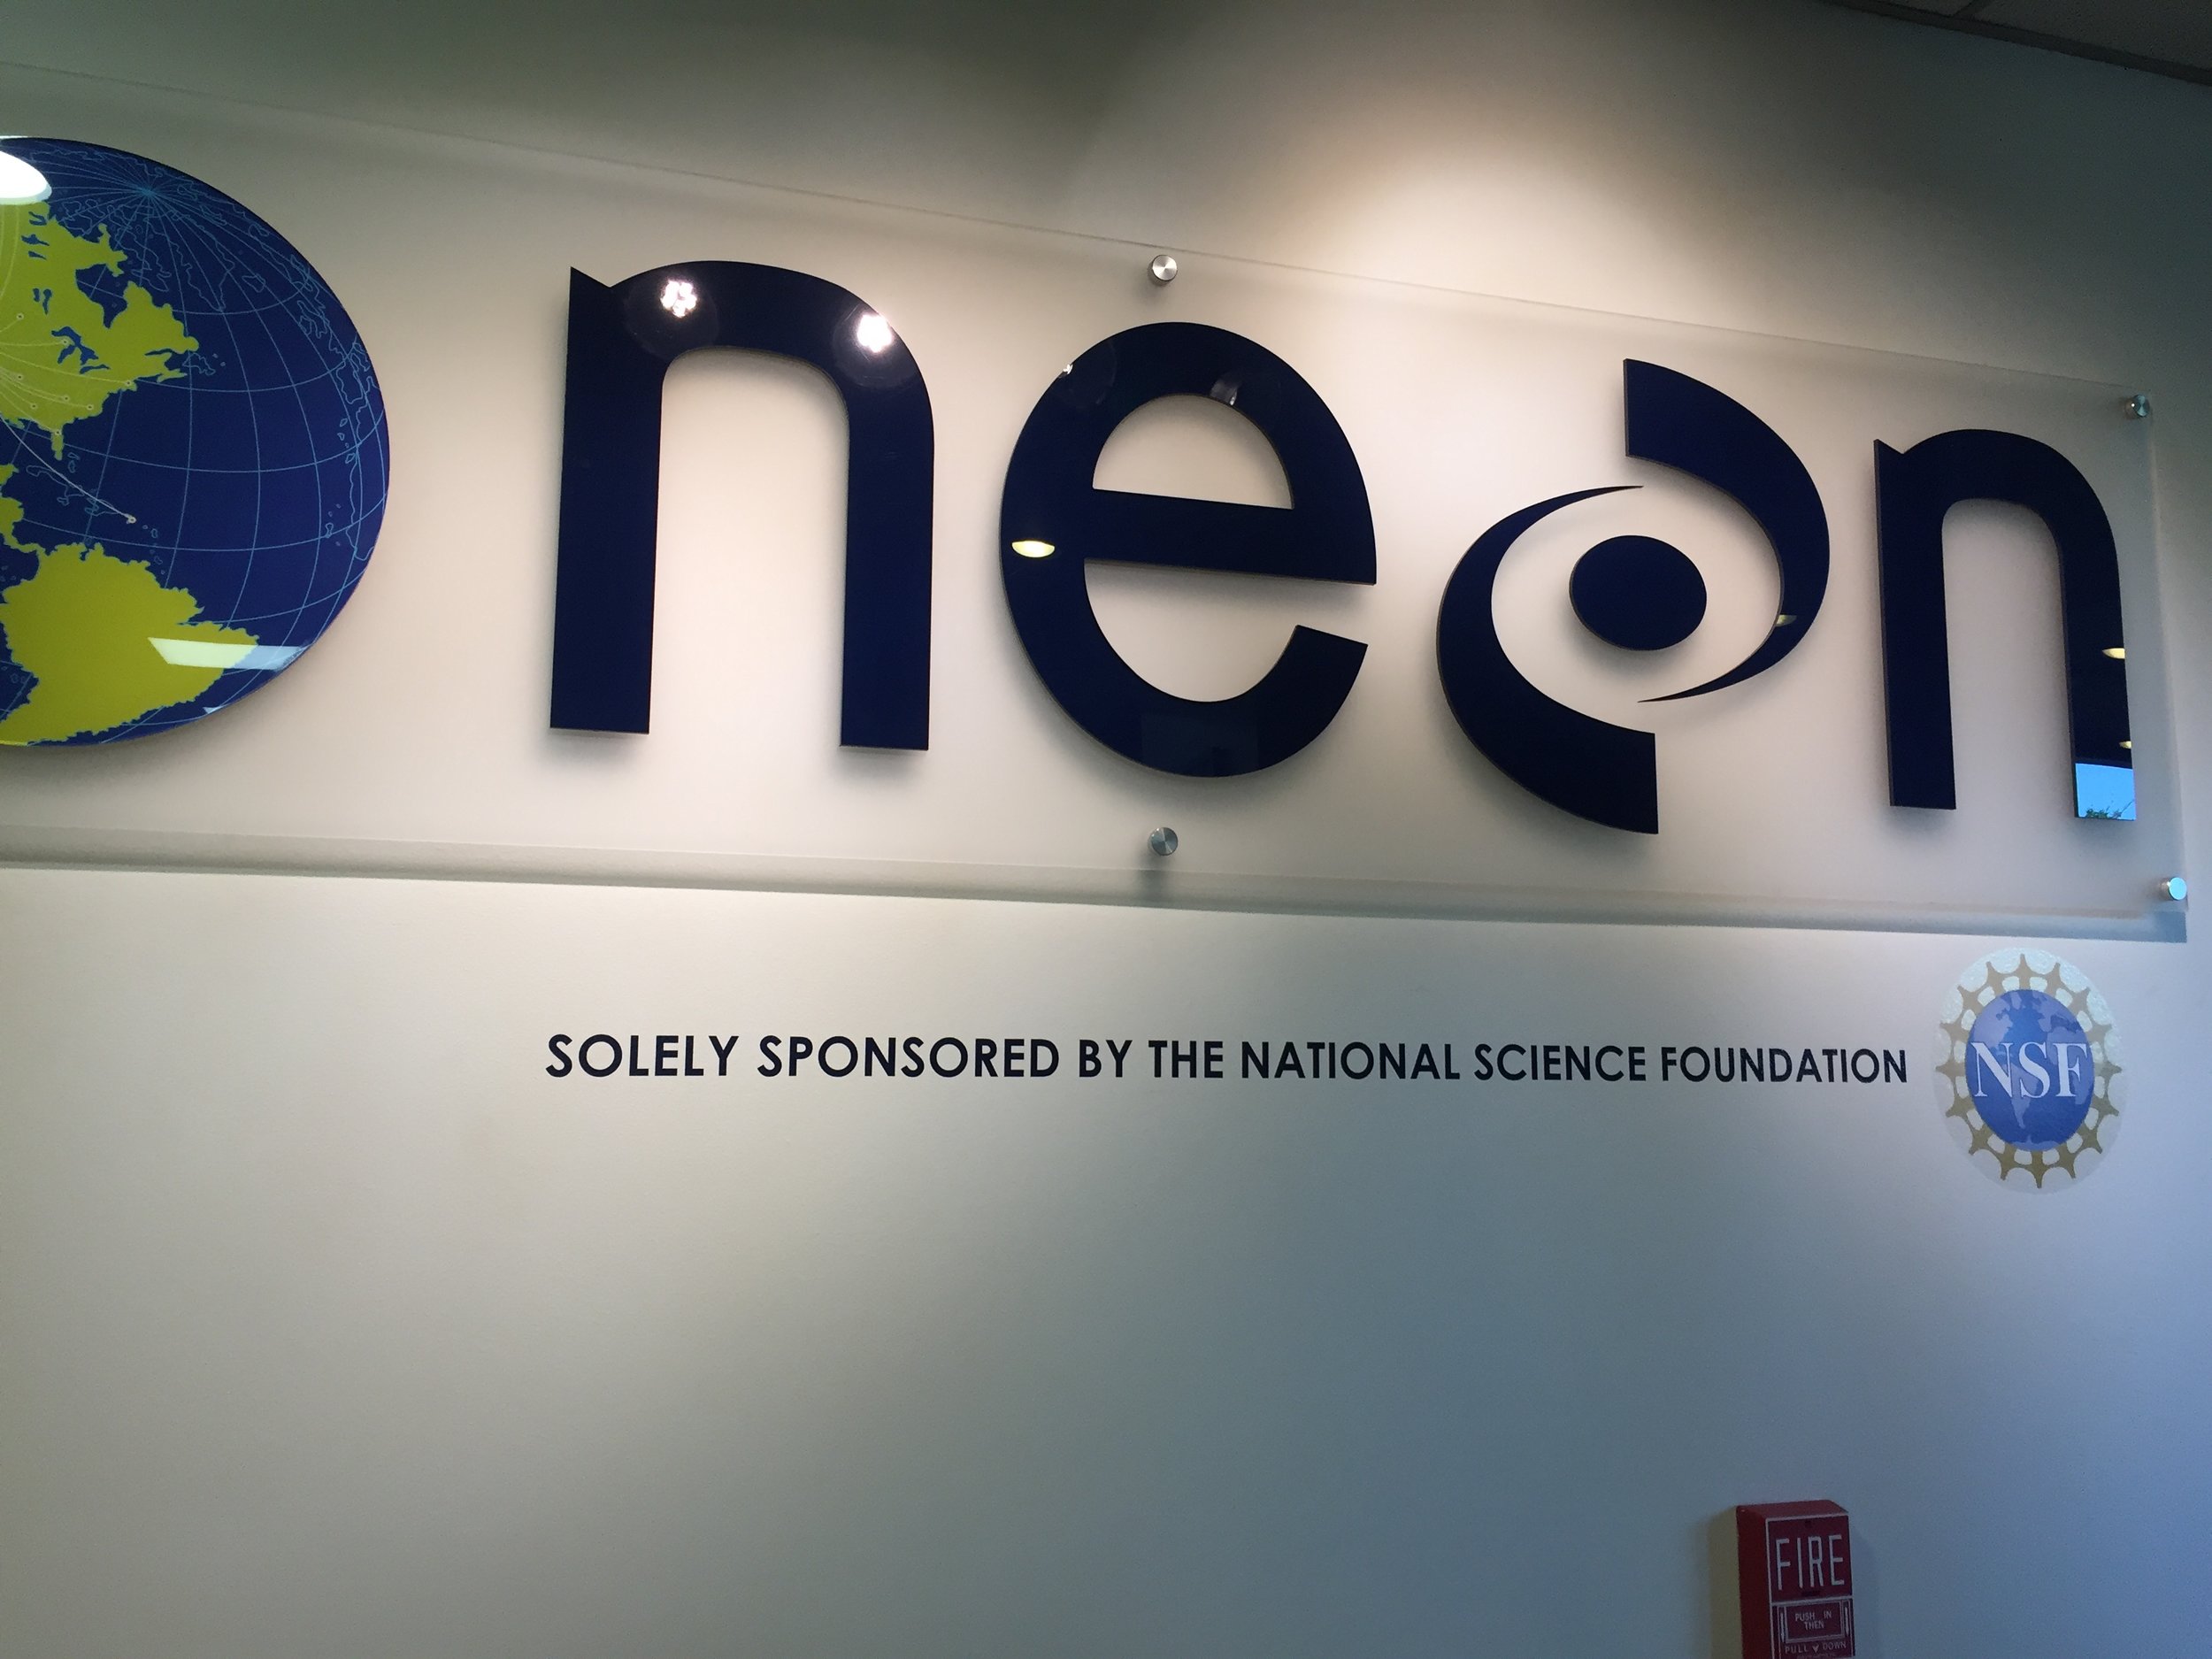
We heard from other data providers, and of course we heard from NEON! Remember I posted a series of blogs about the excellent NEON open remote sensing workshop I attended last year. NEON also hosts a ton of important ecological data, and has been thinking through the issues associated with cloud hosting. Tristin Goulden was here to give an overview.
Tools Cafe
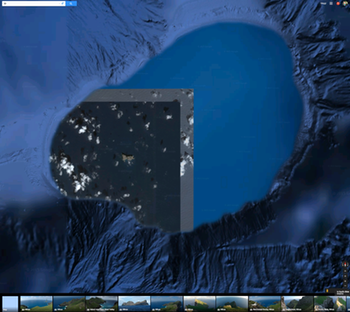
NASA staff gave us a series of demos on their WebGIS services; AppEEARS; and their data website. Their webGIS site uses ArcGIS Enterprise, and serves web image services, web coverage services and web mapping services from the LP DAAC collection. This might provide some key help for us in IGIS and our REC ArcGIS online toolkits. AppEEARS us their way of providing bundles of LP DAAC data to scientists. It is a data extraction and exploration tool. Their LP DAAC data website redesign (website coming soon), which was necessitated in part by the requirement for a permanent DOI for each data product.
User Engagement
LP DAAC is going full-force in user engagement: they do workshops, collect user testimonials, write great short pieces on “data in action”, work with the press, and generally get the story out about how NASA LP DAAC data is used to do good work. This is a pretty great legacy and they are committed to keep developing it. Lindsey Harriman highlighted their excellent work here.
Grand Challenges for remote sensing
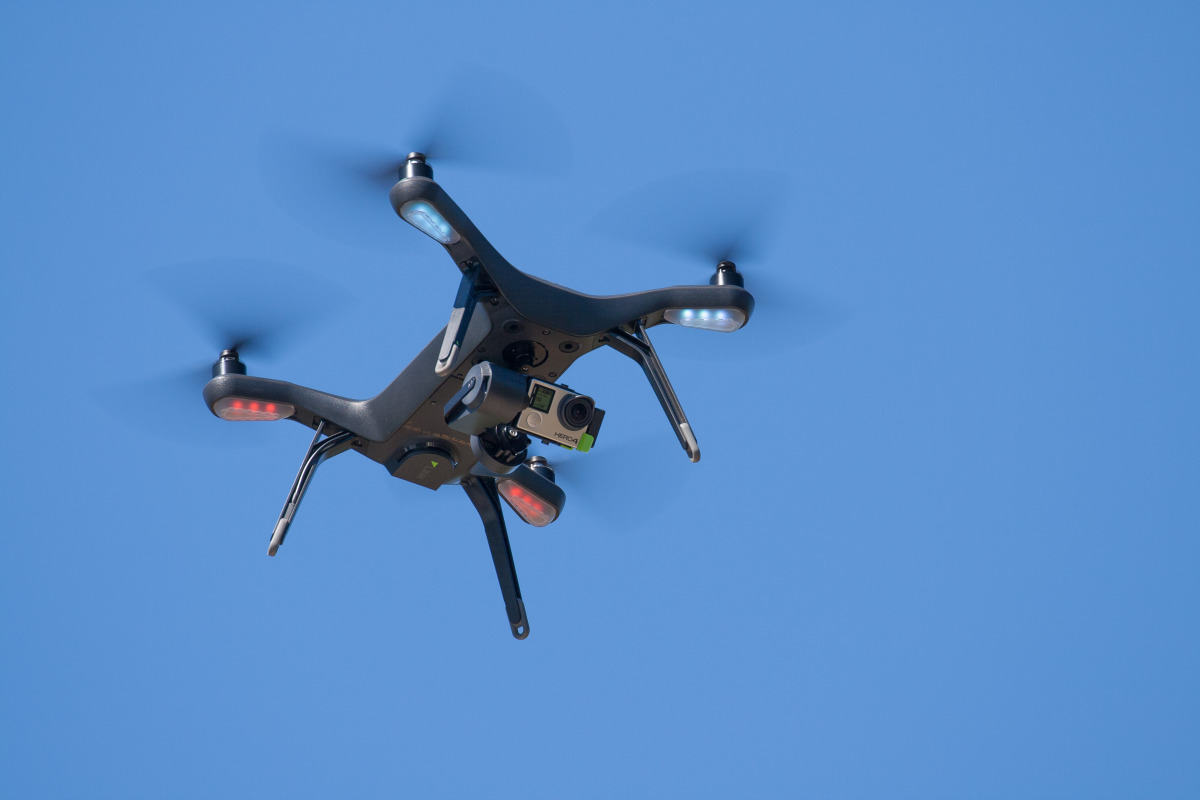
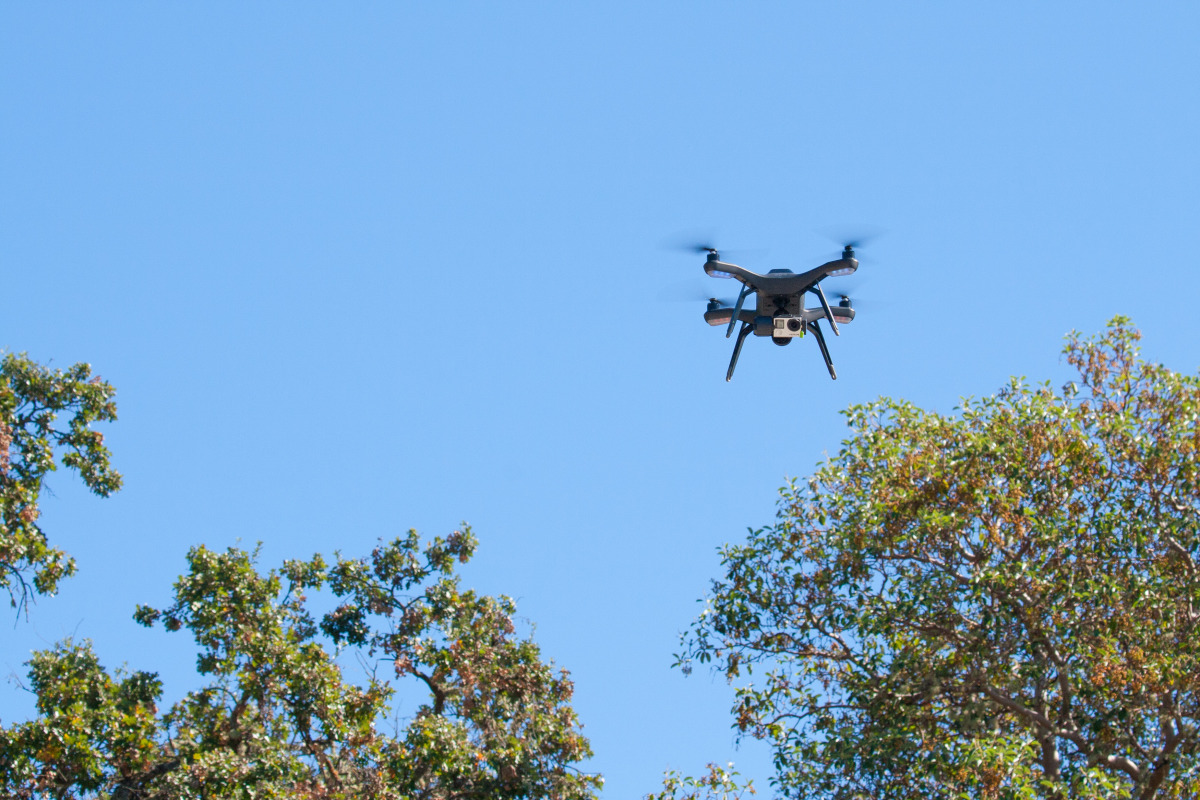
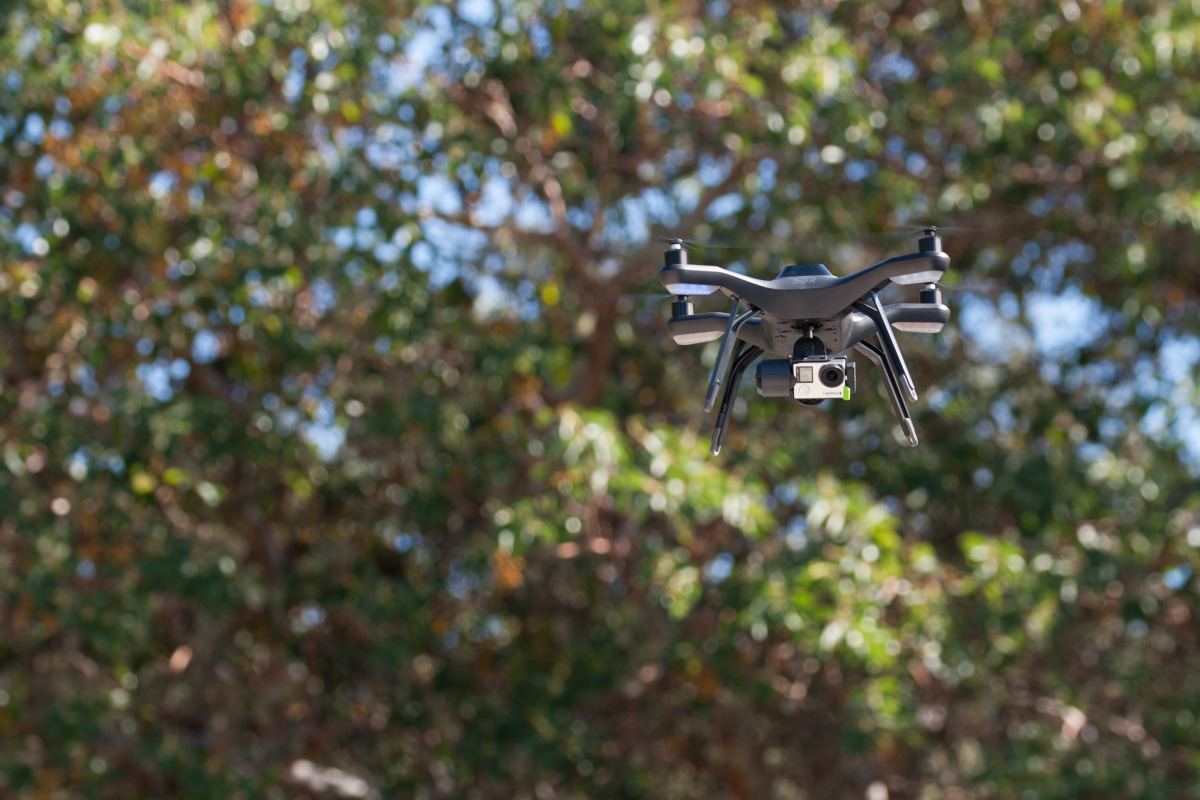
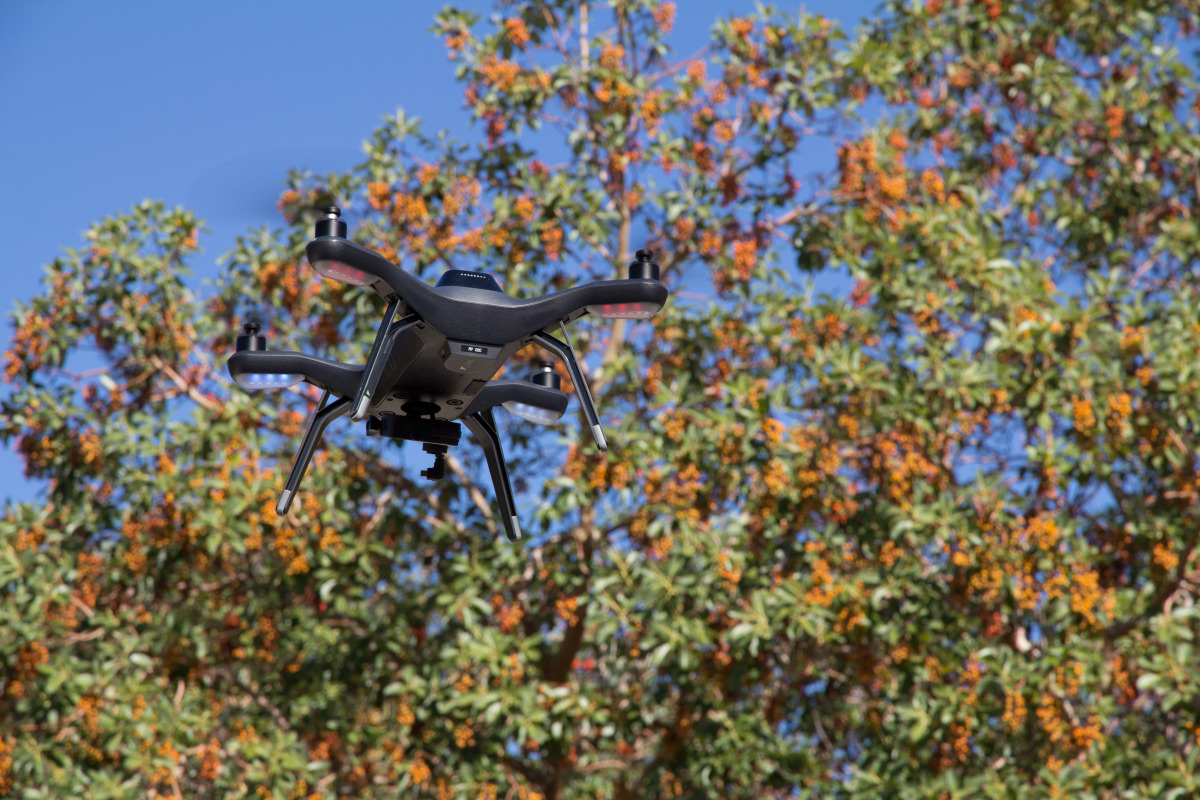
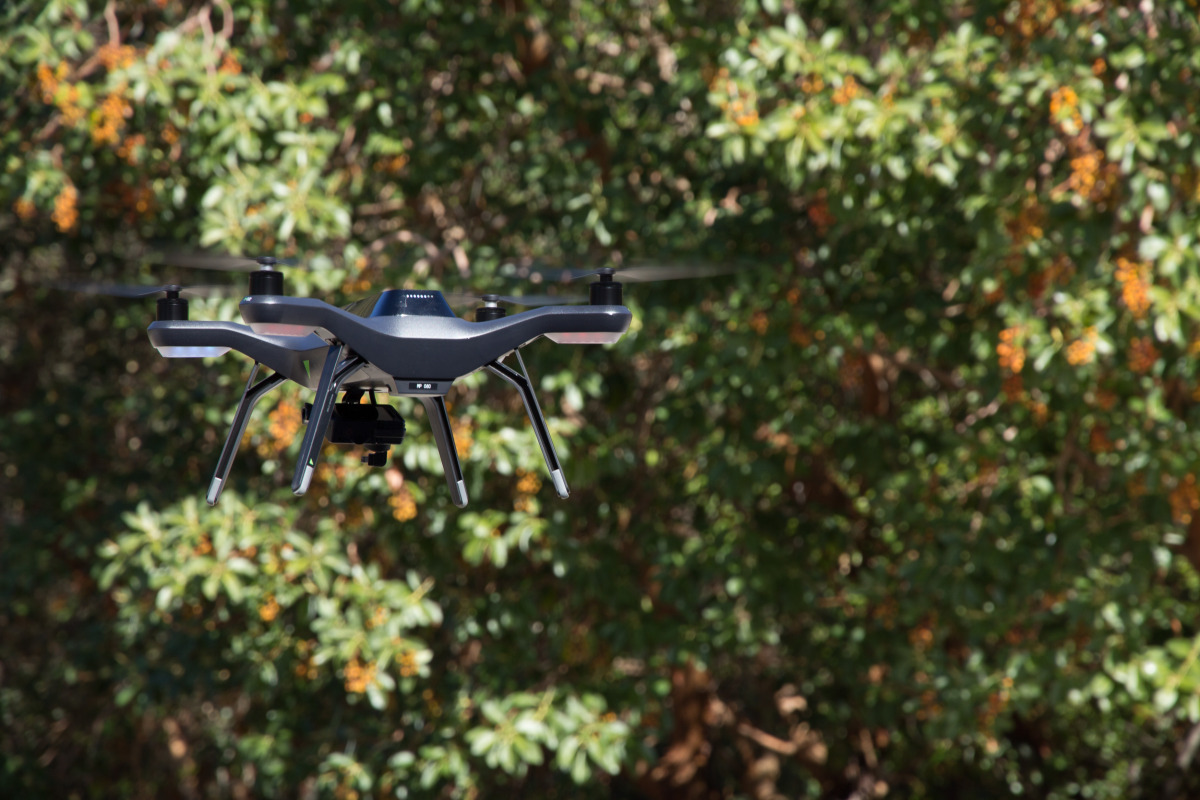
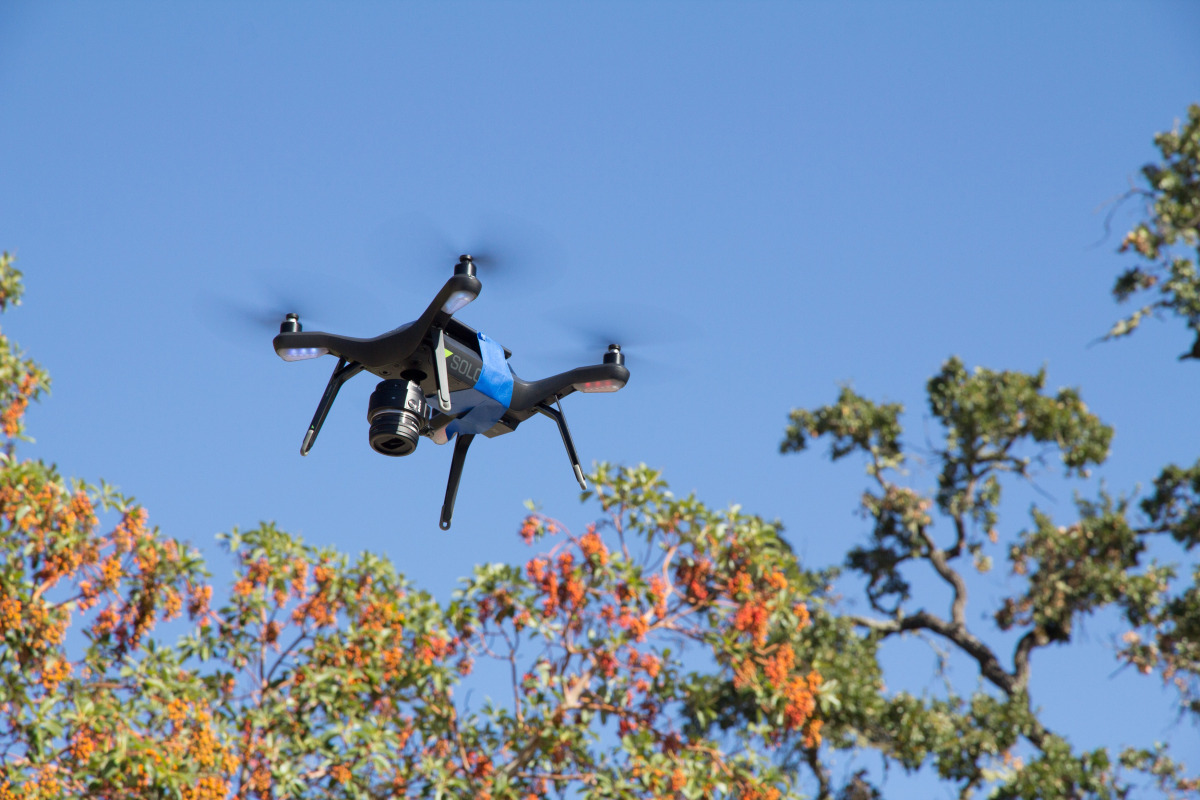
Some thoughts about our Grand Challenges: 1) Scaling: From drones to satellites. It occurs to me that an integration between the ground-to-airborne data that NEON provides and the satellite data that NASA provides had better happen soon; 2) Data Fusion/Data Assimilation/Data Synthesis, whatever you want to call it. Discovery through datasets meeting for the first time; 3) Training: new users and consumers of geospatial data and remote sensing will need to be trained; 4) Remote Sensible: Making remote sensing data work for society.
A primer on cloud computing
We spent some time on cloud computing. It has been said that cloud computing is just putting your stuff on “someone else’s computer”, but it is also making your stuff “someone else’s problem”, because cloud handles all the painful aspects of serving data: power requirements, buying servers, speccing floor space for your servers, etc. Plus, there are many advantages of cloud computing. Including: Elasticity. Elastic in computing and storage: you can scale up, or scale down or scale sideways. Elastic in terms of money: You pay for only what you use. Speed. Commercial clouds CPUs are faster than ours, and you can use as many as you want. Near real time processing, massive processing, compute intensive analysis, deep learning. Size. You can customize this; you can be fast and expensive or slow and cheap. You use as much as you need. Short-term storage of large interim results or long-term storage of data that you might use one day.
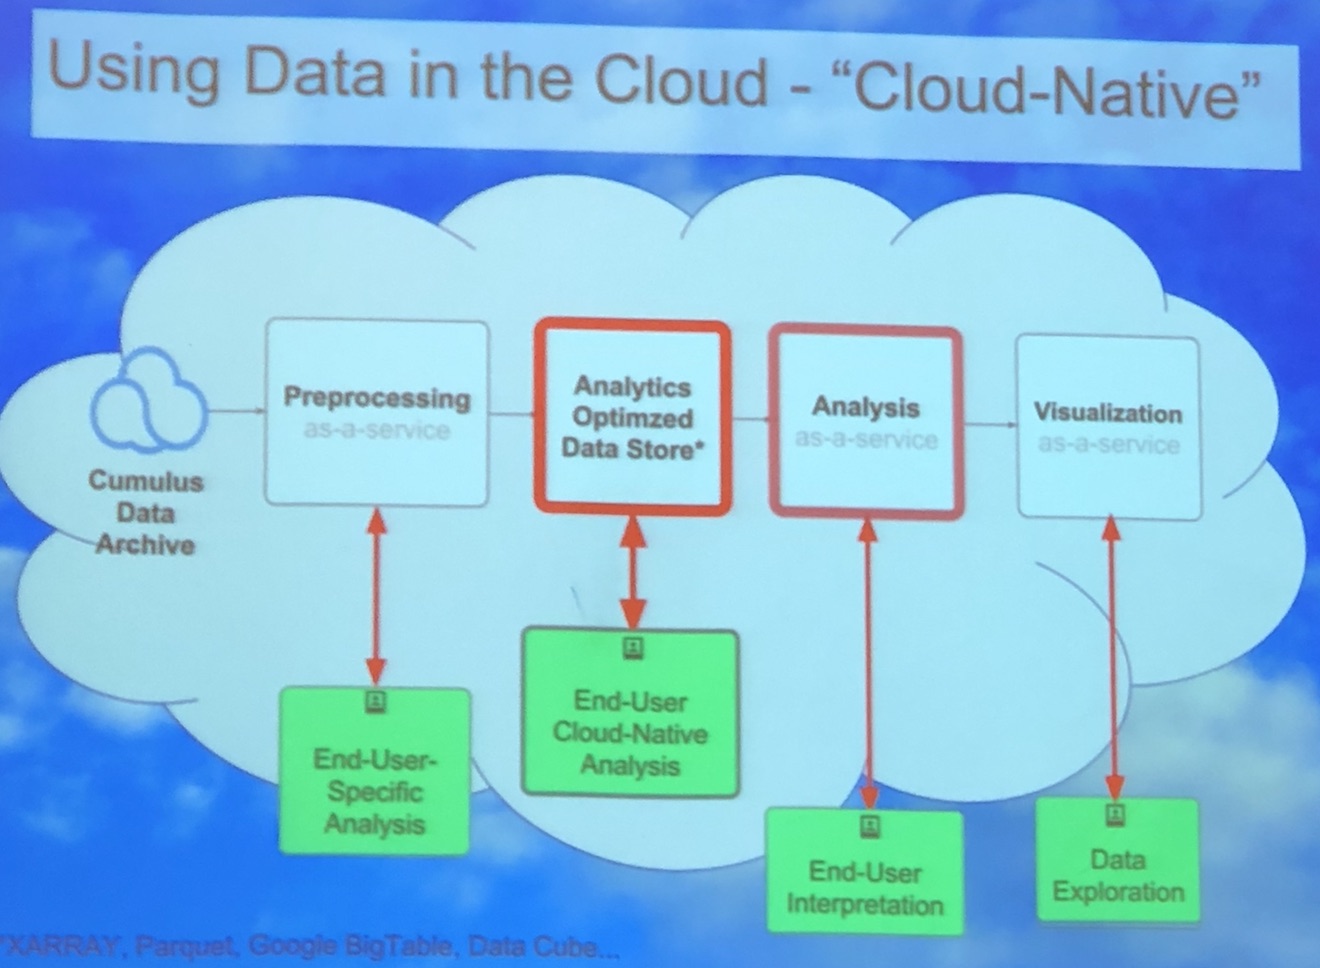
Image courtesy of Chris Lynnes
We can use the cloud as infrastructure, for sharing data and results, and as software (e.g. ArcGIS Online, Google Earth Engine). Above is a cool graphic showing one vision of the cloud as a scaled and optimized workflow that takes advantage of the cloud: from pre-processing, to analytics-optimized data store, to analysis, to visualization. Why this is a better vision: some massive processing engines, such as SPARC or others, require that data be organized in a particular way (e.g. Google Big Table, Parquet, or DataCube). This means we can really crank on processing, especially with giant raster stacks. And at each step in the workflow, end-users (be they machines or people) can interact with the data. Those are the green boxes in the figure above. Super fun discussion, leading to importance of training, and how to do this best. Tristan also mentioned Cyverse, a new NSF project, which they are testing out for their workshops.

Image attribution: Corey Coyle
Super fun couple of days. Plus: Wisconsin is green. And warm. And Lake Mendota is lovely. We were hosted at the University of Wisconsin by Mutlu Ozdogan. The campus is gorgeous! On the banks of Lake Mendota (image attribution: Corey Coyle), the 933-acre (378 ha) main campus is verdant and hilly, with tons of gorgeous 19th-century stone buildings, as well as modern ones. UW was founded when Wisconsin achieved statehood in 1848, UW–Madison is the flagship campus of the UW System. It was the first public university established in Wisconsin and remains the oldest and largest public university in the state. It became a land-grant institution in 1866. UW hosts nearly 45K undergrad and graduate students. It is big! It has a med school, a business school, and a law school on campus. We were hosted in the UW red-brick Romanesque-style Science Building (opened in 1887). Not only is it the host building for the geography department, it also has the distinction of being the first building in the country to be constructed of all masonry and metal materials (wood was used only in window and door frames and for some floors), and may be the only one still extant. How about that! Bye Wisconsin!


