Day 2 Wrap Up from the NEON Data Institute 2017

First of all, Pearl Street Mall is just as lovely as I remember, but OMG it is so crowded, with so many new stores and chains. Still, good food, good views, hot weather, lovely walk.

Welcome to Day 2! http://neondataskills.org/data-institute-17/day2/
Our morning session focused on reproducibility and workflows with the great Naupaka Zimmerman. Remember the characteristics of reproducibility - organization, automation, documentation, and dissemination. We focused on organization, and spent an enjoyable hour sorting through an example messy directory of misc data files and code. The directory looked a bit like many of my directories. Lesson learned. We then moved to working with new data and git to reinforce yesterday's lessons. Git was super confusing to me 2 weeks ago, but now I think I love it. We also went back and forth between Jupyter and python stand alone scripts, and abstracted variables, and lo and behold I got my script to run. All the git stuff is from http://swcarpentry.github.io/git-novice/

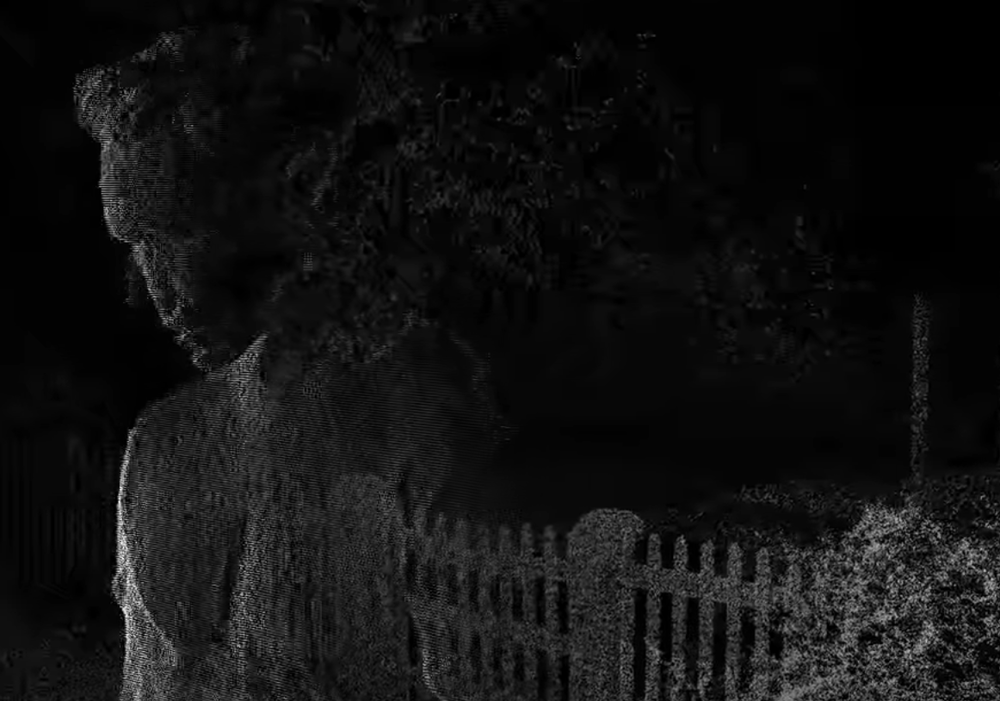
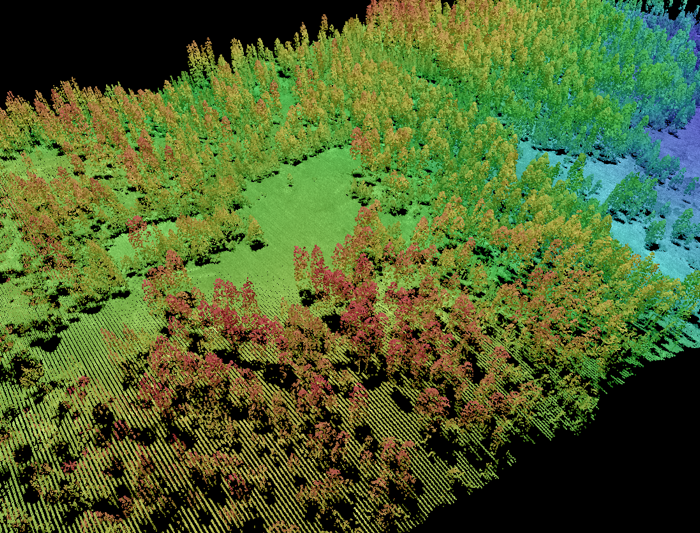
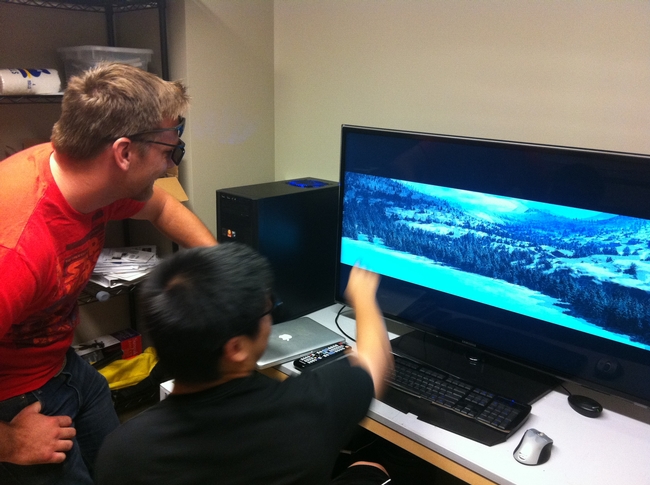
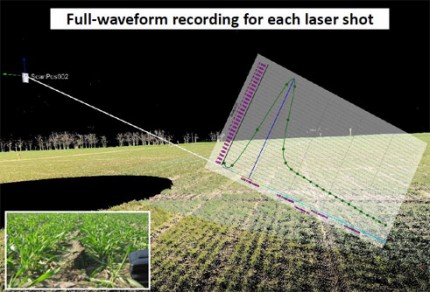
The afternoon focused on Lidar (yay!) and prior to coding we talked about discrete and waveform data and collection, and the opentopography (http://www.opentopography.org/) project with Benjamin Gross. The opentopography talk was really interesting. They are not just a data distributor any more, they also provide a HPC framework (mostly TauDEM for now) on their servers at SDSC (http://www.sdsc.edu/). They are going to roll out a user-initiated HPC functionality soon, so stay tuned for their new "pluggable assets" program. This is well worth checking into. We also spent some time live coding with Python with Bridget Hass working with a CHM from the SERC site in California, and had a nerve-wracking code challenge to wrap up the day.

Fun additional take-home messages/resources:

Thanks to everyone today! Megan Jones (our fearless leader), Naupaka Zimmerman (Reproducibility), Tristan Goulden (Discrete Lidar), Keith Krause (Waveform Lidar), Benjamin Gross (OpenTopography), Bridget Hass (coding lidar products).

Day 1 Wrap Up
Day 2 Wrap Up 
Day 3 Wrap Up
Day 4 Wrap Up

Our home for the week

Our home for the week

GIF Bootcamp 2017 wrap up!

Our third GIF Spatial Data Science Bootcamp has wrapped!  We had an excellent 3 days with wonderful people from a range of locations and professions and learned about open tools for managing, analyzing and visualizing spatial data. This year's bootcamp was sponsored by IGIS and GreenValley Intl (a Lidar and drone company). GreenValley showcased their new lidar backpack, and we took an excellent shot of the bootcamp participants. What is Paparazzi in lidar-speak? Lidarazzi? 

Here is our spin: We live in a world where the importance and availability of spatial data are ever increasing. Today’s marketplace needs trained spatial data analysts who can:

  • compile disparate data from multiple sources;
  • use easily available and open technology for robust data analysis, sharing, and publication;
  • apply core spatial analysis methods;
  • and utilize visualization tools to communicate with project managers, the public, and other stakeholders.

At the Spatial Data Science Bootcamp we learn how to integrate modern Spatial Data Science techniques into your workflow through hands-on exercises that leverage today's latest open source and cloud/web-based technologies. 

Our summary from SNAMP: 31 integrated recommendations

The following forest management recommendations consider the SNAMP focal resources (forest, water, wildlife), as well as public participation, as an integrated group. These recommendations were developed by the UC Science Team working together. Although each recommendation was written by one or two authors, the entire team has provided input and critique for the recommendations. The entire UC Science Team endorses all of these integrated management recommendations. Click at the bottom of the post for the full description of each recommendation. 

Section 1: Integrated management recommendations based directly on SNAMP science

Wildfire hazard reduction

1. If your goal is to reduce severity of wildfire effects, SPLATs are an effective means to reduce the severity of wildfires. 

SPLAT impacts on forest ecosystem health 

2. If your goal is to improve forest ecosystem health, SPLATs have a positive effect on tree growth efficiency.

SPLAT impact assessment

3. If your goal is to integrate across firesheds, an accurate vegetation map is essential, and a fusion of optical, lidar and ground data is necessary. 

4. If your goal is to understand the effects of SPLATs, lidar is essential to accurately monitor the intensity and location of SPLAT treatments.

SPLAT impacts on California spotted owl and Pacific fisher

5. If your goal is to maintain existing owl and fisher territories, SPLATs should continue to be placed outside of owl Protected Activity Centers (PACs) and away from fisher den sites, in locations that reduce the risk of high-severity fire occurring within or spreading to those areas.

6. If your goal is to maintain landscape connectivity between spotted owl territories, SPLATs should be implemented in forests with lower canopy cover whenever possible.

7. If your goal is to increase owl nest and fisher den sites, retain oaks and large conifers within SPLAT treatments.

8. If your goal is to maintain fisher habitat quality, retention of canopy cover is a critical consideration.

9. If your goal is to increase fisher foraging activity, limit mastication and implement more post-mastication piling and/or burning to promote a faster recovery of the forest floor condition. 

10. If your goal is to understand SPLAT effects on owl and fisher, it is necessary to consider a larger spatial scale than firesheds.

SPLAT impacts on water quantity and quality

11. If your goal is to detect increases in water yield from forest management, fuel treatments may need to be more intensive than the SPLATs that were implemented in SNAMP.

12. If your goal is to maintain water quality, SPLATs as implemented in SNAMP have no detectable effect on turbidity.

Stakeholder participation in SPLAT implementation and assessment

13. If your goal is to increase acceptance of fuel treatments, employ outreach techniques that include transparency, shared learning, and inclusiveness that lead to relationship building and the ability to work together.

14. If your goal is the increased acceptance of fuel treatments, the public needs to understand the tradeoffs between the impacts of treatments and wildfire.

Successful collaborative adaptive management processes

15. If your goal is to establish a third party adaptive management project with an outside science provider, the project also needs to include an outreach component.

16. If your goal is to develop an engaged and informed public, you need to have a diverse portfolio of outreach methods that includes face to face meetings, surveys, field trips, and web-based information.

17. If your goal is to understand or improve outreach effectiveness, track production, flow, and use of information.

18. If your goal is to engage in collaborative adaptive management at a meaningful management scale, secure reliable long term sources of funding.

19. If your goal is to maintain a successful long-term collaborative adaptive management process, establish long-term relationships with key people in relevant stakeholder groups and funding agencies.

Section 2: Looking forward - Integrated management recommendations based on expert opinion of the UC Science Team

Implementation of SPLATs

20. If your goal is to maximize the value of SPLATs, complete treatment implementation, especially the reduction of surface fuels.

21. If your goal is to efficiently reduce fire behavior and effects, SPLATs need to be strategically placed on the landscape.

22. If your goal is to improve SPLAT effectiveness, increase heterogeneity within treatment type and across the SPLAT network.

Forest ecosystem restoration

23. If your goal is to restore Sierra Nevada forest ecosystems and improve forest resilience to fire, SPLATs can be used as initial entry, but fire needs to be reintroduced into the system or allowed to occur as a natural process (e.g., managed fire).

24. If your goal is to manage the forest for long-term sustainability, you need to consider the pervasive impacts of climate change on wildfire, forest ecosystem health, and water yield.

Management impacts on California spotted owl and Pacific fisher 

25. If your goal is to enhance landscape habitat condition for owl and fisher, hazard tree removal of large trees should be carefully justified before removing.

26. If your goal is to minimize the effects of SPLATs on fisher, SPLAT treatments should be dispersed through space and time.

Management impacts on water quantity and quality

27. If your goal is to optimize water management, consider the range of potential fluctuations in precipitation and temperature.

Successful collaborative adaptive management processes

28. If your goal is to implement collaborative adaptive management, commit enough time, energy, and training of key staff to complete the adaptive management cycle.

29. The role of a third party science provider for an adaptive management program can be realized in a variety of ways.

30. If the goal is to implement adaptive management, managers must adopt clear definitions and guidelines for how new information will be generated, shared, and used to revise subsequent management as needed.

31. If your goal is to increase forest health in the Sierra Nevada, we now know enough to operationalize some of the aspects of SNAMP more broadly.

Read More

SNAMP spatial recommendations: Lidar + accurate veg maps needed for forest management

The SNAMP UC Science Team worked together to develop 31 integrated management recommendations at the conclusion of our SNAMP project. The following deal specifically with lidar and vegetation mapping. All 31 can be found here. All our SNAMP spatial publications can be found here

Mapping forests for management

Lidar point cloud forest stand: Marek Jakubowski

If your goal is to integrate across firesheds, an accurate vegetation map is essential, and a fusion of optical, lidar and ground data is necessary.

Lidar data can produce a range of mapped products that in many cases more accurately map forest height, structure, and species than optical imagery alone. Our work indicated that the combination of high-resolution multi-spectral aerial/satellite imagery with lidar is very helpful in mapping vegetation communities as well as characterizing forest structure zones.

If your goal is to understand the effects of SPLATs, lidar is essential to accurately monitor the intensity and location of SPLAT treatments.

Lidar data can effectively penetrate the forest canopy and can be used to accurately detect forest understory changes. Our work indicated that the use of lidar-derived vegetation structure products (e.g., canopy cover and vegetation height) significantly outperformed the aerial image in identifying the SPLAT treatment extent and intensity. 

False precision in the English Lidar release

Great commentary from Martin Isenburgon of LASTools fame on releasing data with false precision. This deals with the new open data release by the Environment Agency in England. So far LiDAR-derived DTM and DSM rasters have been released for 72% of the entire English territory at horizontal resolutions of 50 cm, 1 m, and 2 m. They can be downloaded here. The rasters are distributed as zipped archives of tiles in textual ASC format (*.asc). 

Martin gives us a cautionary tale on how not to release national data. It is not the ASC format that he has problems with, but the vertical precision. He says:

"The vertical resolution ranges from femtometers to attometers. This means that the ASCII numbers that specify the elevation for each grid cell are written down with 15 to 17 digits after the decimal point."

Example heights might be something like: 79.9499969482421875 or 80.23999786376953125. These data should be resolved to about the cm, not attometer, whatever that is. Crazy man!

Read the full post: http://rapidlasso.com/2015/09/02/england-releases-national-lidar-dem-with-insane-vertical-resolution/

Lidar + hyperspectral, ortho and field data released by NEON

http://www.neoninc.org/data-resources/get-data/airborne-dataFrom LASTools list:

The National Ecological Observatory Network (NEON) published this week airborne remote sensing data including full waveform and discrete return LiDAR data and LiDAR derivatives (DTM, DSM, CHM) as well as corresponding hyperspectral data, orthophotos, and field data on vegetation strucutre, foliar chemistry and ASD field spectra.

NEON Airborne Data Set
.

Some cool images showing the power of lidar and cartography

From Martin Isenburg, the brain behind LAStools.

Using LAStools, ArcGIS, and Photoshop, GRAFCAN has produced a LiDAR-derived digital suface model (DSM) that is seriously doped up: a synthetic map providing an intuitive understanding of the landscape. The product combines standard hillshading with a height and feature based color-coding that enables the viewer to "see" where trees are tall and to grasp height differences between buildings. The new product is available at a resolution of 2.5 meters/pixel via the GRAFCAN Web viewer and also as a WMS service. More info and pics here: http://rapidlasso.com/2013/11/03/grafcan-launches-dsm-on-steroids/.

Comparison between bare earth DTM and DSM with cartography.


Check out the greenhouses, which ppear as “low planar vegetatation”. They are made out of coarse maze fabric (instead of glass) that lets the laser through and does not deflect it (like glass would).

How to Download Lots of Lidar from the Digital Coast

Via LASTOOLS: Kirk Waters, physical scientist at NOAA, describes in his latest blog entry how to efficiently download lots of compressed LiDAR data in LAZ format from NOAA's Digital Coast servers:

http://www.csc.noaa.gov/digitalcoast/geozone/how-to-download-lots-of-lidar-on-digital-coast


He also conjectures that more LiDAR software will be able to input and output the LAZ format soon. After FME, TopoDOT, GlobalMapper, RiProcess, QT Modeler / QT Reader, ... (see http://laszip.org for a complete list of LAZ-enabled software and LAZ download sites).

The Coastal Services Center, home of the Digital Coast, is one cool place. I visited there in the 1990s while at NOAA-Beaufort and working with the C-CAP program.

Check out the GIF workshops for Spring 2013

The GIF workshop schedule for Spring 2013 has been posted! We have a new workshop this semester on Lidar! check it out!

GIF workshops offer hands-on applications oriented training in a variety of geospatial topics. Workshop fees are available at a subsidized rate of $84 for all UC students (graduate and undergraduate), faculty, and staff. Workshop fees are $224 for all non-UC affiliates.

Undergraduate students can apply for financial assistance to take a workshop through the GIF Undergraduate Scholarship Program.

Check them all out here.

Report from the Lidar and NCALM workshop

December 2 2012 the GIF and UC Merced scientists hosted a workshop on lidar for CZO support. This is an annual workshop organized by Dr. Qinghua Guo.

Qinghua presented an overview of his lidar work, which is pretty extensive, and Juan Carlos Fernandez Diaz from NCALM presented an overview of the NCALM program. He talked about the NCALM workflow and their instruments, including their new bathymetric lidar instrument (that can get bathy and terrestrial simultanously for coastal studies), their waveform lidar instrument, and their new balloon-based lidar instrument (cool!) They can run a suite of instruments at the same time: waveform and camera, etc. One of the great things he brought up is the support for graduate students:

The National Center for Airborne Laser Mapping surveys up to ten projects (each generally covering no more than 40 square kilometers) each year for graduate student PIs who need Airborne Laser Swath Mapping data. Beginning in 2012, graduate student PIs can specify either near infrared (Optech Gemini, 1064 nm) or green (Optech Aquarius, 532 nm) bathymetric ALSM data (only one wavelength can be selected), as well as optionally request high resolution aerial photography in conjunction with the ALSM collection. Graduate student proposals must define a basic research question in the geosciences (broadly defined). Check it out!

Hey Sandi Toksvig! Denmark is releasing data...

From the LASTools list. Recently, the Danish government released this announcement of free access to public sector data. Among other things, it means that Danish mapping and elevation data will become free (apparenty "free" as in speech as well as in beer).

Apparently, the intention is that the data should be accessible from the beginning of next year. Ole Sohn, Danish Minister for Business and Growth said:

“When the data has been released it can be used to develop completely new types of digital products, solutions, and services, which will benefit our companies as well as society at large. It is a vital part of Denmark's digital raw material that we are now releasing, which will create growth and jobs in Denmark”.

SNAMP lidar team featured in ANR's Green Blog

The SNAMP spatial team and the cool lidar work we are doing was recently featured in ANR's Green Blog. The article highlights the work of UC Merced in forest visualization. Currently, most visualization software packages focus on one forest stand at a time (hundreds of acres), but now we can visualize an entire forest, from ridge top to ridge top. The Sierra Nevada Adaptive Management Project (SNAMP) Spatial Team principle investigators Qinghua Guo and Maggi Kelly, and graduate student Jacob Flanagan and undergraduate research assistant Lawrence Lam have created cutting-edge software that allows us to visualize the entire firescape (thousands of acres).

New high resolution coastal elevation data for California

The California Ocean Protection Council has released state-wide high resolution elevation data for coastal California and much of San Francisco Bay. LiDAR data were collected between 2009-2011 and cover nearly 3,800 square miles. Data can be download from NOAA Coastal Services Center's Digital Coast website:

Lidar + OPALs geolunch and workshop next week!

Full waveform lidarOur colleague Bernhard Hofle from the University of Heidelberg will be here next week as part of an international exchange project: Airborne Laser Scanning for 3D Vegetation Characterization: Set-up of an International Signature Database. Bernhard is interested in Open Source GI and Spatial Database Management Systems, Object-based image and point cloud analysis, radiometric calibration of full-waveform airborne LiDAR data, and other topics.

Bernhard is part of a group that now has one of the first Terrestrial Laser Scanning (TLS) systems worldwide with full-waveform recording capability (upgraded Riegl VZ-400). Deeper understanding and substantially improved analysis of the laser shot backscatter of natural objects by having direct access to full-waveform signatures and physical observables are expected. The unique system will be applied in new research projects dealing with the extraction of 3D geoinformation in e.g. precision farming, geoarchaelogy, geomorphology and forestry. Furthermore, an extensive web-based database of reference signatures for known objects will be developed based on calibrated waveform features derived by TLS.

He is a leader in analysis of discrete and waveform lidar data in urban and forest applications and one of the developers of the cool OPALS lidar software. He'll be giving a geolunch and a workshop afterwards on the software. The geolunch is 1-2, then we will stick around and learn about OPALS.

ASPRS 2012 Wrap-up

ASPRS 2012, held in Sacramento California, had about 1,100 participants. I am back to being bullish about our organization, as I now recognize that ASPRS is the only place in geospatial sciences where members of government, industry, and academia can meet, discuss, and network in a meaningful way. I saw a number of great talks, met with some energetic and informative industry reps, and got to catch up with old friends. Some highlights: Wednesday's Keynote speaker was David Thau from Google Earth Engine whose talk "Terapixels for Everyone" was designed to showcase the ways in which the public's awareness of imagery, and their ability to interact with geospatial data, are increasing. He calls this phenomena (and GEE plays a big role here): "geo-literacy for all", and discussed new technologies for data/imagery acquisition, processing, and dissemination to a broad public(s) that can include policy makers, land managers, and scientists. USGS's Ken Hudnut was Thursday's Keynote, and he had a sobering message about California earthquakes, and the need (and use) of geospatial intelligence in disaster preparedness.

Berkeley was well represented: Kevin and Brian from the GIF gave a great workshop on open source web, Kevin presented new developments in cal-adapt, Lisa and Iryna presented chapters from their respective dissertations, both relating to wetlands, and our SNAMP lidar session with Sam, Marek, and Feng (with Wenkai and Jacob from UCMerced) was just great!

So, what is in the future for remote sensing/geospatial analysis as told at ASPRS 2012? Here are some highlights:

  • Cloud computing, massive datasets, data/imagery fusion are everywhere, but principles in basic photogrammetry should still comes into play;
  • We saw neat examples of scientific visualization, including smooth rendering across scales, fast transformations, and immersive web;
  • Evolving, scaleable algorithms for regional or global classification and/or change detection; for real-time results rendering with interactive (on-the-fly) algorithm parameter adjustment; and often involving open source, machine learning;
  • Geospatial data and analysis are heavily, but inconsistently, deployed throughout the US for disaster response;
  • Landsat 8 goes up in January (party anyone?) and USGS/NASA are looking for other novel parterships to extend the Landsat lifespan beyond that;
  • Lidar is still big: with new deployable and cheaper sensors like FLASH lidar on the one hand, and increasing point density on the other;
  • Obia, obia, obia! We organized a nice series of obia talks, and saw some great presentations on accuracy, lidar+optical fusion, object movements; but thorny issues about segmentation accuracy and object ontology remain; 
  • Public interaction with imagery and data are critical. The Public can be a broader scientific community, or a an informed and engaged community who can presumably use these types of data to support public policy engagement, disaster preparedness and response.

New York City Solar Map Released

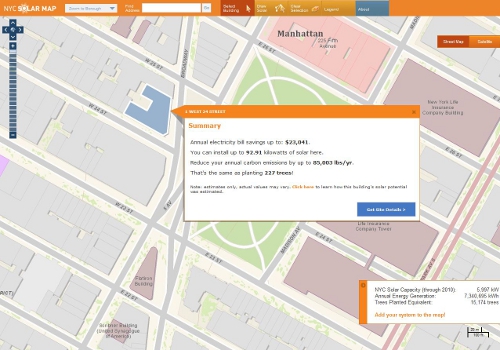
An interactive web-based map called The New York City Solar Map was recently released by the New York City Solar America City Partnership, led by Sustainable CUNY. The map allows users to search by neighborhood and address or interactively explore the map to zoom and click on a building or draw a polygon to calculate a number metrics related to building roof tops and potential solar power capacity including: potential energy savings, kilowatt output (in a time series), carbon emission reductions, payback, and a calculator for examining different solar installation options and savings with your utility provider. The map is intended to encourage solar panel installations and make information regarding solar panel capacity easier to access. Lidar data covering the entire city was collected last year and was used to compute the metrics used to determine solar panel capacity.

Solar Energy CalculatorThe data reveals that New York City has the potential to generate up to 5,847 megawatts of solar power. The installed solar capacity in the US today is only 2,300 megawatts. 66.4 percent of the city’s buildings have roof space suitable for solar panels. If panels were installed on those roof tops 49.7 percent of the current estimated daytime peak demand and about 14 percent of the city’s total annual electricity use could be met.

This map showcases the utility and power of webGIS and how it can be used to disseminate complex geographic information to anyone with a browser, putting the information needed to jump start solar panel installation in the hands of the city’s residents. The map was created by the Center for Advanced Research of Spatial Information (CARSI) at CUNY’s Hunter College and funded primarily by a United States Department of Energy grant.

Source: Click here for a NYTimes Article on the project for more information.

Click here to view the New York City Solar Map.

New York City Solar Map

New BAAMA Journal Published

Volume 5, Issue 1 - Spring 2011

BAAMA is pleased to announce The BAAMA Journal has been published in conjunction with Earth Day.  Special thanks to all our contributing authors and editors.  The BAAMA Journal is a publication that highlights Bay Area people and projects that use geospatial technologies.

IN THIS ISSUE:

  • Building Virtual San Francisco: Growing Up With GIS
  • DPW Uses LiDAR and a Custom Algorithm for Delineating Drainage Catchments and Hydrologic Modeling
  • Preparing Historical Aerial Imagery of Southern California Deserts for use in LADWP's GIS
  • Where in the Bay Area


New SNAMP spatial newsletter on lidar posted

This is an exerpt from our recent SNAMP newsletter on our lidar work, written by me, Sam, and Qinghua.

We are using Lidar data to map forests before and after vegetation treatments and measuring forest habitat characteristics across our treatment and control sites. These data will give us detailed information about how forest habitat was affected by fuel management treatments.

Visualizing the forest
The image at left is not a photograph: it is a computer generated image of our SNAMP study area, using only Lidar data. These kinds of visualizations are commonly used in the forestry field for stand and landscape management, and to predict environments into the future.  But visualization software packages usually only focus on one stand at a time. Our method allows us to visualize the whole firescape.  This is useful for understanding the complexity in forest structure across the landscape, how the forest recovers from treatments, and how animals with large home ranges might use the forest.  The UC Merced team created this cutting-edge product.

Finding the trees in the forest
In order to see the trees in the forest, the UC Merced spatial team researchers developed a method to segment individual trees from the Lidar point cloud. The method identifies and classifies trees individually and sequentially from the tallest tree to the shortest tree. We tested this method on our SNAMP Lidar data. These forests are complex mixed coniferous forests on rugged terrain, and yet our method is very accurate at defining individual tree shapes. We are applying the method in both of the SNAMP study areas.

Mapping downed Logs with lidar data
The UC Berkeley spatial team researchers used some new techniques that help distinguish individual features, and mapped the logs, as well as some of the trees in this stand. In the figure at left: red colors are logs, green colors are trees.

More information on these and other projects can be found on the SNAMP website.