Fall 2009 GIF workshop schedule posted

The fall 2009 workshop schedule at berkeley's geospatial innovation facility (GIF) is posted! There are several new workshops scheduled, including:

  • Intro to Geographic Information Systems (GIS): Social Science Focus;
  • Intro to Open Source GIS: Working with Quantum GIS (QGIS);
  • Intro to Agent-Based Modeling: Using GIS data with NetLogo; and
  • Intro to LIDAR applications in Remote Sensing.

Check out the website!

New 'Map Illustration' Software for Mac Users

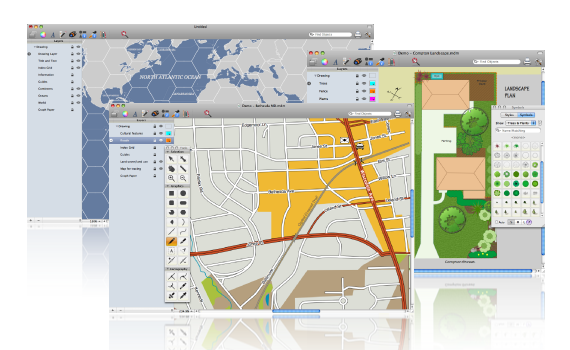
Mapdiva, LLC has just resleased its map illustration software OrteliusTM  for Mac computers. It's only 30Mb to download a free 31-day trial version, and for now they're offering an 'Introductory Price' of $79 (versus $99) until the end of September. An Education Edition is also available only $39 (after Sept. 30 willl be $49) for currently enrolled students with a valid .edu address.

Note that the company states, "Ortelius is designed for cartographic output as the end product, intentionally not a GIS system, though the Professional Edition with add more GIS-type operations to the currently available tools. On a general note the Standard Edition is likely to fall short in some aspects for hardcore geographers and GIS users; the Professional Edition is intended to provide many more GIS features." So some users may want to wait for the Pro Edition for increased functionality.

From The Map Room

When good maps go bad - cartastrophe blog

I am not a fan of blogs soley created to bash others' mapping and webGIS work without offering any constructive critisism or at least offering examples of the author's own work. You know who you are. But this one seems to provide good examples of common map mistakes with helpful reference to cartographic theory (and has a clever title).  I will likely use some of these examples in my class.

Using LiDAR las files in next eCognition version

via Andreas Lang at the Definiens Community

Can we load and process LiDAR las files in Definiens eCognition (Developer or Server) directly?

The new Definiens software will have two ways for handling las files via converting them into rasters directly in the Software:

  • a raster driver for loading and visualizing these kind of images (with an appropriate dialog for setting the resolution for converting the point cloud to a 2D raster) using the driver the user can see the intensity data and select an appropriate subset;
  • an algorithm for converting the existing loaded image layer (las file) into a feasible layer with appropriate data of intensity, elevation, class or number of returns for further processing with much more functionality for filtering:
    • By Return (All/First/All)
    • By Classes
    The user can also select the kind of calculation for a raster cell value (Average, Minimum, Maximum, Median, Most frequently. value).


Offset points in ArcMap

Working with GIS, everyone encounters those problems that he knows there is a solution to, but he has no idea how to fix. Dealing with overlapping points has been a persistent example of such a problem for me. The other day, I was working with a file that contained several points with identical locations. In this case, the precise location of the points was less important than depicting the number of occurrences in the general region. I still wanted to show points on the map and did not want to show the number of occurrences in an enclosing polygon. Therefore, I needed a way to spread my points out.

After briefly scouring the ESRI site I found this guide for separating points based on labels. Essentially, this documents gives instructions to remove the symbols for the points in question and to enable the labels, but replacing the label text with symbols. Now symbols for the points show up where the labels would normally appear. I used this in conjunction with the labeling tools in the Maplex extension in ArcMap to gain a little more control over how the labels would be dispersed and to provide more offset.

This solution is only appropriate in certain scenarios, but it is a quick fix to a problem that I frequently encounter.

Does anyone else use a different solution to this problem?

ASPRS board approves LAS 1.3 specification

The American Society for Photogrammetry and Remote Sensing (ASPRS) is pleased to announce LAS 1.3, a new release of the open file format for lidar data storage and delivery. ASPRS has been maintaining and updating this widely used specification since its inception at the beginning of this decade.

The 1.3 release adds support for waveform encoding of laser returns. The encoding of this new data extension is optional, allowing LAS 1.3 to be used as the specification in normal multi-return delivery products.

“ASPRS has been very proactive in accommodating the rapid advances in LIDAR hardware technology with frequent updates to the LAS specification,” said Jim Plasker, Executive Director of the ASPRS. “This latest update allows lidar system vendors to store waveform information directly in the LAS file. This new capability offers exciting opportunities for developing advanced algorithms for application areas such as urban modeling and forestry. Over 50 hardware vendors, software developers, production companies and commercial/government agencies participated in the development of this latest version of the specification and thus we expect that it will be rapidly adopted for both exploitation and data delivery.”

The LAS version 1.3 specification was approved by the ASPRS Board of Directors on July 14, 2009 and is available for immediate use. The full specification can be downloaded from the ASPRS website at http://www.asprs.org/society/committees/standards/lidar_exchange_format.html

Definiens community site launched

At our Definiens workshop today, Juan mentioned that the Definiens community website has been launched in the last month. Definiens is one of the few comprehensive segmentation and classification software solutions targeted for high spatial resolution imagery processing.  I've used the software for mapping tidal wetland sites, and for mapping dead crowns in oak forests.  The community site includes lots of information on shared codes, videos, demos, and discussion.  Since the software is so comprehensive, and has so many possible options, it can be difficult to become an expert. I personally like to know the "choice domain" within which I am working, so learning Definiens places me somewhere on the edge of my comfort zone. But with this, especially the rule set sharing, I think I can get stuck in. Thanks Juan!

The GIF is one of 7 Centers of Excellence for Definiens; other sites include:

Get those roofs fixed: El Nino is coming!

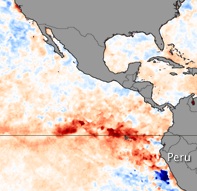
From NASA Image of the Day: In July 2009, the National Oceanic and Atmospheric Administration (NOAA) Climate Prediction Center reported that ocean temperatures in the central and eastern Pacific had shifted into El Niño—anomalously warm—conditions. El Niño conditions are evident in this sea surface temperature anomaly image based on data from the Advanced Microwave Scanning Radiometer for EOS (AMSR-E) on NASA’s Aqua satellite on July 26. THe current data are compared to long-term average temperatures (1985-1997) measured by the Advanced Very High Resolution Radiometers that have flown on several NOAA missions.

In this map, places where temperatures were near normal are cream-colored, places where temperatures were warmer than normal are red, and places where temperatures were cooler than normal are blue. An area of dark red occupies the eastern Pacific off the coast of Peru and Ecaudor (north of Peru), indicating temperatures were much warmer than average. Meanwhile, across the Pacific, ocean temperatures around Indonesia were slightly cooler (light blue) than usual.

GPS vs. GPS

There has been some buzz on the blogs about the possibility of smart phones replacing more standard recreational grade GPS devices. This article in the NY Times suggests that the smartphone is beginning to displace the GPS receiver as a convenient way for drivers to get directions to unknown destinations.

Next might be the use of smart phones for non-driving uses of the recreational GPS devices, like geocaching, or science education.  We will be releasing our OakMapper device for the iPhone in September, and will likely be better able to comment on the comparison.

Indigenous mapping network at UC Berkeley

Our friends from DataBasin are on campus on Monday. Kai Henifin is a Cultural Ecologist/GIS Analyst with the non-profit organization Conservation Biology Institute, the developers of DataBasin. Kai will be speaking about "Incorporating Indigenous Knowledge to Improve Conservation through Data Sharing" as part of the Berkeley Indigenous Mapping Network. For more info on the event.

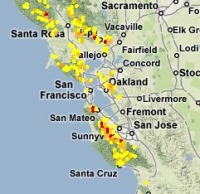
We have some interesting cross-overs with CBI and DataBasin: we added our SOD data to DataBasin recently (see image at left); and CBI have a nice modeling project looking at fisher in the southern Sierra that Reg and Rick are using in their SNAMP work.

Interesting sources of data for science: commerce and construction for ecological trend analysis

In the early 1800s, Canadian fur traders began to notice dramatic fluctuations in snowshoe hare (Lepus americanus) and Canadian lynx populations (Lynx canadensis). Almost 100 years later, ecological researchers were able to use pelt sale data generated by the Hudson’s Bay Company to document an interrelated rise and fall in hare and lynx populations. Today, we understand even more about this classic and frequently cited example of predator–prey cycles, and have identified large-scale factors, including climate, as playing an important role in regulating these populations and their interactions. But it was the novel use of commercial records that got scientists started on their work. This piece excerpted from our article on webGIS.

Now, in the same spirit, comes this article in PERS recently, and it prompted me to start collecting studies on interesting and non-traditional sources of data for hinting at or validating ecological trends. Download Full Article (members only)

The article: Wal-Mart from Space: A New Source for Land Cover Change Validation by Potere et al. The authors use the location and opening dates for 3,043 Wal-Mart stores as a means for validating land-cover change-related products at medium (28.5 m) to coarse (250 m to 1 km) resolutions throughout the conterminous United States. Since Wal-Marts are large, nearly everywhere, and have been built throughout the remote sensing record (1962 to 2004), they prove to be good data set for examining land cover change. A very interesting and creative approach.

Costs & benefits of lidar

I am collecting information on the costs and benefits of lidar primarily in forest research/management. Since lidar is still in the research phase in many forest applications (although there are some operational aspects to the technology), we get questions about the relative costs of lidar vs. fieldwork. I am collecting information here.

There is more information on the cost-benefits of lidar for topographic mapping and construction. See for example the blog from Merrick. State-wide mapping (e.g. NC), coastal mapping and floodplain mapping clearly see a benefit in increased accuracy and coverage from using lidar over more traditional surveying methods. See an example here from the USGS; Greg Snyder also has some nice graphics in a presentation at ASPRS available here.

For forestry applications, however, there is less information on the relative costs of lidar vs field capture. Tree attributes such as height, dbh (diameter at breast height), height to live crown, species, age, location, basal area, volume, biomass growth and leaf area index have been measured in the field in forest plots for over 100 years. Many of these attributes can be measured directly using LiDAR data, and some can be inferred from lidar data. Stand attributes such as age, trees per hectare, mean diameter and height, dominant height, volume per hectare, form factor, annual increment per hectare and growth have also been estimated from individual plot data for some time. Again many of these can be measured from processed LiDAR data. Accuracy, which is usually estimated by comparing ground data from a series of plots with lidar values, varies with species, density, topography, lidar equipment. For example, in our SNAMP project, preliminary analysis shows r2 of 0.78 for tree height, and 0.65 for dbh. A clear technical advantage of lidar is the ability to completely inventory the forest, instead of collecting a sample of plots that might not be representative of forest heterogeneity. The derived data products that come from lidar can easily be used at multiple scales (and resolutions) as direct inputs to fire models and environmental niche models. The field plot-based approach requires interpolating between these sampled plots to generate a continuous surface.

But as for costs, there are few solid comparisons. The cost of lidar includes aquisition, field data collection, and processing, which includes software and hardware as well as personnel.  These can add up.  Most comparisons of lidar vs. field alone concentrate on the technical advantages highlighted above. One exception is Renslow et al. (2000) who claim that for a typical even-aged, managed forest of 500,000 acres where in each year, 2% of 10,000 acres (200 acres) are sampled to determine what management steps are needed, cost savings with lidar would be $15,400 annually.  I think this is overly optimistic, as it only includes 2 weeks for analysis.  Our SNAMP analysis (albeit over a much larger area) takes considerably longer.

So, in proto-conclusion, I think the advantage of lidar is clearly in its accuracy and coverage, and these outweigh any cost savings that a fast and cheap field campaign might provide.  Still, I will come back to this topic later with more analysis from our SNAMP project.
 

Mapping virtual trees and buildings

From a series of news releases (all text, no pics, alas): UK aerial survey specialist Bluesky has launched a brand new digital map layer accurately modelling the location and extent of trees and their proximity to buildings. Designed as a tool to aid insurance assessors, property developers and Local Authority Planners, ProximiTREE details the exact spatial location and height of individual trees together with the circumference of its canopy. From this information a determination can be made of the root extent and the potential impact on either existing or proposed properties.

They plug this product for its use in avoiding building subsidence, but in fire-prone Cali, we could use it to look at defensible space and risk.

They also provide a range of good downloads, including sample data and software for your enjoyment.

Science Editor-in-Chief

I know this is late: blame my routine end-of-semester office paper clean-up (late again). This comes from last year, when Bruce Alberts took over Science. He says in his first editorial: New science will be needed on our crowded planet to protect our environment, to insure our health, and to provide sufficient water and food for humanity.  I think that is true, and sounds a lot like the CNR's mission statement.

New Remote Sensing Journal

I just received an announcement about a new journal for RS folks, succinctly named Remote Sensing. It is a new open access journal of the remote sensing process, from instrument design and signal processing to the retrieval of geophysical parameters and their application in geosciences. Remote Sensing is published under the leadership of Prof. Dr. Wolfgang Wagner from the Institute of Photogrammetry and Remote Sensing (I.P.F.), Vienna University of Technology (TU Wien), Vienna, Austria. Check it out.

iPhone apps for environmental science

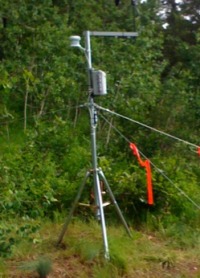
Having just set up a HOBO weather station over the weekend (ain't she pretty?), and being dismayed at having to use my windows computer to control it, I wondered about other ways to monitor the environment.  Amazingly, but perhaps not surprisingly, there are many new iPhone apps out there for us to investigate. 

For example: the recent NPR study about soil moisture monitoring via the iPhone is interesting. The sensors themselves are very expensive, but are monitored via an iPhone app.

Also: this new Wind Meter app, which I am going to test at lunch today. Seems fun, but a far cry from a real anemometer.

And of course: we will soon be releasing our OakMapper iPhone app.

Sudden Oak Death Science Symposium Highlights

I thought I'd post some highlights from the SOD Science Symposium, currently running in Scotts Valley, CA.

Dave Rizzo presented new disease information since the first isolations (9 years ago this week!) in 2000 to today. Some highlights include:

  • Across California, there has been filling in of existing areas of the disease, but new areas of confirmation of note:
    • furthest north in CA is 45 miles north of Redway, CA; confirmed from stream baiting, and is associated with a nursery. No terrestrial confirmations. In Mendocino, another river baiting example north of Fort Bragg; no terrestrial confirmations.
  • There are some exciting management projects ongoing, from preventative treatment to large-scale management.

Alan Kanaskie talked about the Oregon situation. Highlights include:

  • Tanoak is critical for SOD in Oregon;
  • Monitoring in OR depends on aerial surveys, field surveys and stream baiting. With these methods, they are confident that ramorum only exists in the known quarantine area. However, they are getting rare PCR confirmations out of steam baiting in new watersheds, but they have not been able to replicate with culture, nor have they found any newly infected trees in those watersheds.
  • They are confident their management approach is working to slow the spread, and compares a map of Humboldt and Curry counties; in Humboldt, things look worse than in Curry.

Sandra Denman from Forest Research in UK gave an update on Pr in Europe: still mainly a nursery problem, but some interesting facts include:

  • Coutries reporting Pr in Europe in 2000 were few, and only 4 countries had outdoor outbreaks; in 2008: 19 countries report Pr in nurseries, and "burgeoning" reports of outdoor outbreaks across western and southern europe.
  • In the UK, Pr has been found in 600 nurseries in UK. In outdoor outbreaks, rhodies are the main problem, and outside outbreaks on trees are associated with these ornamentals.
  • First use of "kerfuffel" in a science presentation that I have heard.
  • P. kernoviae is also important in UK; and last year Pk was found in the Republic of Ireland for the first time.

Clive Brasier, from UK Forestry Commission, talked about P species and increased invasions due to international trade, and weak international biosecurity. Before 2000, about 20% of P sp were threats to forests; since 2000 (with 50+ new P species named), about 60% are threats to trees and forests. He guesses there might be 100-500 unnamed P. species out there that could be invasive in forests. They are now hypothesizing that Pr came from Japan and/or Taiwan.

For more on Sudden Oak Death, check out the OakMapper site, and other oakmapper posts on this blog.

Maps + Compass

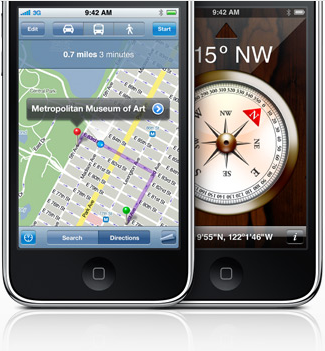
In iPhone OS 3.0, a digital compass will be provisioned, which could potentially add more helpful features to the existing Google Map application. Already, the soon-to-released OakMapper Mobile is taking advantage the open API for Google Map in iPhone SDK 3.0beta to create an application that allow iPhone users to view and report SODs on their iPhones. I believe that the future iteration of the OakMapper Mobile application can take advantage the built-in compass to re-trace the reported SODs.


Lidar web resources

As a lead-up to this week's SNAMP Spatial Team Workshops on our LiDAR data, I am collecting the great web resources for LiDAR here.