New Google SketchUp plug-in integrates 3D laser scan data

Pointools has just announced the availability of a new plug-in for Google SketchUp to be released in a few weeks. This new plug-in will make it easy to visualize and use point cloud data from sources such as mobile ground based scans and aerial lidar for 3D model building in Google SketchUp. The plug-in offers built-in support for Google’s geo-location services to coordinate StreetView textures and aerial imagery alongside point clouds. This new tool allows for a new data source to be used to create photo realistic 3D models of buildings and landscapes.

Click here for the full story and here for a video of the plug-in in action.

Image Source: Pointools Wordpress

QGIS 1.6 'Copiapó' released

The folks working on Quantum GIS (QGIS) have recently released a new version of their popular open source desktop GIS application that works on Windows, Mac, and Linux. 

Version 1.6 can now be downloaded from qgis.org via http://download.qgis.org.

There are a lot of new features and bug fixes in this version, adding even more power to use QGIS as a viable analysis platform.  You can read the entire list of new features here.

Be sure to check out the included analysis plugins for:

  • OGR Converter: Convert between more than 30 vector formats, including shapefile, kml, mapinfo, gpx...
  • Interpolation: Interpolate vector data using Triangular Interpolation (TIN) or Inverse Distance Weighting (IDW)
  • Raster Based Terrain Analysis: Convert DEM data to Slope, Aspect, Ruggedness, or Total Curvature
  • Spatial Query: Topological operations include contains, equals, intersects, touches...
  • GDAL Tools: Adds a new drop down list to your menu that includes many GDAL functions like warp, translate, or contour.  This adds a lot of the power of GDAL without the need to write scripts.
  • fTools: Adds a new dropdown list to your menu with many geoprocessing and analysis functions such as buffers, joins, nearest neighbor, vector grid creation...
  • GRASS: Adds a suite of tools that allow you to use much of the GRASS functionality within the QGIS application

If you are relatively new to GIS, and would like to try QGIS, we've just added an introductory tutorial to the GIF's Quick Start Guides based on this latest software release.  Check out the pdf and accompanying data for Introduction to QGIS: Basic geoprocessing and making a map layout


New global map of mangroves

From NASA. Mangroves are among the most biologically important ecosystems on the planet, and a common feature of tropical and sub-tropical coastlines. But ground-based evidence suggests these vital coastal forests have been strained in many regions because of harvesting for food, fuel, and medicine. Now, scientists have used satellite images to compile the most comprehensive map of mangroves worldwide, which should help in future efforts in monitoring and conservation. New global maps of mangroves have been developed.

The effort to create the maps was led by Chandra Giri of the U.S. Geological Survey and published recently in the journal Global Ecology and Biogeography. Using digital image classification techniques, the research team compiled and analyzed more than 1,000 scenes from the Landsat series of satellites.

Giri and colleagues found 12.3 percent less area covered by mangroves than previously estimated by the United Nations Food and Agriculture Organization. The current extent of mangroves is probably half of what once existed. Only 6.9 percent of mangrove forests are protected by law.

See more here.

corridor analysis tools

Alan shared a link with me for Corridor Design. It includes downloads for various GIS Tools, overviews of corridor concepts, and reports on linkage designs. The stated goal is "to transfer everything we've learned about designing wildlife corridors to the general public to facilitate better conservation, science, and dialogue."  Check out the site's blog for info on their latest projects.

National Map of Food Deserts

I live in a Low Access Area! According to a new food desert webGIS, my neighobrhood around 58th & Shattuck doesn't have access to a full-service grocery store, has low car ownership, and low median household income. I have never considered my self to live in a food dessert because I go to Berkeley Bowl at least once a week on my bike ride home from campus, but according to these combined metrics I am more underserved by full-service food stores than most other neighborhoods. I think this is a really neat tool to start a broader conversation about how to measure and evaluate food access and what it means for individual and community health.

As Grist writes...."The point of the project isn't just to map food deserts, it's to help TRF and other investors, as well as policymakers, calculate how much money is "leaking" from an area (being spent elsewhere), so as to evaluate whether a loan for a new supermarket is a good idea -- financially, presumably. As Stephanie covered in her piece, food-justice advocates disagree on whether small, independently owned but somewhat limited food stores are the answer, or chain stores such as a Safeway or Walmart.

Alas, the tool does not include data for health care expenditures or obesity rates in these areas, which would be interesting comparisons to see."


GIS Day this week!

GIS Day 2010
November 17, 2010
3:00 pm to 8:30 pm
UC Berkeley, Mulford Hall
http://gif.berkeley.edu/gisday.html

Please join us for GIS Day 2010 on Wednesday, November 17. 
The list of speakers and topics are now available on the event site, including this year’s keynote presentation from Brady Forrest!

GIS Day is free, but we encourage you to register, so that we know how many people to expect.  We still have room for posters, if you’d like to display a poster (project, map, imagery) just sign up online.

This year's event is co-hosted by the Bay Area Automated Mapping Association (BAAMA) and Geospatial Innovation Facility (GIF), with support from the Northern California Region of the American Society for Photogrammetry and Remote Sensing (ASPRS).


Google Maps border becomes part of international dispute

(CNN) -- The accuracy of Google Maps has been pulled into a debate about the border between two Central American countries.

A Nicaraguan general cited Google's version of the border map as an after-the-fact justification of a reported raid of a disputed area between that country and Costa Rica.

http://www.cnn.com/2010/TECH/web/11/05/nicaragua.raid.google.maps/index.html

Had to do it: Giants' Parade Map released

The San Franciso Giants parade will be held Wednesday on Market Street. This is the first title for the franchise’s since they moved to San Francisco in 1958. The Giants lost the World Series in seven games in ‘62. They lost the World Series of ‘89 that was better known for the earthquake. They lost the World Series in 2002 though they had a five-run lead with eight outs to go. But who cares about all that old stuff now!


What the world needs: a global map of cheese

gotta love a map about cheese.And lots of other things as well. Check out this great global map visualization of world cartograms showing many resources. This one shows global production of cheese. Mmm. They say: with rising incomes, consumption of cheese has increased worldwide. The United States is the leading cheese maker, producing about 25% of the world's cheese and over 400 varieties. Greece and France are the largest consumers of cheese, each consuming over 50 pounds of cheese per person each year. Japan, Philippines and China are the newest markets demanding more cheese. Cheese around the world.

Yikes! GPS surveillance reported on NPR

One more for the privacy files. From NPR.org. When Yasir Afifi took his car in for an oil change, his mechanic found an unusual wire hanging from below. It was part of a black rectangular device attached to his car by a magnet. After posting photos of it on an online forum, where posters identified it as a GPS tracking device, Afifi, a Santa Clara, Calif., college student and computer salesman, got a visit from FBI agents demanding their equipment back.

The FBI confirms the device belongs to the agency and that agents visited Afifi to get it back. But Special Agent Joseph Schadler won't say why it was there. Full article


New conference: Mapping Global Change with Spatial Stats

23-25 March 2011, University of Twente, Enschede, The Netherlands.
Spatial statistics is a rapidly developing field which involves the quantitative analysis of spatial data and the statistical modelling of spatial variability and uncertainty. Applications of spatial statistics are for a broad range of environmental disciplines such as agriculture, geology, soil science, hydrology, ecology, oceanography, forestry, meteorology and climatology, but also for socio-economic disciplines such as human geography, spatial econometrics, epidemiology and spatial planning.

The aim of the meeting is to present interdisciplinary research where applicability in other disciplines is a central core concept.

Early Bird Registration: January 15 2011.

Mapping science and the city - from Nature

Suggested by Tim. Nature has a nice viz on where science happens, in terms of cities, and how publication output interacts with publication impact. Their analysis - provided to Nature by Elsevier - of Scopus data shows how absolute counts of publications per city and relative citation impact have changed from 2000 to 2008. The interactive graphics supplement the news feature 'Building the best cities for science' part of Nature's special package on Science and the city. Berkeley does quite well, by the way. Go Bears!

They also have the same information as a google earth viz. Very cool.

TanDEM-X and TerraSAR-X set to create global DEM by 2014 at 12 m spatial resolution

German based TanDEM-X and TerraSAR-X satellites, launched in 2007 and 2010 respectively, begin their tandem orbit flight to create a new global DEM product of the Earth's surface to be available in 2014.

The TanDEM mission seeks to produce a global DEM at 12 meter sp

atial resolution with a relative vertical accuracy of less than two meters. With this kind of specification "'the TanDEM dataset will replace SRTM'". The US Shuttle Radar Topography Mission (SRTM) of 2000 is one of the best-known, near-global, space-borne DEM prior to TanDEM. Its best product has a 30 meter spatial resolution, and a vertical accuracy that varies from 16m to 10m.

Airborne laser instruments such as Lidar can achieve finer spatial resolution and vertical accuracy but their products are regional - they are not seamless maps of the whole Earth as TanDEM will be able to achieve. For more read the full story here.

Back when maps were big and physical: giant 1924 relief map of CA found in SF

The giant "Paradise in Panorama" relief map of California, made in 1924, was displayed at the Ferry Building. Credit: Barney Peterson / The Chronicle 1963San Francisco's oldest and best-known white elephant - the huge three-dimensional relief map of California that once graced the Ferry Building - has turned up at an undisclosed location on the city's waterfront.

The map was one of the wonders of the West when it was unveiled in 1924. See article from SFGate.

It was as long as two football fields and showed California in all its splendor, from Oregon to Mexico, with snow-capped mountains, national parks, redwood forests, a glorious coastline, orchards and miniature cities basking in the sun. It was made of plaster, wire, paint, and bits of rock and sand. In the summer of 1924, Scientific American magazine said it was the largest map in the world.

Geospatial Revolution Project launched

Penn State Public Broadcasting has released the first episode of the Geospatial Revolution Project,"an integrated public service media and outreach initiative about the world of digital mapping and how it is changing the way we think, behave, and interact." 

These videos are a great resource for sharing the wonder of all things geospatial in an exciting and easy to understand format. Three additional episodes are set to be published throughout the year. 

View the site to watch the videos and learn more, and keep an eye out for Berkeley's own Kass Green who contributed to the project.

Mapping Traffic’s Toll on Wildlife

Roadkill and participatory GIS (two of my favorite topics) make it mainstream! A recent article from the New York Times describes a project out of UC Davis using citizen observers to map roadkill.

"Volunteers comb the state’s highways and country roads for dead animals, collecting GPS coordinates, photographs and species information and uploading it to a database and Google map populated with dots representing the kills. The site’s gruesome gallery includes photos of flattened squirrels or squashed skunks."

The project website can be found here: http://www.wildlifecrossing.net/california/

Read the NY times article here.

Clark Labs teams up with Google.org to develop web based land-cover analysis and REDD tools

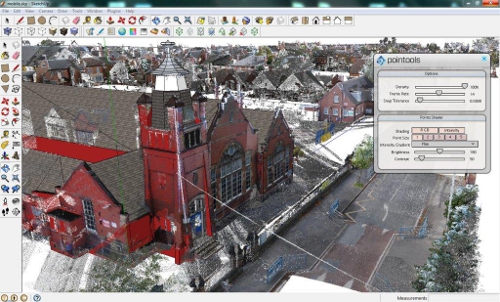
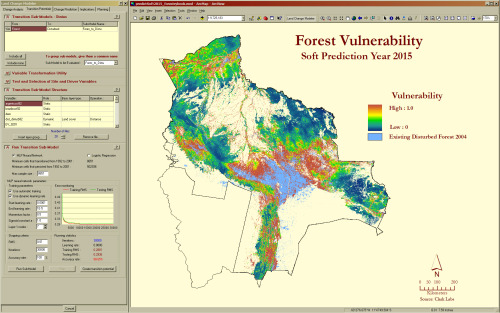
Land Change Modeler for ArcGIS (Image used with permission from Clark Labs)

From Clark Labs news:

Clark Labs recently received a $451,000 grant from the Gordon and Betty Moore Foundation to support the development of land-cover analysis and REDD tools for use on Google's Earth Engine. REDD, Reducing Emissions from Deforestation and Forest Degradation, is a climate change mitigation strategy that offers developing countries incentives to reduce forest carbon emissions. The complex implementation of REDD relies on substantial computing and data resources, and requires significant effort and investment. It is hoped that providing accessible modeling tools with Google’s cloud computing resources and wealth of geospatial data will encourage broader adoption of REDD.

The grant supports the development of a prototype of the land change analysis and prediction tools for Google.org’s Earth Engine platform, a technology in development that enables global-scale monitoring and measurement of changes in the Earth’s forests. It is planned that Google will host the required geospatial data layers to implement a REDD project, including maps of those factors identified as critical causes of deforestation, such as proximity to roads, slopes or distance from existing deforestation.

The new tools in development will guide the user through the steps of baseline development--land change analysis of the reference, project and leakage areas of a project, the identification of the carbon pools and input of carbon density values, and the estimation of emissions for projected dates. This new functionality will also directly produce the multitude of tables and graphics for the carbon accounting reporting requirement of REDD. The preparation costs of REDD will be significantly reduced by the automation provided by these tools.

Clark Labs is based within the Graduate School of Geography at Clark University in Worcester, MA and is the developer of the IDRISI Taiga GIS and Image Processing software and the Land Change Modeler software extension to ArcGIS. To view the full news release click here.