SNAMP spatial newsletter on lidar

This is an exerpt from an older SNAMP newsletter Marek and I wrote describing the use of lidar in our Sierra Nevada Adaptive Management Project. Originally published November 2008.

Environmental sciences are inherently spatial, and geospatial tools such as Geographical Information Systems (GIS), Global Positioning Systems (GPS) and remote sensing are fundamental to these research enterprises.  Remote sensing has been used for forest and habitat mapping for a long time, and new technological developments such as LIDAR (light detection and ranging) are making this field even more exciting.  Here we briefly describe LIDAR’s basic principles and show some preliminary analyses completed for the SNAMP Project. We are using this data to model detailed topography to help the water team understand runoff in the SNAMP watersheds, to map forest canopy cover and vegetation height as inputs to the fire and forest health team’s detailed fire models, and to derive important forest habitat characteristics for the spotted owl and fisher teams.

We contracted with the National Center for Airborne LIDAR Mapping (NCALM) for our data.  They flew the GEMINI instrument at approximately 600 m above ground level, with 67% swath overlap. The instrument collected 4 discrete returns per pulse at 125kHz, and the data has a final
density of 9 points per m2.
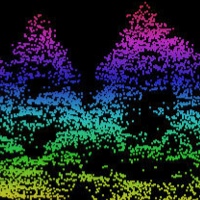
Raw Data: LIDAR data is typically delivered as a “point cloud,” a collection of elevations and their intensities that can be projected in a three-dimensional space. In Figure 2 (right) we show this “point cloud” concept. There are thousands of individual points in the image, each colored according to its height (magenta and red are high, orange and yellow are low). 
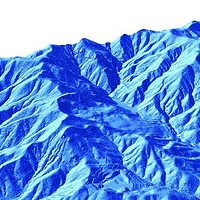
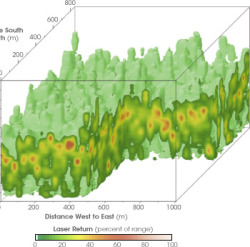
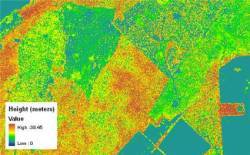
Bare Earth: Once the data is collected, the first step is to transform the data into a “bare earth” model; which is an approximation of the ground if all objects above surface are removed.  We use the “Last Return” data (see Figure 1 above) to generate this model of the bare earth.  These are typically very detailed products (with a small footprint on the ground) and provide much more topographic information than from Digital Elevation Models (DEMs) that were derived from topographic maps.  Our DEM has a ground resolution of under 1m.
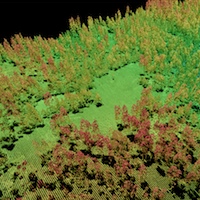
Forest Structure: Another typical step in processing LIDAR data is to examine individual trees and forest structure.  An example of a forest stand is shown in Figure 4.  These and other products help us understand how the forest influences surface hydrology, how a patch of forest might provide habitat for a fisher and how a forest might burn given certain weather and wind patterns.  

Future Analyses: We are in the process of linking the forest parameters gathered by the Fire & Forest Ecosystem Health Team in summer 2008 with the LIDAR-derived data to help scale-up forest variables to the fireshed scale.  For example, tree height, tree DBH (diameter-at- breast-height) and canopy cover have been successfully modeled using LIDAR data in other studies, and there is active research linking field-based and LIDAR-based fire-related measures such as canopy base height and ladder fuels, and wildlife-related measures such as vertical structure. 
Very high res urban mapping: research reported at the Berkeley BEARS 2011 EECS Annual Research Symposium

February 17th Berkeley Electrical Engineering and Computer Sciences (EECS) Annual Research Symposium some interesting new developments and research in the world of information technology were showcased. The first section of the symposium hosted four talks about current and future research at UC Berkeley in IT focusing on large scale data mining, aggregation and analysis; artificial intelligence and language processing; augmenting reality with virtual and mobile systems of information display and collection; and sensor/communication nanotechnology.

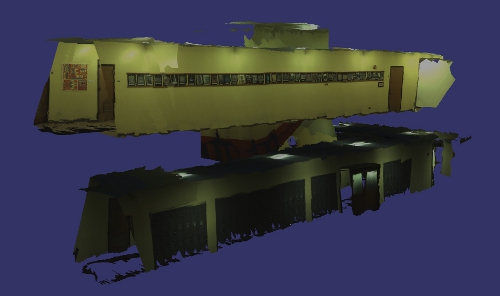
Most notable in application to GIS, although far off, it was mentioned that work is underway to try to miniaturize the lasers in LiDAR sensors to the scale of inserting them into mobile phones to enable collective 3D ground mapping of urban areas from mobile users and for placement in building materials to monitor building occupants/conditions. More current was the talk from Avideh Zakhor about work in the VIP lab on combining data from mobile ground based sensors, similar to those used to create Google street view, with aerial photos to create 3D urban models at varying resolutions (Read more) (Video). Also in development is putting the same technology that is used to create Google street view of exterior streets in the interiors of buildings. This enables the creation of 3D interior building models and photorealistic walk through environments of interior spaces. This may have many implications in emergency  preparedness/management, design, and marketing (Read more) (Example image below).

Source: Image from Avideh Zakhor homepage: http://www-video.eecs.berkeley.edu/~avz/

Check out the BEARS 2011 website here for more information and for video recordings of the talks to be up soon.

For more information on the individual presenters: Ion Stoica, Dan Klein, Avideh Zakhor, Kristofer Pister, and Jan Rabaey.

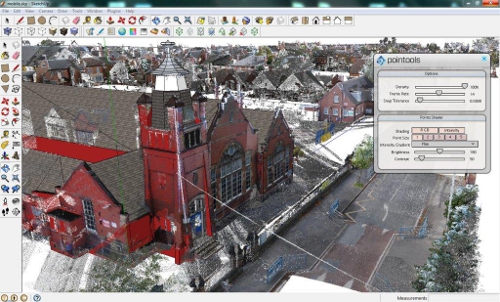
New Google SketchUp plug-in integrates 3D laser scan data

Pointools has just announced the availability of a new plug-in for Google SketchUp to be released in a few weeks. This new plug-in will make it easy to visualize and use point cloud data from sources such as mobile ground based scans and aerial lidar for 3D model building in Google SketchUp. The plug-in offers built-in support for Google’s geo-location services to coordinate StreetView textures and aerial imagery alongside point clouds. This new tool allows for a new data source to be used to create photo realistic 3D models of buildings and landscapes.

Click here for the full story and here for a video of the plug-in in action.

Image Source: Pointools Wordpress

California Coastal LiDAR Project (CCLP) to be available later this year

The California Coastal LiDAR Project (CCLP) is a collaborative effort to produce high-resolution topography data from Oregon to Mexico, extending from the shoreline up to the 10 m topographic contour. The U.S. Army Corps of Engineers (USACE) began a coastal aerial LiDAR collection in October 2009 as part of the National Coastal Mapping Program (NCMP). A combined effort by NOAA and USGS was developed in the latter half of 2009 to conduct LiDAR surveys of the San Francisco Bay Area extending from the Carquinez Strait to outside of the Golden Gate. The two projects are expected to be completed by mid-2010. Datasets will become publicly available by the end of 2010.

http://www.opc.ca.gov/webmaster/ftp/pdf/opc_cclp_report_final.pdf

http://www.opc.ca.gov/2010/01/mapping-californias-coastal-areas/

LAS 2.0 Specifications

Hot on the heels of the recent release of ASPRS LAS Specification 1.3 (mentioned earlier), the ASPRS Lidar Committee is now undertaking work on LAS 2.0.  LAS Specification 1.3 added support for waveform and flagging of synthetically-generated returns.  The goals and direction for LAS 2.0 are currently under discussion within the ASPRS Lidar Committee.  We welcome your participation at our upcoming meeting at the San Antonio conference – Lidar Hot Topics, Open Discussion – scheduled on Wednesday, November 18, from 4:00 to 5:00 PM. 
For more information, contact:

  • Randy Rhoades: Lidar Committee Chair; Randy.Rhoads@optimalgeo.com
  • Lewis Graham: Chair LAS Working Committee; lgraham@geocue.com

Using LiDAR las files in next eCognition version

via Andreas Lang at the Definiens Community

Can we load and process LiDAR las files in Definiens eCognition (Developer or Server) directly?

The new Definiens software will have two ways for handling las files via converting them into rasters directly in the Software:

  • a raster driver for loading and visualizing these kind of images (with an appropriate dialog for setting the resolution for converting the point cloud to a 2D raster) using the driver the user can see the intensity data and select an appropriate subset;
  • an algorithm for converting the existing loaded image layer (las file) into a feasible layer with appropriate data of intensity, elevation, class or number of returns for further processing with much more functionality for filtering:
    • By Return (All/First/All)
    • By Classes
    The user can also select the kind of calculation for a raster cell value (Average, Minimum, Maximum, Median, Most frequently. value).


ASPRS board approves LAS 1.3 specification

The American Society for Photogrammetry and Remote Sensing (ASPRS) is pleased to announce LAS 1.3, a new release of the open file format for lidar data storage and delivery. ASPRS has been maintaining and updating this widely used specification since its inception at the beginning of this decade.

The 1.3 release adds support for waveform encoding of laser returns. The encoding of this new data extension is optional, allowing LAS 1.3 to be used as the specification in normal multi-return delivery products.

“ASPRS has been very proactive in accommodating the rapid advances in LIDAR hardware technology with frequent updates to the LAS specification,” said Jim Plasker, Executive Director of the ASPRS. “This latest update allows lidar system vendors to store waveform information directly in the LAS file. This new capability offers exciting opportunities for developing advanced algorithms for application areas such as urban modeling and forestry. Over 50 hardware vendors, software developers, production companies and commercial/government agencies participated in the development of this latest version of the specification and thus we expect that it will be rapidly adopted for both exploitation and data delivery.”

The LAS version 1.3 specification was approved by the ASPRS Board of Directors on July 14, 2009 and is available for immediate use. The full specification can be downloaded from the ASPRS website at http://www.asprs.org/society/committees/standards/lidar_exchange_format.html

Costs & benefits of lidar

I am collecting information on the costs and benefits of lidar primarily in forest research/management. Since lidar is still in the research phase in many forest applications (although there are some operational aspects to the technology), we get questions about the relative costs of lidar vs. fieldwork. I am collecting information here.

There is more information on the cost-benefits of lidar for topographic mapping and construction. See for example the blog from Merrick. State-wide mapping (e.g. NC), coastal mapping and floodplain mapping clearly see a benefit in increased accuracy and coverage from using lidar over more traditional surveying methods. See an example here from the USGS; Greg Snyder also has some nice graphics in a presentation at ASPRS available here.

For forestry applications, however, there is less information on the relative costs of lidar vs field capture. Tree attributes such as height, dbh (diameter at breast height), height to live crown, species, age, location, basal area, volume, biomass growth and leaf area index have been measured in the field in forest plots for over 100 years. Many of these attributes can be measured directly using LiDAR data, and some can be inferred from lidar data. Stand attributes such as age, trees per hectare, mean diameter and height, dominant height, volume per hectare, form factor, annual increment per hectare and growth have also been estimated from individual plot data for some time. Again many of these can be measured from processed LiDAR data. Accuracy, which is usually estimated by comparing ground data from a series of plots with lidar values, varies with species, density, topography, lidar equipment. For example, in our SNAMP project, preliminary analysis shows r2 of 0.78 for tree height, and 0.65 for dbh. A clear technical advantage of lidar is the ability to completely inventory the forest, instead of collecting a sample of plots that might not be representative of forest heterogeneity. The derived data products that come from lidar can easily be used at multiple scales (and resolutions) as direct inputs to fire models and environmental niche models. The field plot-based approach requires interpolating between these sampled plots to generate a continuous surface.

But as for costs, there are few solid comparisons. The cost of lidar includes aquisition, field data collection, and processing, which includes software and hardware as well as personnel.  These can add up.  Most comparisons of lidar vs. field alone concentrate on the technical advantages highlighted above. One exception is Renslow et al. (2000) who claim that for a typical even-aged, managed forest of 500,000 acres where in each year, 2% of 10,000 acres (200 acres) are sampled to determine what management steps are needed, cost savings with lidar would be $15,400 annually.  I think this is overly optimistic, as it only includes 2 weeks for analysis.  Our SNAMP analysis (albeit over a much larger area) takes considerably longer.

So, in proto-conclusion, I think the advantage of lidar is clearly in its accuracy and coverage, and these outweigh any cost savings that a fast and cheap field campaign might provide.  Still, I will come back to this topic later with more analysis from our SNAMP project.


Mapping virtual trees and buildings

From a series of news releases (all text, no pics, alas): UK aerial survey specialist Bluesky has launched a brand new digital map layer accurately modelling the location and extent of trees and their proximity to buildings. Designed as a tool to aid insurance assessors, property developers and Local Authority Planners, ProximiTREE details the exact spatial location and height of individual trees together with the circumference of its canopy. From this information a determination can be made of the root extent and the potential impact on either existing or proposed properties.

They plug this product for its use in avoiding building subsidence, but in fire-prone Cali, we could use it to look at defensible space and risk.

They also provide a range of good downloads, including sample data and software for your enjoyment.

Lidar web resources

As a lead-up to this week's SNAMP Spatial Team Workshops on our LiDAR data, I am collecting the great web resources for LiDAR here.

LiDAR and 3″-4″ ortho files of Contra Costa County available!

I went to the Contra Costa Countywide GIS meeting yesterday and found out about these countywide files that were recently posted to the Casil FTP site in the coco-county folder. Infrared imagery is expected to be posted by January 2009. The LiDAR was flown for flood control analysis, but it is publicly available for any other research. The county GIS deptartment asks that you contact them to share how you work with the data. Also, I came across this LiDAR resources site with links to other data and helpful info.

Radiohead uses LiDAR in latest music video

No cameras or lights were used. Instead two technologies were used to capture 3D images: Geometric Informatics and Velodyne LIDAR. Geometric Informatics scanning systems produce structured light to capture 3D images at close proximity, while a Velodyne Lidar system that uses multiple lasers is used to capture large environments such as landscapes. In this video, 64 lasers rotating and shooting in a 360 degree radius 900 times per minute produced all the exterior scenes. And here's the 'making of' video: