Landscape as palimpsest

I am reading a fascinating book this January (xmas gift from the parents) by Jonathan Raban called Driving Home: An American Journey. He is a wonderful writer, and in the introduction he discusses his love of reading, travel and landscapes. He puts all of these into a kind of analytical framework, and discusses how one can observe and consider writing, language, and landscapes as a way to better understand people, context, place and history. Consider this marvelous paragraph:

Trying to understand the habitat in which we live requires an ability to read it - and not just in a loose metaphorical sense. Every inhabited landscape is a palimpsest (this is me now: what an awesome word! see below for definition), its original parchment nearly blackened with the cross-hatching of successive generations of authors, claiming this place as their own and imposing their designs on it, as if their temporary interpretations would stand forever. Later overwriting has obscured all but a few, incompletely erased fragments of the earliest entries on the land, but one can still pick out a phrase here, a word there, and see how the most recently dried layer is already being partially effased with fresh ink.

From wikipedia: A palimpsest is a manuscript page from a scroll or book from which the text has been scraped off and which can be used again. I had not heard of its used as a metaphor for a landscape before, but I like it!
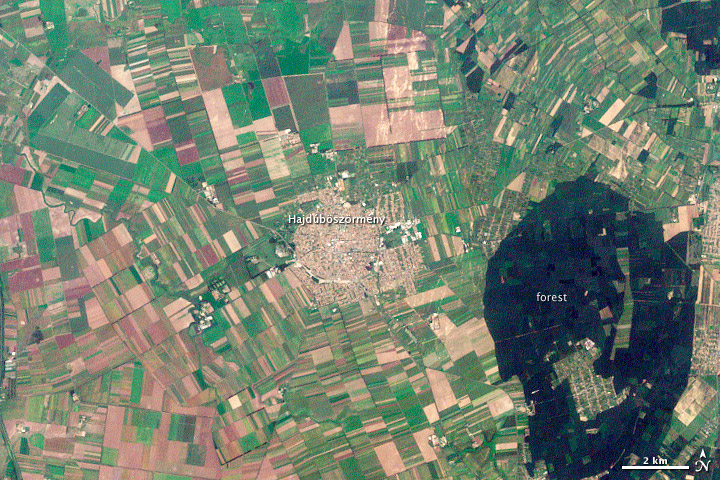
Hajdúböszörmény, Hungary. LandsatYesterday this NASA image post came across my screen as a fitting example of what Raban is talking about. In the  text that accompanies the image, they say "The history of Hajdúböszörmény, Hungary, echoes across its name and over its outline on the land." They go on to discuss the derivation of its name, which echoes past conflicts and local economy, and show how its history is written on the land, in layers of land use. 

"The city is round, a shape easily defended on the flat North Pannonian Plain in northeastern Hungary. The livestock-based economy may also play a role in the shape of the city. The center is densely built, a concentrated ellipse of tan and white. Surrounding the center is a slightly less dense circle, marked by diagonal roads, which held stockyards and gardens. Even today, tiny spots of green indicate that this area contains more open garden space than the city center."

Hooray for geography, landscape history and remote sensing. All fascinating subjects to study. And, I recently found this blogpost from Tim DeChant, former grad student and honorary geographer, in which he describes "ghosts of geography".

The new CA district map challenged in court: maps matter

From KQED, reported this morning. The California Supreme Court today is hearing oral arguments in the case of Vandermost v. Bowen, a rather complicated case related to the redistricting lines that the California Citizens Redistricting Commission drew last year, and which the state Republican Party is none too happy about.

Because the supporters of this referendum (and a lawsuit challenging the maps as well) contend that the law now says the disputed state senate maps drawn by the independent commission cannot be used in 2012 if they're being challenged with a ballot referendum. They say the state Supreme Court would have to step in and draw their own maps.

The defendants in the case are the CA Secretary of State through the attorney general's office. Their case is that the court does not have to step in and draw new temporary maps for the state senate.

This is really a fight over who draws political districts in California: the independent citizens commission, or temporary districts drawn by the California Supreme Court, or possibly even use the old districts, which have existed for the last 10 years.

cesaria evora: 1941-2011

cape verde islands from ENVISATSinger Cesaria Evora, dubbed the "Barefoot Diva" for often performing without shoes, has died in her native Cape Verde at the age of 70.

I was able to see her on two separate occasions at the Zellerbach here on the Berkeley campus. She was truly amazing: commanding our undivided attention as she worked the stage with a large tight band and horn section, and the legendary bare feet and cigarettes.

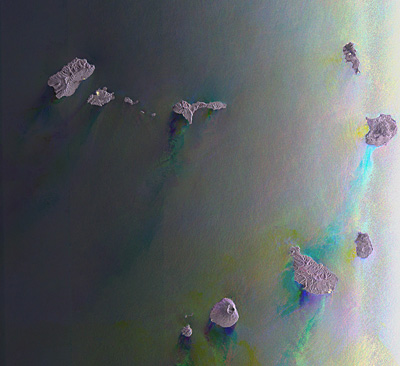
This Envisat image captures her home, the Republic of Cape Verde, a group of volcanic islands located in the North Atlantic Ocean some 600 km off Africa’s west coast.
 
The archipelago comprises 10 islands and several islets and has a total land area of about 4000 sq km. Islands visible from top left to right are Santo Antão, São Vicente, Santa Luzia, São Nicolau, Sal, Boa Vista, Maio, Santiago, Fogo and Brava.

Artisan basemap sandwich - a great name for a band, and a new basemap from ESRI

An example from southern caliEver admired those lovely muted gray maps from NYTimes and elsewhere that are in vogue now? Subtle, calming, with great figure to ground contrast? Canvases on which your data can pop? I know I have. Now ESRI cartographers add these options to their basemap collection. Read more about it in these posts:

Esri Canvas Maps Part I: Author Beautiful Web Maps With Our New Artisan Basemap Sandwich, and Esri Canvas Maps Part II: Using the Light Gray Canvas Map effectively.

From Greeninfo Network.

The evolving privacy debate: Jeffrey Rosen on Fresh Air

Last month in GIS class we had a lively discussion about GIS and privacy. We discussed the idea that while privacy is defined differently in social and legal domains, usually with legal frameworks being a more reactive than prescriptive, at least in the US. But legal and social norms are increasingly shaped by technology: facebook and the like might be pushing the bounds on what is socially acceptable to reveal about yourself, lowering our tolerance for invasions of privacy; smaller GPS make it easier for the police to surveil suspects. Anyway, in a Fresh Air great show, George Washington University law professor Jeffrey Rosen, the co-editor of the new book Constitution 3.0: Freedom and Technological Change, details how technological changes that were unimaginable at the time of the Founding Fathers are challenging our notions of things like personal vs. private space, freedom of speech and our own individual autonomy. It is a fascinating interview:

http://www.npr.org/2011/11/30/142714568/interpreting-the-constitution-in-the-digital-era

forests to faucets: cool new tool from the forest service

The US Forest Service has released their "forest to faucet" program last week. It looks at the importance of forests to surface water. Built in ArcGIS server, it quickly maps, by watershed:

  • Surface Drinking Water Importance Index   
  • Index of Forest Importance to Surface Drinking Water   
  • Index of insect and disease threat to forests important to surface drinking water   
  • Index of development threat to forests important to surface drinking water
  • Index of wildland fire threat to forests important to surface drinking water

Check it out: http://www.fs.fed.us/ecosystemservices/FS_Efforts/forests2faucets.shtml

Wetland restoration reduces sea level rise impacts over next 100 years in the SF Bay

sun setting on bay marshA new study led by Diana Stralberg at PRBO Conservation Science and including work done by our own Lisa Schile, projects a bleak future for San Francisco Bay’s tidal marshes under high-end sea-level rise scenarios that are increasingly likely. PRBO and colleagues found that in the worst case scenario 93% of San Francisco Bay's tidal marsh could be lost in the next 50-100 years (with 5.4 feet or 1.65 meters of sea-level rise, low sediment availability and no significant restoration). Not all marshes will be lost and restoration currently underway can keep more marshes intact as sea levels rise.

"Tidal marshes are incredibly resilient to changes in sea level, depending on how fast seas rise and how much sediment is available.  Unfortunately, marshes cannot keep up with the high-end sea-level rise predictions on their own.  They will need our help.” said Diana Stralberg, the study lead author of PRBO and the University of Alberta.

Our study was published this week in the high-impact journal PLoS ONE. To view maps of where the marshes will be under various scenarios over the next 100 years, visit www.prbo.org/sfbayslr. News coverage from SF Chronicle here. CNR coverage here.

A wrap-up of the news surrounding Supreme Court's foray into GPS + privacy

United States vs. Jones raises questions about the limits of police searches, personal privacy and the use of new technology in law enforcement. At issue is whether police need warrants to attach GPS tracking devices to a cars to monitor suspects' movements for indefinite periods of time.

Stay tuned for more analysis. From NPR, some indication that the Supreme Court was not happy with un-warranted GPS tracking. The justices were told police could slap GPS devices on their cars and track their movements, without asking a judge for advance approval.

Also an interesting take from Wired: A number of Supreme Court justices invoked the specter of Big Brother while hearing arguments Tuesday over whether the police may secretly attach GPS devices on Americans’ cars without getting a probable-cause warrant.

While many justices said the concept was unsettling, the high court gave no clear indication on how it will rule in what is arguably one of the biggest Fourth Amendment cases in the computer age. The Obama administration maintains that Americans have no privacy rights when it comes to their movements in public.

Another informative opinion piece from the Washington Post.

Google acquires facial recognition technology company

Missed this earlier, but found it in prep for my privacy and GIS lecture. The article is excerpted here:

Google has acquired a seven-year-old company that develops facial-recognition technology for images and video, though the Web-search giant didn’t say what it plans to do with it.

Regarding face recognition, the spokesman said, “We’ve said that we won’t add face recognition to our apps or product features unless we have strong privacy protections in place, and that’s still the case.”

Google has said it built facial recognition technology for smartphones into a product known as Google Goggles, but withheld it. “As far as I know, it’s the only technology that Google built and after looking at it, we decided to stop,” said Google Chairman Eric Schmidt last month at a conference. “People could use this stuff in a very, very bad way as well as in a good way.”

Google Goggles is pretty sweet, by the way.

Google Maps to charge for heavy usage

Trick or Treat! Looks like users of Google Map links for their websites will be charged for heavy usage of the service. This from the BBC:

From 1 January 2012, Google will charge for the Google Maps API service when more than the limit of 25,000 map "hits" are made in a day. Websites, especially travel firms, use Google Maps to link customers to a view of the destinations they inquire about.

Cal-Adapt featured on SmartPlanet

Smartplanet recently produced a video featuring Cal-Adapt.  See it here!

At UC Berkeley's Geospatial Innovation Facility software developers are building a Web-based mapping tool to help scientists prepare for the changing climate conditions in California. The team has culled data from various climate research organizations to get projection data of what different climates might look like over a 150-year period. SmartPlanet visits the lab to see a demo of how the tool works.

3D Street level mapping with earthmine


earthmine's Anthony Fassero visited yesterday to give a Geolunch presentation and blew us away with the amazing technology that they are employing!  Anthony, and Co-Founder John Ristevski started earthmine just a few years ago after graduating from Cal. 

earthmine has developed the camera system and engineering to take high resolution 3d street level images using only photogrammetric techniques (no lidar), as well as software tools that allow users to work with the data directly in ArcGIS and other geospatial applications. These tools allow you to not only view the data alongside a map, but to actualy make 3d measurements one the fly and edit ancillary data layers from within the phot view.

You have to see it for yourself!  Check out this video to see teh data and tools in action.

Berkeley Earthquake Visualized Through Tweets

Eric Fischer created a set of interesting animations that visualize the location and number of tweets related to the two earthquakes in Berkeley yesterday (afternoon and evening) over 12 minutes. This is technically measuring the level of discussion about the earthquakes. The animations where created with data from the Twitter streaming API.

Click here to view the video.

The left animation shows tweets about the afternoon earthquake and the right shows tweets about the evening earthquake. Green circles are tweets about the earthquakes and gray circles are tweets about everything else.

Here is one he made for the Virginia quake in August: Video.


GeoData @ Berkeley: find your Cali data here!

Search & find GIS data

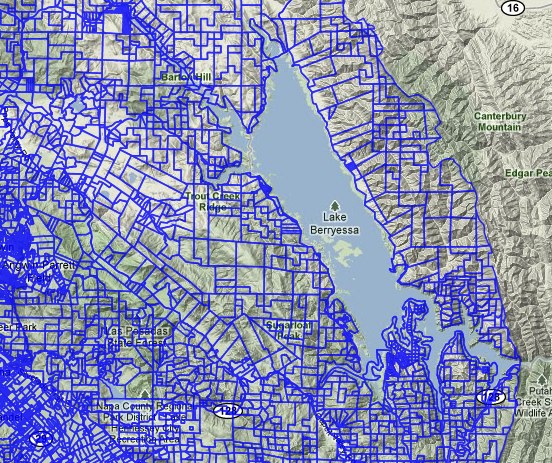
GeoData@UC Berkeley: is the UC Berkeley Libraries' geoportal where users can search, preview, display, map, and download geospatial data in a variety of formats.

The Earth Sciences & Map Library collects GIS data for areas around the world, with an emphasis on the nine county San Francisco Bay Area and northern California, and makes it available for use on the GIS workstations. Library users can download freely available data to use in their projects. The library also collects licensed GIS data that is accessible by library users who are affiliated with UC Berkeley.

This example at left is a snapshot of Napa County parcel data.

http://gis.lib.berkeley.edu:8080/openGeoPortalHome.jsp

New and improved ASTER GDEM released

NASA and Japan’s Ministry of Economy, Trade and Industry released yesterday a new and improved version of their ASTER global digital elevation model (GDEM) which was first released in 2009. This new and improved version offers improved spatial resolution, horizontal and vertical accuracies, and more realistic coverage over water bodies with the ability to identify water bodies as small as 1 km in diameter. This new data is now comparable to NASA's Shuttle Radar Topography Mission DEM data. The new ASTER GDEM covers 99 percent of the Earth’s landmass at 30 meter spatial resolution. It is free to download here. For information on the improved version see here and here.

ASTER DEM of Grand Canyon National Park in northern Arizona July 14, 2011 from space.com. Credit: NASA/GSFC/METI/ERSDAC/JAROS, and U.S./Japan ASTER Science Team

To map or not to map

A recent post by Matt Ericson from the New York Times on the importance of knowing when to map geographic data and when not to. He states that we are sometimes too quick to map geographic data. In some cases a chart or table can better represent geographic information and tell a more effective story. In some cases there are no better alternatives than to map geographic data. The important thing is to remember that there are multiple avenues of presenting geographic data in which a map may or may not always be the best form to convey data and ideas. In the post he also provides examples of some cases he has run in to where a map and where a table has provided a more effective means of geographic data presentation.

See the full post here.

Cal-adapt in the news: sea level rise needs to be considered in planning

The Bay Conservation and Development Commission (BCDC) recently voted on the planning process in the bay area. They approved a first-of-its kind policy that makes sea level rise part of regional planning decisions. The new rules require developers to plan for rising sea levels in their proposals for waterfront property. Business groups and cities cried foul when the policy was first released, saying it would hurt economic development. The KQED News post features our Cal-Adapt site. More here.

India-Pakistan border as seen from space

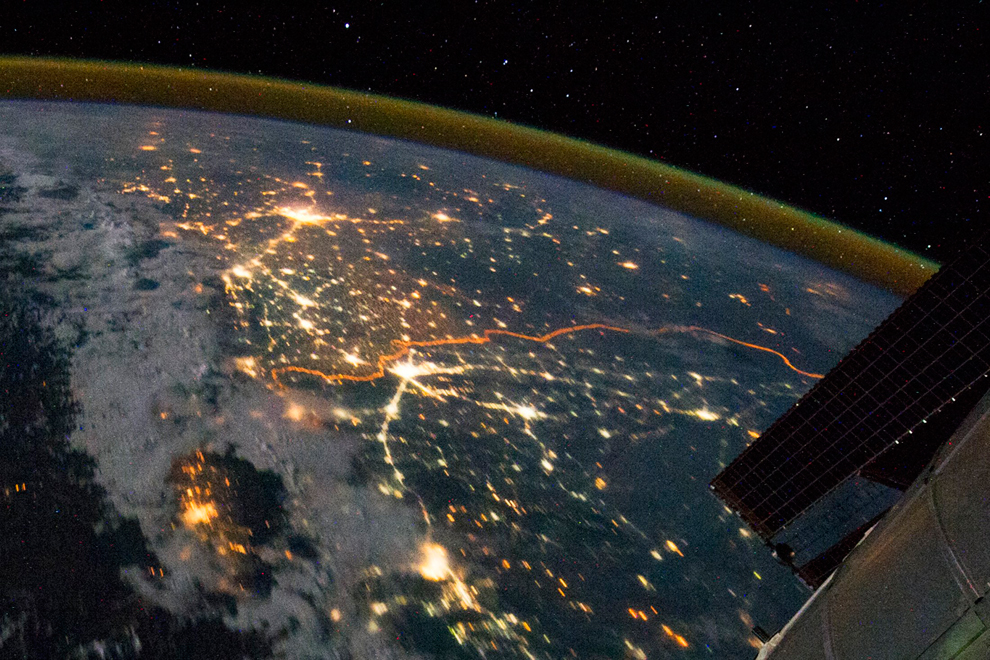
From NASA re-posted via Bostom.com's The Big Picture photojournalist website comes this fascinating, geographically-pertinent image: "The India-Pakistan border appears as an orange line in this photograph taken by the Expedition 28 crew on the International Space Station on August 21, 2011. The fence between the two countries is floodlit for surveillance purposes. Srinagar (left), Islamabad (bottom center), Lahore (center near the border line) and Delhi (top center) can be seen as brighter spots. (NASA/Handout/Reuters)#"

Privacy and the web

An interesting article about the use of social-media, such as facebook, for employment background checks.

The article points out that "some companies are mining photo- and video-gathering sites using facial-recognition software" so a person could still be identified by potential employers in seemingly anonymous photos.

http://www.marketwatch.com/story/could-you-pass-a-facebook-background-check-2011-07-25