Artisan basemap sandwich - a great name for a band, and a new basemap from ESRI
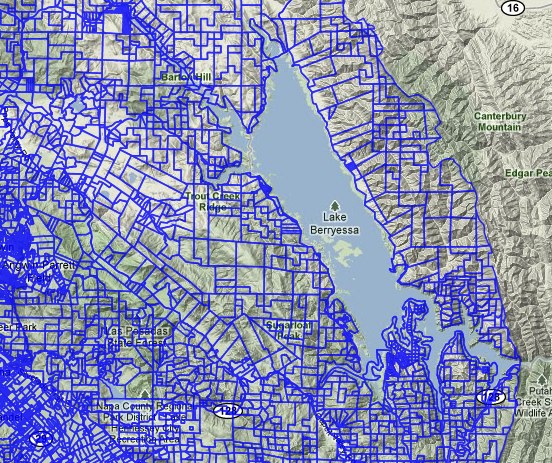
An example from southern caliEver admired those lovely muted gray maps from NYTimes and elsewhere that are in vogue now? Subtle, calming, with great figure to ground contrast? Canvases on which your data can pop? I know I have. Now ESRI cartographers add these options to their basemap collection. Read more about it in these posts:

Esri Canvas Maps Part I: Author Beautiful Web Maps With Our New Artisan Basemap Sandwich, and Esri Canvas Maps Part II: Using the Light Gray Canvas Map effectively.

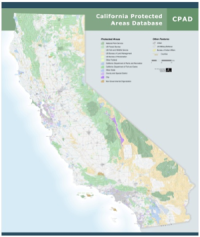
From Greeninfo Network.

Cal-Adapt featured on SmartPlanet

Smartplanet recently produced a video featuring Cal-Adapt.  See it here!

At UC Berkeley's Geospatial Innovation Facility software developers are building a Web-based mapping tool to help scientists prepare for the changing climate conditions in California. The team has culled data from various climate research organizations to get projection data of what different climates might look like over a 150-year period. SmartPlanet visits the lab to see a demo of how the tool works.

3D Street level mapping with earthmine


earthmine's Anthony Fassero visited yesterday to give a Geolunch presentation and blew us away with the amazing technology that they are employing!  Anthony, and Co-Founder John Ristevski started earthmine just a few years ago after graduating from Cal. 

earthmine has developed the camera system and engineering to take high resolution 3d street level images using only photogrammetric techniques (no lidar), as well as software tools that allow users to work with the data directly in ArcGIS and other geospatial applications. These tools allow you to not only view the data alongside a map, but to actualy make 3d measurements one the fly and edit ancillary data layers from within the phot view.

You have to see it for yourself!  Check out this video to see teh data and tools in action.

GeoData @ Berkeley: find your Cali data here!

Search & find GIS data

GeoData@UC Berkeley: is the UC Berkeley Libraries' geoportal where users can search, preview, display, map, and download geospatial data in a variety of formats.

The Earth Sciences & Map Library collects GIS data for areas around the world, with an emphasis on the nine county San Francisco Bay Area and northern California, and makes it available for use on the GIS workstations. Library users can download freely available data to use in their projects. The library also collects licensed GIS data that is accessible by library users who are affiliated with UC Berkeley.

This example at left is a snapshot of Napa County parcel data.

http://gis.lib.berkeley.edu:8080/openGeoPortalHome.jsp

New and improved ASTER GDEM released

NASA and Japan’s Ministry of Economy, Trade and Industry released yesterday a new and improved version of their ASTER global digital elevation model (GDEM) which was first released in 2009. This new and improved version offers improved spatial resolution, horizontal and vertical accuracies, and more realistic coverage over water bodies with the ability to identify water bodies as small as 1 km in diameter. This new data is now comparable to NASA's Shuttle Radar Topography Mission DEM data. The new ASTER GDEM covers 99 percent of the Earth’s landmass at 30 meter spatial resolution. It is free to download here. For information on the improved version see here and here.

ASTER DEM of Grand Canyon National Park in northern Arizona July 14, 2011 from space.com. Credit: NASA/GSFC/METI/ERSDAC/JAROS, and U.S./Japan ASTER Science Team

Wetland Tracker site, updated with new wetland data

Berkeley close up: orange are planned wetland restoration sites; yellow lines are impacted streams, blue lines are natural streams.SFEI's Wetland Tracker site has been updated with new wetland data. Specifically, the site makes available BAARI data. BAARI - the Bay Area Aquatic Resource Inventory - is a detailed base map of the Bay Area's aquatic features that includes all wetlands, open water, streams, ditches, tidal marshes and flats, and riparian
areas. The BAARI data will be used to track changes in the extent and condition of aquatic habitat, aid in ecological sample drawing, and is featured on the California Wetlands Portal, where users can browse the area's
aquatic features and restoration projects on an interactive map.

Tracking apex marine predator movements in a dynamic ocean

From a new Nature article focusing on the tracking of marin predators in the Pacific. What a cool graphic!

a, Daily mean position estimates (circles) and annual median deployment locations (white squares) of all tagged species. b, Daily mean position estimates of the major TOPP guilds (from left): tunas (yellowfin, bluefin and albacore), pinnipeds (northern elephant seals, California sea lions and northern fur seals), sharks (salmon, white, blue, common thresher and mako), seabirds (Laysan and black-footed albatrosses and sooty shearwaters), sea turtles (leatherback and loggerhead) and cetaceans (blue, fin, sperm and humpback whales).

California Protected Areas Database (CPAD) 1.6 released

From Greeninfo Network: Announcing the release of California Protected Areas Database (CPAD) 1.6 - you can download it at www.calands.org.  Released concurrently is MapCollaborator, our new mapping wiki which available here http://bit.ly/hjbEwg. Mapcollaborator is a great new web interface for crowdsourcing data review and improvement. Check it out and start providing your edits and input today!

And, we now have a CPAD e-newsletter!  If you would like to receive quarterly updates about CPAD, go to www.calands.org and click on the “Sign up for Updates” button on the right.

Google Earth Engine Debuted at the International Climate Change Conference in Cancun, Mexico

Google.org introduced a new Google Labs product called Google Earth Engine at the International Climate Change Conference in Cancun, Mexico. Google Earth Engine is a new technology platform that puts petabytes of satellite imagery and data from the past 25 years online, many of which have never been seen, much less analyzed. The platform will enable scientists around the world to use Google’s cloud computing infrastructure to implement their applications. For example, creating a detailed forest cover and water map of Mexico, a task that would have taken 3 years on one computer, was accomplished in less than a day.

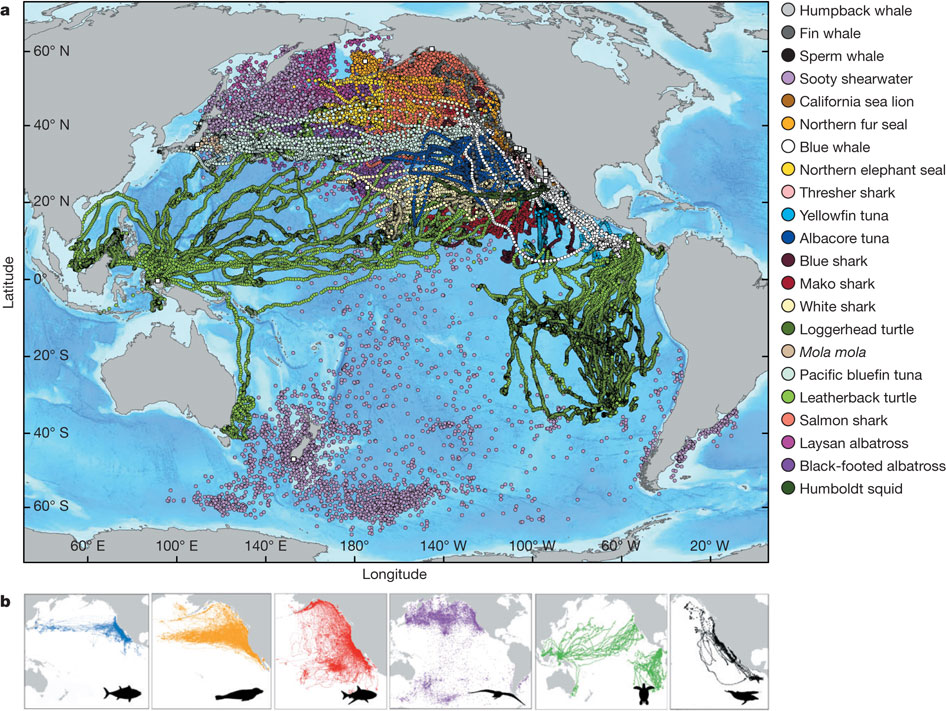
Google Earth Engine can help scientists track and analyze changes in Earth’s environment  and can be used for a wide range of applications—from mapping and monitoring water resources to ecosystem services to deforestation. The idea is to enable global-scale monitoring and measurement of changes in the earth’s environment by providing scientists a vast new amount of data and powerful computing resources.

Read more at Introducing Google Earth Engine or watch Google Earth Engine Overview videos.

TanDEM-X and TerraSAR-X set to create global DEM by 2014 at 12 m spatial resolution

German based TanDEM-X and TerraSAR-X satellites, launched in 2007 and 2010 respectively, begin their tandem orbit flight to create a new global DEM product of the Earth's surface to be available in 2014.

The TanDEM mission seeks to produce a global DEM at 12 meter sp

atial resolution with a relative vertical accuracy of less than two meters. With this kind of specification "'the TanDEM dataset will replace SRTM'". The US Shuttle Radar Topography Mission (SRTM) of 2000 is one of the best-known, near-global, space-borne DEM prior to TanDEM. Its best product has a 30 meter spatial resolution, and a vertical accuracy that varies from 16m to 10m.

Airborne laser instruments such as Lidar can achieve finer spatial resolution and vertical accuracy but their products are regional - they are not seamless maps of the whole Earth as TanDEM will be able to achieve. For more read the full story here.

USGS seeks input for new carbon accounting plan

A draft methodology is proposed in response to requirements by the Energy Independence and Security Act of 2007 to assess ecosystems for carbon stocks, carbon sequestration, and greenhouse-gas fluxes. The assessment will be conducted to estimate capacities of ecosystems to increase carbon sequestration and reduce greenhouse-gas fluxes, in contexts of land-use, land-cover, and land-management scenarios as well as other controlling processes, such as climate change and wildland fires. Results of the assessment will be useful for evaluating a range of choices for formulating mitigation strategies and other land management policies.

Global 12m DEM with TanDEM-X satellite

Comparison between SRTM and TanDEM-XFrom the BBC: The TanDEM-X satellite has blasted into orbit on a mission to acquire the most precise 3D map of the Earth's surface.

The German radar spacecraft will fly in formation with an identical platform called TerraSAR-X launched in 2007.  Together, the pair will measure the variation in height across the globe to an accuracy of better than two metres.

With the TanDEM mission, the intention is to go down to a vertical resolution of two metres, with a spatial resolution of 12m by 12m. Airborne laser instruments (lidars) can do better than this but their DEMs are only regional. To achieve the TanDEM level of detail on all 150 million sq km of the Earth's land surface will require three years of operation.

California Protected Areas Database (CPAD 1.5) released

The new California Protected Areas Database (CPAD 1.5) has just been released in geodatabase and shape file formats.  Please visit www.calands.org to download.  Updates and improvements to CPAD are described in the CPAD Manual also available on the CALands web site.

WHAT'S NEW IN CPAD 1.5: CPAD 1.5 includes many updates and corrections to federal and state lands in the Sierra Nevada region, as well as a thorough review of the San Joaquin Valley and Bay Area.  CPAD data is better aligned to parcels, and we have more accurately captured managing agencies.  Urban parks data has generally been significantly improved in CPAD 1.5, with many missing parks now included and boundaries and attributes made more accurate.

VIEW CPAD DATA ONLINE, REPORT ISSUES: For those who do not use GIS or prefer to view CPAD via the web, you can do so though a google map overlay at http://www.calands.org/review.php.  We welcome input from the CPAD user community to keep us informed about errors and updates in CPAD.  Please report errors by clicking on the "Report Error" button.

GET NOTIFIED WHEN CPAD IS UPDATED: We encourage you to receive CPAD updates.  You can do this by clicking on the "Receive Update Notification" link on the calands.org homepage.  We will not distribute any of your information or use your email outside of the CPAD mailing list.  Registering helps us better serve the CPAD user community.

NAIP 2009 Color Infrared Released

NAIP Color infrared, June 19, 2009Color Infrared imagery acquired during the summer of 2009 are now available for download from Cal-Atlas.  An index shapefile to identify the location of each image can be downloaded here (ZIP - 727KB).

The National Agriculture Imagery Program (NAIP) is tasked with providing access to high-resolution aerial image data on a state-by-state basis. 

These images are 1 meter resolution, 4 band GeoTIFFs that contain all of the natural color and infrared channels. 

Direct links to all of the California NAIP products are maintained on the GIF's website.  Currently, NAIP data is available for both 2005 and 2009.

California Coastal LiDAR Project (CCLP) to be available later this year

The California Coastal LiDAR Project (CCLP) is a collaborative effort to produce high-resolution topography data from Oregon to Mexico, extending from the shoreline up to the 10 m topographic contour. The U.S. Army Corps of Engineers (USACE) began a coastal aerial LiDAR collection in October 2009 as part of the National Coastal Mapping Program (NCMP). A combined effort by NOAA and USGS was developed in the latter half of 2009 to conduct LiDAR surveys of the San Francisco Bay Area extending from the Carquinez Strait to outside of the Golden Gate. The two projects are expected to be completed by mid-2010. Datasets will become publicly available by the end of 2010.

http://www.opc.ca.gov/webmaster/ftp/pdf/opc_cclp_report_final.pdf

http://www.opc.ca.gov/2010/01/mapping-californias-coastal-areas/

The volunteer mappers who helped Haiti

Using an image slideshow, BBC News tells the story of how volunteer mappers used OpenStreetMap, an open source mapping platform, to construct a detailed map of Port au Prince in Haiti with layers of geographic information. The geographic information was accessed and used by the rescue personel on the ground. This short slideshow highlights the importance of PPGIS/webGIS, mobile GIS, open source/platform, crowdsourcing, and public participation in a critical situation like the rescue effort in Haiti.

To view the slideshow, please click here.

CPAD 1.4 drops today! California Protected Areas Database

From GreenInfo Network.  The new California Protected Areas Database (CPAD 1.4) has just been released in geodatabase and shape file formats.  Please visit www.calands.org to download.  Updates and improvements to CPAD are described in the CPAD Manual also available on the CALands web site.

WHAT'S NEW IN CPAD 1.4:  CPAD 1.4 contains a number of important data improvements - more coverage of urban parks, more complete alignment to parcels, broader implementation of management designations, and more.

VIEW CPAD DATA ONLINE, REPORT ISSUES:  For those who do not use GIS or prefer to view CPAD via the web, you can do so though a google map overlay at http://www.calands.org/review.php.  We welcome input from the CPAD user community to keep us informed about errors and updates in CPAD.  Please report errors by clicking on the "Report Error" button.

GET NOTIFIED WHEN CPAD IS UPDATED: We encourage you to receive CPAD updates.  You can do this by clicking on the "Receive Update Notification" link on the calands.org homepage.  We will not distribute any of your information or use your email outside of the CPAD mailing list.  Registering helps us better serve the CPAD user community.