The video describing the partnership and the product is available now.
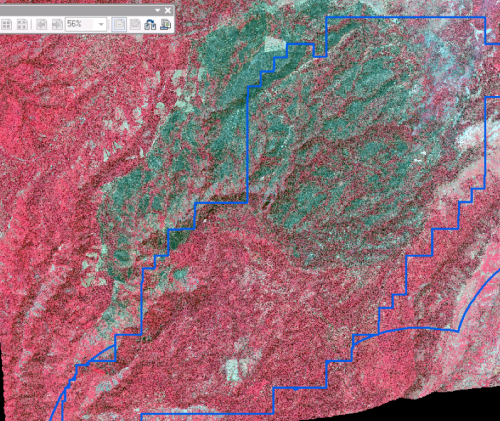
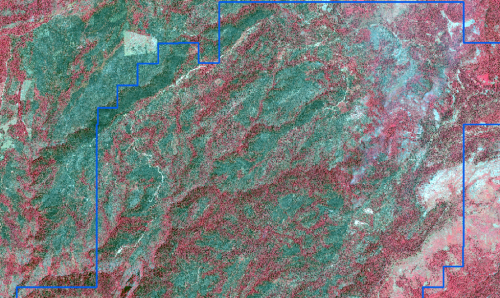
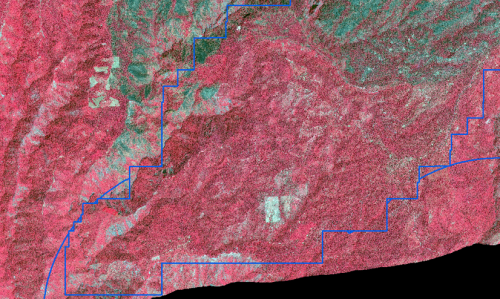
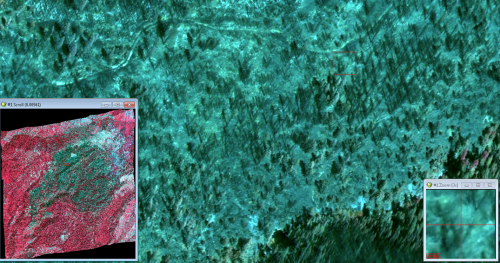
A new high-resolution global map of forest loss and gain has been created with the help of Google Earth. The interactive online tool is publicly available and zooms in to a remarkably high level of local detail - a resolution of 30m. Snapshot of Russia here (green = forest, blue = gain, red = loss):
 Russia has much forest activity
Results from time-series analysis of 654,178 Landsat images from 2000–2012 characterize forest extent and change. Between 2000 and 2012, according to this analysis, the Earth lost a combined "forest" the size of Mongolia. http://www.bbc.co.uk/news/science-environment-24934790
Here is the abstract from the accompanying paper in Science:
Quantification of global forest change has been lacking despite the recognized importance of forest ecosystem services. In this study, Earth observation satellite data were used to map global forest loss (2.3 million square kilometers) and gain (0.8 million square kilometers) from 2000 to 2012 at a spatial resolution of 30 meters. The tropics were the only climate domain to exhibit a trend, with forest loss increasing by 2101 square kilometers per year. Brazil’s well-documented reduction in deforestation was offset by increasing forest loss in Indonesia, Malaysia, Paraguay, Bolivia, Zambia, Angola, and elsewhere. Intensive forestry practiced within subtropical forests resulted in the highest rates of forest change globally. Boreal forest loss due largely to fire and forestry was second to that in the tropics in absolute and proportional terms. These results depict a globally consistent and locally relevant record of forest change.
Hansen, M.C.; Potapov, P.V.; Moore, R.; Hancher, M.; Turubanova, S.A.; Tyukavina, A.; Thau, D.; Stehman, S.V.; Goetz, S.J.; Loveland, T.R.; Kommareddy, A.; Egorov, A.; Chini, L.; Justice, C.O.; Townshend, J.R.G. High-Resolution Global Maps of 21st-Century Forest Cover Change. Science 2013, 342, 850-853
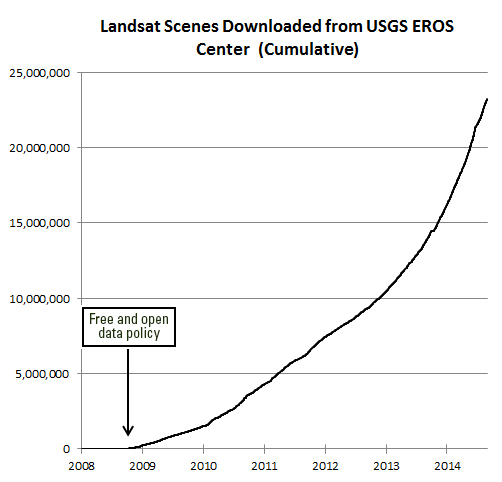 Undersanding the value of Landsat program to the U.S. economy has been the ambitious goal of the Landsat Advisory Group of the National Geospatial Advisory Committee. This team of commercial, state/local government, and NGO geospatial information experts recently updated a critical review of the value of Landsat information that has recently been released to the public.
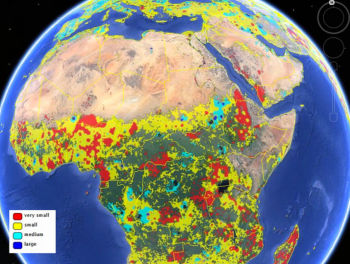


