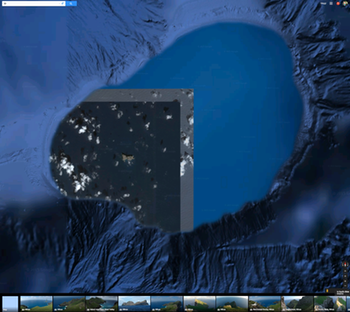
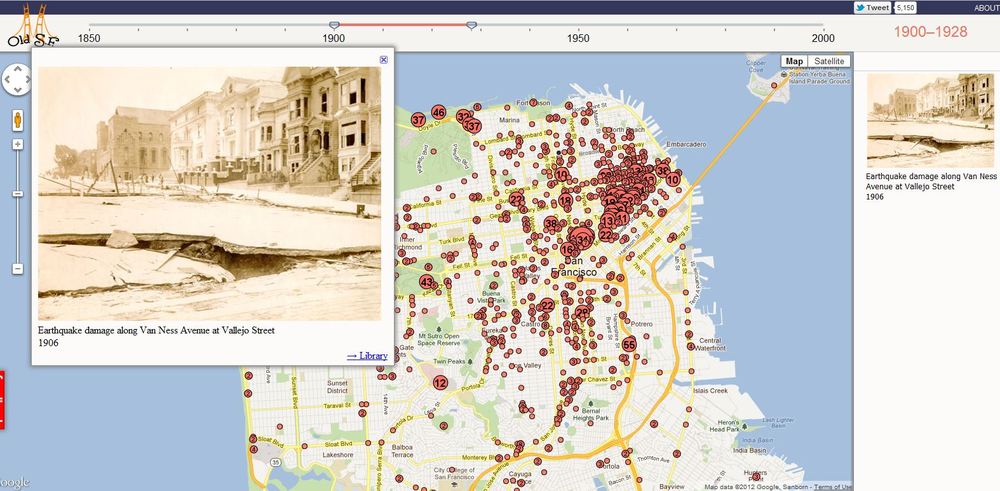
National Park moved 150 miles to the east to take up role as urban escape

Here is a funny response to a major map error on Google Maps, found last month. From BBC Wales: http://www.bbc.com/news/uk-wales-mid-wales-34410736

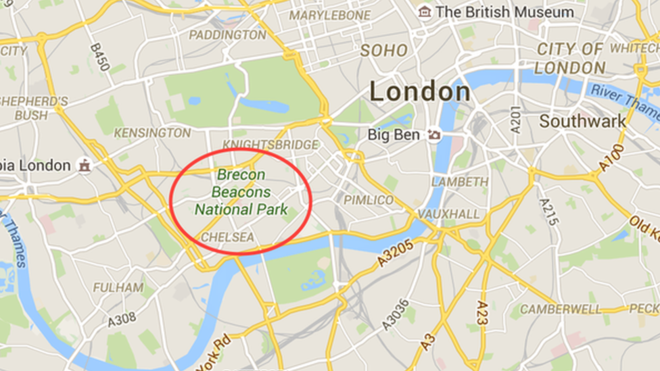
The gorgeous Brecon Beacons was erroneously positioned outside of downtown London. The technical error has directed people searching for the national park more than 150m (241km) away to a location between Chelsea and Knightsbridge.

Brecon Beacons National Park Authority posted the image online with the caption: "We have now moved. Londoners get an upgrade thanks to Google Maps."

Chief executive John Cook joked: "Well the move has come as a bit of a shock to us all."

He added: "I'm sure it will come as good news to Londoners who want some fresh mountain air on their doorstep.

"The truth is we are only three hours away from London - don't rely on your sat-nav or Google Maps - just head to Bristol on the M4, cross the bridge, ask a local and they'll know exactly where to find us."

Hilarious response. I've been walking on the Beacons exactly once, and it was divine. 

2005-2015: A decade of intense innovation in mapping

The GIF began in November 2015 on a wave of excitement around geospatial technology. In the months leading up to our first GIS Day in 2005, Google Maps launched, then went mobile; Google Earth launched in the summer; and NASA Blue Marble arrived. Hurricane Katrina changed the way we map disasters in real time. The opening up of the Landsat archive at no-cost by the USGS revolutionized how we can monitor the Earth's surface by allowing dense time-series analysis. These and other developments made viewing our world with detail, ease, and beauty commonplace, but these were nothing short of revolutionary - spurring new developments in science, governance and business. The decade since then has been one of intense innovation, and we have seen a rush in geospatial technologies that have enriched our lives immeasurably. In November 2015 we can recognize a similar wave of excitement around geospatial technology as we experienced a decade ago, one that is more diverse and far reaching than in 2005. This GIS Day we would like to highlight the societal benefit derived from innovators across academia, non-profits, government, and industry. Our panel discussion on the 18th has representatives from several local innovators in the field, including: Stamen Designs, Geowing, PlanetLabs, 3D Robotics, NASA, iNaturalist.org, and Google, who will discuss their perspectives on the boom in Bay Area mapping. 

Please think about joining us at GIS Day!

http://gif.berkeley.edu/gisday.html

Google Geo for Higher Education Summit 2014


Just got back from an amazing workshop with the Google Earth Outreach Geo Team and 50+ geospatial educators, researchers, and lab managers! 

In between stealing off on the colorful google bikes  and spending time wandering the amazing Google campus, we engaged each other in discussions of integrating Google tools into higher education and learning and attended workshops introducing the plethora of Google mapping tools.

We had a warm welcome from Brian McClendon (VP of Engineering, Geo at Google, mastermind behind Google Earth, and creator of KML) who gave a great history of the program and the creation of Google Geo and gave an exciting announcement that Google; with the acquisition of Skybox is now taking to the sky with their own satellites in hand (contrary to popular belief, Google has not to this point owned any Satellites).  With this acquisition, near-real live time imagery on Google platforms seems to be closer than ever before.

Rebecca Moore (Engineering Manager, Google Earth Outreach and Earth Engine) also gave a great history of the importance of Google Earth and its transformation over the years highlighting a number of exiting things to come and products not yet released to the public including

1. A new MODIS time-lapse!

From Maggi’s blog post last year on timelapse created from LANDSAT imagery we saw the amazing capabilities to see transformations over time with the click of a button. Now Google will soon release MODIS time-lapse which having a quicker repeat interval will be able to show seasonal changes .

Check out this example here showing fires across the world, and more targeted video here! Awesome!

2. Also great news for those of you tired of the coarse resolution SRTM 90 DEM, Google is currently working to produce a much higher resolution global DEM product…stay tuned!

Throughout the 3 days, I had the opportunity to attend a variety of different workshops and came away absolutely jazzed! See below for a summary of the latest and greatest from the Google Geo team with links attached if you’re interested and want more information….. Also stay tuned for some of my renderings and products from the training!

Google’s “Ecosystem” of Technologies

Mapping:

Google Maps Engine (GME): hosting data and publishing maps online, and ability to build applications and connect Google’s data with your own.

GME Pro&Lite: simple map making in the cloud, visualize, draw, import a csv, and style your maps

Maps Gallery: A new way for organizations and public institutions to publish and share their maps online through the Google maps Engine

Google Crisis Map: a map interface initially used for emergency alerts, however it’s not entirely dedicated to crisis as you can easily integrate and create your own map mashup and community awareness map here

Maps Engine API (application program interface): to access Maps Engine data, create a new applications utilizing the data, stylize and create beautiful maps

Analysis

Google Earth Engine: (EE), Google’s geospatial analysis platform. Earth Engine brings together the world's satellite imagery — trillions of scientific measurements dating back almost 40 years — and makes it available online with tools for scientists, independent researchers, and nations to mine this massive warehouse of data to detect changes, map trends and quantify differences on the Earth's surface.

Earth Engine API (application programming interface) provides the ability to create your own algorithms to process raster and vector imagery.

Timelapse builds on Earth Engine to show decades of planetary change, both man-made and natural

Data Collection

Streetview: in Google Maps and Earth provides over five millions miles of interactive 360-degree panoramas across all seven continents; it’s the closest thing to teleportation, allowing teachers and students to virtually walk almost anywhere they dream of going. Street View began on the roads, but new technologies like theTrekker backpack or an underwater rig can take you almost everywhere.

                -Treks: Street view special collections (museums, up a mountain,etc..)

                -Views: streetview imagery crowd-sourced from user generated 360 degree photospheres. You can now connect your photospheres to create your own street view using constellations

Mobile Data Collection using Open Data Kit allows you to collect field data, such as text, photos/videos, and GPS location from an Android device where there's no internet connection and then publish that data to the web when you're back online. You can then export your data into Google Earth Engine for mapping and Google Fusion Tables for graphing, mapping and visualization. 

Visualization/ Story Telling

Tour Builder: Tour Builder is a new way to show people the places you've visited and the experiences you had along the way using Google Earth. It lets you pick the locations right on the map, add in photos, text, and video, and then share your creation. The new geo-enabled Powerpoint!


Thanks to Maggi for the opportunity to attend and the talented, enthusiastic Google Geo staff (including: Karin Tuxen-Bettman, John Bailey, David Thau, Christiaan Adams, and all the other workshop leads and those behind the scenes!) for developing such an action packed workshop!
Workshop wrap up: Google Earth Higher Education Summit 2013

For three days in late July 2013 Kevin Koy, Executive Director of the GIF and Maggi spent time at Google with 50+ other academics and staff to learn about Google Earth's mapping and outreach tools that leverage cloud computing. The meeting was called Google Earth for Higher Education Summit, and it was jam packed with great information and hands-on workshops. Former Kellylabber Karin Tuxen-Bettman was at the helm, with other very helpful staff (including David Thau - who gave the keynote at last year's ASPRS conference). Google Earth Outreach has been targeting non-profits and K-12 education, and are now increasingly working with higher education, hence the summit. We learned about a number of valuable tools for use in classrooms and workshops, a short summary is here.  

Google Mapping Tools - the familiar and the new

  • Google Earth Pro. You all know about this tool, increasing ability to plan, measure and visualize a site, and to make movies and maps and export data.
  • Google Maps Engine Lite. This is a free, lite mapping platform to import, style and embed data. Designed to work with small (100 row) spreadsheets.
  • Google Maps Engine Platform. The scaleable and secure mapping platform for geographic data hosting, data sharing and map making. streamlines the import of GIS data: you can import shapefiles and imagery. http://mapsengine.google.com.
  • Google Earth Engine. Data (40 years of global satellite imagery - Landsat, MODIS, etc.) + methods to analyze (Google's and yours, using python and javascript) + the Cloud make for a fast analytical platform to study a changing earth. http://earthengine.google.org/#intro
  • TimeLapse. A new tool showcasing 29 years of Landsat imagery, allows you to script a tour through a part of the earth to highlight change. Features Landsat 4, 5 7 at 30m, with clouds removed, colors normalized with MODIS. http://earthengine.google.org/
  • Field Mobile Data Collection. GME goes mobile, using Open Data Kit (ODK) - a way to capture structured data and locate it and analyze after home.
  • Google Maps APIs. The way to have more hands-on in map styling and publishing. developers.google.com/maps
  • Street View. They have a car in 32 countries, on 7 continents, and are moving into national parks and protected areas. SV is not just for roads anymore. They use trikes, boats, snowmobiles, trolleys; they go underwater and caves, backpacks.

Here are a couple of my first-cuts:

Google Timelapse

Google recently released the Timelapse project, hosted by Time Magazine, which shows Landsat images from 1984 to today in a timelapse video animation for the entire globe. The viewer allows users to navigate to any spot on the globe via place name and visualize changes on the earth’s surface over the time period captured by Landsat. Google highlights specific areas of interest such as Dubai, Las Vegas, and the Amazon.

Click the image below for more info and to access the site:

Screenshot of Google Timelapse on Time.com

A great week for radio

What a great week for radio and matters geospatial+web. On Wednesday last week we finished out our GIS class with a talk about the geoweb and issues of access, bias, motivation, control, and of course privacy. I used alot of William Gibson's previous writings about Google (posted here earlier) in that lecture. Yesterday TTBOOK re-aired a great interview with Gibson, on the topic of writing, but also about the internet. I recommend it. Additionally, last week Talk of the Nation had a interesting interview with Jerry Brotton about his new book "A History of the World in Twelve Maps"; the interview touched on Google Earth and representation, why north is up, and many other fantastic questions raised through the history of cartography. Check them out!

New software to extract geographically representative images from Google Street View

New software developed by Carnegie Mellon University in Pittsburgh and INRIA in Paris mines the geotagged imagery in Google Street View to uncover what architectural features distinguish one city from another across the globe. The software is based upon a discriminative clustering algorithm to distinguish features in one picture from another. This research shows that geographically representative image elements can be discovered automatically from Google Street View imagery in a discriminative manner.

Jacob Aron from the New Scientist reports:

"The researchers selected 12 cities from across the globe and analysed 10,000 Google Street View images from each. Their algorithm searches for visual features that appear often in one location but infrequently elsewhere...It turns out that ornate windows and balconies, along with unique blue-and-green street signs, characterise Paris, while columned doorways, Victorian windows and cast-iron railings mark London out from the rest. In the US, long staircases and bay windows mean San Francisco, and gas-powered street lamps are scattered throughout Boston."

"The discovered visual elements can also support a variety of computational geography tasks, such as mapping architectural correspondences and influences within and across cities, finding representative elements at different geo-spatial scales, and geographically-informed image retrieval."

Read the full story by clicking here.

To read the research paper and view the project website click here.

Tim De Chant explains why you should be excited about vector-based maps in iOS 6

Former kellylabber Tim De Chant has a nice piece on the upcoming apple mapping software for mobile devices:

Apple announced today that it’s revamping the Maps application on iOS devices—iPhone, iPad, iPod touch—introducing a lot of showy new features like turn-by-turn directions and 3D flyovers. While those make for sexy commercials, they won’t be as impactful as the switch from raster- to vector-based map data. If you’re not sure why you should be excited about the change—and you should be—read on.

Check out his blog post here.


Jonathan Crowe (formerly of The Map Room, now of "My Correct Views on Everything") has a comprehensive post on the subject here.

Apple mobile mapping software? coming soon!

We mac users are all a-twitter about the news of an impending Apple mapping software. Here is a sample from NPR:

There's been speculation for months that Apple will try to elbow Google's popular Maps app aside on the iPhone and unveil its own map app, and some of the best evidence yet comes from Tuesday's Wall Street Journal.  The paper looked into the reasons for the impending switch and the broader implications it would have for the smartphone market.  The article continues...

The new software is rumored to be leaner, meaner, and packing a rad 3D visualization capability. It will be unveiled as soon as next week at the annual Apple developer conference in San Francisco.

Google acquires facial recognition technology company

Missed this earlier, but found it in prep for my privacy and GIS lecture. The article is excerpted here:

Google has acquired a seven-year-old company that develops facial-recognition technology for images and video, though the Web-search giant didn’t say what it plans to do with it.

Regarding face recognition, the spokesman said, “We’ve said that we won’t add face recognition to our apps or product features unless we have strong privacy protections in place, and that’s still the case.”

Google has said it built facial recognition technology for smartphones into a product known as Google Goggles, but withheld it. “As far as I know, it’s the only technology that Google built and after looking at it, we decided to stop,” said Google Chairman Eric Schmidt last month at a conference. “People could use this stuff in a very, very bad way as well as in a good way.”

Google Goggles is pretty sweet, by the way.

Google Maps to charge for heavy usage

Trick or Treat! Looks like users of Google Map links for their websites will be charged for heavy usage of the service. This from the BBC:

From 1 January 2012, Google will charge for the Google Maps API service when more than the limit of 25,000 map "hits" are made in a day. Websites, especially travel firms, use Google Maps to link customers to a view of the destinations they inquire about.

Cal-Adapt featured on SmartPlanet

Smartplanet recently produced a video featuring Cal-Adapt.  See it here!

At UC Berkeley's Geospatial Innovation Facility software developers are building a Web-based mapping tool to help scientists prepare for the changing climate conditions in California. The team has culled data from various climate research organizations to get projection data of what different climates might look like over a 150-year period. SmartPlanet visits the lab to see a demo of how the tool works.

UrbanFood.org released

This new internet map site from Nathan McClintock shows both existing urban gardens and vacant or open spaces in Oakland, CA where food could potentially be produced. Publicly owned land with productive potential totals 1,201 acres while private vacant land totals 848 acres. Food production at these sites could potentially produce as much as 15 to 20 percent of Oakland’s fruit and vegetable needs. Read the report on the website for details. This is such a great resource, and beautifully designed.

New Google SketchUp plug-in integrates 3D laser scan data

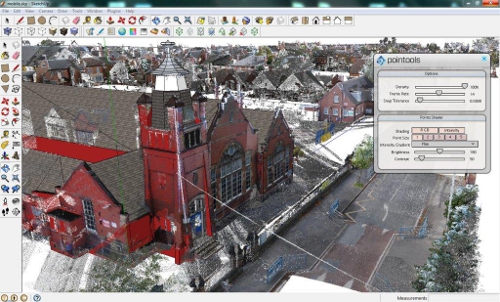
Pointools has just announced the availability of a new plug-in for Google SketchUp to be released in a few weeks. This new plug-in will make it easy to visualize and use point cloud data from sources such as mobile ground based scans and aerial lidar for 3D model building in Google SketchUp. The plug-in offers built-in support for Google’s geo-location services to coordinate StreetView textures and aerial imagery alongside point clouds. This new tool allows for a new data source to be used to create photo realistic 3D models of buildings and landscapes.

Click here for the full story and here for a video of the plug-in in action.

Image Source: Pointools Wordpress