NASA challenge announced: Open NASA Earth Exchange 2014

President Obama has announced a series of executive actions to reduce carbon pollution and promote sound science to understand and manage climate impacts for the U.S. 

Following the President’s call for developing tools for climate resilience, NEX is hosting a workshop that will feature:
  1. Climate science through lectures by experts;
  2. Computational tools through virtual labs; and
  3. A challenge inviting participants to compete for prizes by designing and implementing solutions for climate resilience.

An particularly exciting part of this initiative is the possibility to win cash prizes for innovative research ideas. You can find more information about labs and lectures here at https://nex.nasa.gov/opennex
and to participate in the challenge, you can go directly at https://www.innocentive.com/ar/challenge/9933584.

Pay attention! Especially grad students and young researchers! The first part of the challenge is the ideation challenge which will close on the 31st of July, 2014 and will follow up with another solvers challenge based on the ideas as selected form the ideation challenge. This will run through October so ample time to participate and win prizes.

Clark Labs to Create Cloud-based Land Change Modeler for ArcGIS

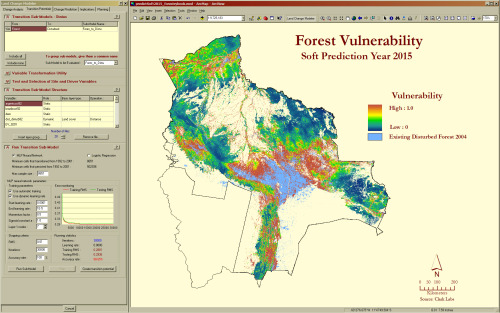
Clark Labs was awarded a million dollar grant from Esri to create a cloud-based version of their Land Change Modeler for ArcGIS. Land Change Modeler is suite of tools to assess and predict land change and evaluate the impacts of change and includes REDD (Reducing Emissions from Deforestation and Forest Degradation) tools for modeling the impact of land cover change on carbon emissions. Currently Land Change Modeler is only available in IDRISI and as a software extension for ArcGIS (the latest version is compatible with v10.2). This will make this tool more easily assessable to the wider public and scientific community.

From Clark Labs press release:

"Clark Labs was recently awarded a million dollar grant from Esri to create a cloud-based version of their Land Change Modeler for ArcGIS. Currently, Clark Labs’ extension is for the ArcGIS desktop.

Land Change Modeler for ArcGIS, first released in 2007 with Version 2 released this past month, is a software extension for ArcGIS users, offering a suite of tools to assess and predict land change and evaluate the impacts of such change. Clark Labs recent release includes many significant enhancements. The new version is compatible with ArcGIS Version 10.2

The Land Change Modeler offers an extensive suite of tools for land change research in a simple and automated workflow. It provides a variety of tools for land change analysis and prediction, as well as the impacts of those changes.

The new version release of this fall provides significant enhancements, particularly for its utility for REDD (Reducing Emissions from Deforestation and Forest Degradation). Land Change Modeler now includes functionality for modeling the impact of land cover change on carbon emissions. “Our world is changing rapidly, and technology to efficiently model and predict future land change is vital to addressing global challenges,’ said Jack Dangermond, Esri President. “We’re pleased to award this grant to Clark Labs to jumpstart their effort to utilize and provide rich content through ArcGIS Online.”

The new version also provides more capability for estimating land change impacts on habitat and biodiversity. With the grant from Esri, Clark Labs will be creating a cloud-based implementation of Land Change Modeler for their platform.

Clark Labs and Esri have been business partners for nearly ten years, working collaboratively on GIS research."

For the full news release see here.

Dense cities contribute less GHG

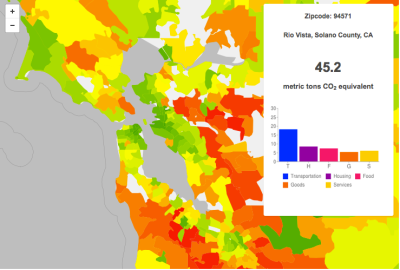
A CoolClimate Map of the SF Bay Area's carbon footprint by zipcode tabulation area shows a pattern typical of large metropolitan areas: a small footprint (green) in the urban core but a large footprint (orange and red) in surrounding suburbs.According to a new study by Dan Kammen and graduate student Christopher Jones at UC Berkeley, population-dense cities contribute less greenhouse-gas emissions per person than other areas of the country, but these cities’ extensive suburbs essentially wipe out the climate benefits.

Dominated by emissions from cars, trucks and other forms of transportation, suburbs account for about 50 percent of all household emissions – largely carbon dioxide – in the United States.

The study uses local census, weather and other data – 37 variables in total – to approximate greenhouse gas emissions resulting from the energy, transportation, food, goods and services consumed by U.S. households, so-called household carbon footprints.

A key finding of the UC Berkeley study is that suburbs account for half of all household greenhouse gas emissions, even though they account for less than half the U.S. population. The average carbon footprint of households living in the center of large, population-dense urban cities is about 50 percent below average, while households in distant suburbs are up to twice the average.

Interactive carbon footprint maps for more than 31,000 U.S. zip codes in all 50 states are available online at http://coolclimate.berkeley.edu/maps.

A link to their paper in Environmental Science & Technology is here: Spatial distribution of U.S. household carbon footprints reveals suburbanization undermines greenhouse gas benefits of urban population density (ES&T, 2014)

From: http://newscenter.berkeley.edu/2014/01/06/suburban-sprawl-cancels-carbon-footprint-savings-of-dense-urban-cores/

PROBA-V satellite launched May 7

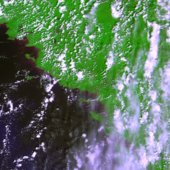
Proba-V’s first image of FranceI haven't used PROBA imagery, but many colleagues in Europe rely on this sensor.

PROBA-V (i.e. "vegetation") was launched May 7. The miniature satellite is designed to map land cover and vegetation growth across the entire planet every two days. The data can be used for alerting authorities to crop failures or monitoring the spread of deserts and deforestation.

Less than a cubic metre in volume, Proba-V is a miniaturised ESA satellite tasked with a full-scale mission: to map land cover and vegetation growth across the entire planet every two days.

Proba-V is flying a lighter but fully functional redesign of the Vegetation imaging instruments previously flown aboard France’s full-sized Spot-4 and Spot-5 satellites, which have been observing Earth since 1998.

Check it out: http://www.esa.int/Our_Activities/Technology/Proba_Missions/Proba-V_opens_its_eyes

Lisa Schile is off to Abu Dhabi

Dr. Lisa Schile is off to Abu Dhabi for a postdoctoral research position with the Smithsonian Institution. She'll be working on a project monitoring carbon sequestration in wetlands. We checked out some of the available Abu Dhabi imagery on-line. The country has a long and interesting coastline, with many mangroves and wetlands, and of course the ever increasing coastal development. Here is a snapshot from NASA of coastal development. Lisa has started a blog, and taking lots of pics for us to see.

mapping gas leaks in Boston

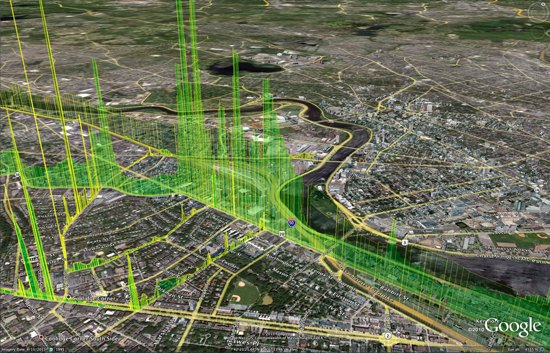
The Google Earth image above shows shafts of bright green indicating natural gas leaking around BU's Charles River Campus. If there are multiple leaks, the display “looks like a stock market index during a busy day,” says Nathan Phillips. Photo courtesy of Nathan Phillips and Picarro, Inc.This is a very interesting report about work at BU Geography and Environment department to map gas leaks across the city. Nathan Phillips, Bob Ackley and Eric Crosson use a Nissan-mounted methane sensor to survey for leaks, and map results on a google earth scene. The accompanying video shows the setup, and discusses some nasty real time implications for trees as gas replaces oxygen in the soil. Also, this is just nuts to think of how much wasted gas is going up in a typical city. Yikes!

Forest clearing and regrowth in Washington

These shots (both Landsat 5) are from much larger images provided by NASA Earth Observatory. They depict forest clearing and regrowth in Washington state. The checkerboard pattern is typical of land ownership patterns in the American West.  A nice article on this checkerboarded ownership patterns is here. The overall article talks about carbon storage and forestry; the point of the images below is 1) the pattern of clearing in 1984, which is really quite interesting and abstract, and 2) the regrowth in 2010.


From the article:

This pair of images, both from the Landsat 5 satellite, shows grids of forest disappearing and gradually regrowing over 26 years. In 1984, logging in the area appears to be in the early stages. In many places, red-brown earth is exposed under the swaths of freshly cut forest. Other grids, cleared just a bit earlier, are pale green with newly growing grasses or very young trees. The rest of the image is dominated by the deep green of dense, mature forest. In 2010, the logging operation seems to be more mature. There is little evidence of fresh cuts, but some areas have been recently cleared. Pockets of mature forest remain, and forest is regrowing in other places. Grids that had been clear in 1984 are forested in 2010.

Trees become houses, furniture, paper products, and myriad other products that we use every day. Trees are also important because they take carbon dioxide from the atmosphere and convert it to the sugars that make up the leaves and wood of the tree. Trees store carbon. The Earth Observatory’s new carbon cycle article describes the impact of deforestation on the carbon cycle:

When we clear forests, we remove a dense growth of plants that had stored carbon in wood, stems, and leaves—biomass. By removing a forest, we eliminate plants that would otherwise take carbon out of the atmosphere as they grow. We also expose soil that vents carbon from decayed plant matter into the atmosphere. Humans are currently emitting just under a billion tons of carbon into the atmosphere per year through land use changes. Changes that put carbon gases into the atmosphere result in warmer temperatures on Earth.

Satellite images like these help scientists estimate how much carbon dioxide goes into the atmosphere when a forest is cleared, and how much carbon dioxide is being taken out of the atmosphere as a forest regrows.

Read more in the Carbon Cycle feature.

Clark Labs teams up with Google.org to develop web based land-cover analysis and REDD tools

Land Change Modeler for ArcGIS (Image used with permission from Clark Labs)

From Clark Labs news:

Clark Labs recently received a $451,000 grant from the Gordon and Betty Moore Foundation to support the development of land-cover analysis and REDD tools for use on Google's Earth Engine. REDD, Reducing Emissions from Deforestation and Forest Degradation, is a climate change mitigation strategy that offers developing countries incentives to reduce forest carbon emissions. The complex implementation of REDD relies on substantial computing and data resources, and requires significant effort and investment. It is hoped that providing accessible modeling tools with Google’s cloud computing resources and wealth of geospatial data will encourage broader adoption of REDD.

The grant supports the development of a prototype of the land change analysis and prediction tools for Google.org’s Earth Engine platform, a technology in development that enables global-scale monitoring and measurement of changes in the Earth’s forests. It is planned that Google will host the required geospatial data layers to implement a REDD project, including maps of those factors identified as critical causes of deforestation, such as proximity to roads, slopes or distance from existing deforestation.

The new tools in development will guide the user through the steps of baseline development--land change analysis of the reference, project and leakage areas of a project, the identification of the carbon pools and input of carbon density values, and the estimation of emissions for projected dates. This new functionality will also directly produce the multitude of tables and graphics for the carbon accounting reporting requirement of REDD. The preparation costs of REDD will be significantly reduced by the automation provided by these tools.

Clark Labs is based within the Graduate School of Geography at Clark University in Worcester, MA and is the developer of the IDRISI Taiga GIS and Image Processing software and the Land Change Modeler software extension to ArcGIS. To view the full news release click here.

USGS seeks input for new carbon accounting plan

A draft methodology is proposed in response to requirements by the Energy Independence and Security Act of 2007 to assess ecosystems for carbon stocks, carbon sequestration, and greenhouse-gas fluxes. The assessment will be conducted to estimate capacities of ecosystems to increase carbon sequestration and reduce greenhouse-gas fluxes, in contexts of land-use, land-cover, and land-management scenarios as well as other controlling processes, such as climate change and wildland fires. Results of the assessment will be useful for evaluating a range of choices for formulating mitigation strategies and other land management policies.