New digitization project: Soil-Vegetation Map Collection

Between the years 1949-1979 the Pacific Southwest research station branch of the U.S. Forest service published two series of maps: 1) The Soil-Vegetation Maps, and 2) Timber Stand Vegetation Maps. These maps to our knowledge have not been digitized, and exist in paper form in university library collections, including the UC Berkeley Koshland BioScience Library.

Index map for the Soil Vegetation MapsThe Soil-Vegetation Maps use blue or black symbols to show the species composition of woody vegetation, series and phases of soil types, and the site-quality class of timber. A separate legend entitled “Legends and Supplemental Information to Accompany Soil-Vegetation Maps of California” allow for the interpretation of these symbols in maps published 1963 or earlier. Maps released following 1963 are usually accompanied by a report including legends, or a set of “Tables”. These maps are published on USGS quadrangles at two scales 1:31,680 and 1:24,000. Each 1:24,000 sheet represents about 36,000 acres. 

The Timber Stand Vegetation Maps use blue or black symbols to show broad vegetation types and the density of woody vegetation, age-size, structure, and density of conifer timber stands and other information about the land and vegetation resources is captured. The accompanying “Legends and Supplemental Information to Accompany Timber Stand-Vegetation Cover Maps of California” allows for interpretation of those symbols. Unlike the Soil-Vegetation Maps a single issue of the legend is sufficient for interpretation. 

We found 22 quad sheets for Sonoma County in the Koshland BioScience Library at UC Berkeley, and embarked upon a test digitization project. 

Scanning. Using a large format scanner at UC Berkeley’s Earth Science and Map library we scanned each original quad at a standard 300dpi resolution. The staff at the Earth Science Library completes the scans and provides an online portal with which to download. 

Georeferencing. Georeferencing of the maps was done in ArcGIS Desktop using the georeferencing toolbar. For the Sonoma county quads which are at a standard 1:24,000 scale we were able to employ the use of the USGS 24k quad index file for corner reference points to manually georeference each quad. 

Error estimation. The georeferencing process of historical datasets produces error. We capture the error created through this process through the root mean squared error (RMSE). The min value from these 22 quads is 4.9, the max value is 15.6 and the mean is 9.9. This information must be captured before the image is registered. See Table 1 below for individual RMSE scores for all 22 quads. 

Conclusions. Super fun exercise, and we look forward to hearing about how these maps are used. Personally, I love working with old maps, and bringing them into modern data analysis. Just checking out the old and the new can show change, as in this snap from what is now Lake Sonoma, but was the Sonoma River in the 1930s.

Thanks Kelly and Shane for your work on this!

ISECCI historical ecology working group wrap-up

Last week Kelly and I with others travelled to the Sierra Nevada Aquatic Research Lab (SNARL) in the eastern Sierra Nevada, just south of Mono Lake for a research retreat. SNARL is part of the UC's Natural Reserve System, which is comprised of nearly 40 properties across the state. These are preserves that foster research, education and collaboration. They have much in common with ANR's REC system. I've been to a few of them now, and am very pleased to make more visits. I love the east side of the Sierra, and that iconic Highway 395. 

This trip was a retreat for the ISECCI historical ecology working group, led by the inspirational Peter Alagona from UCSB. We discussed our existing projects, including the VTM work (see figure below), and talked about potentials for more collaborative research and further integration between NRS and ANR. We have a list of wishes for digitization, and if anyone out there has ideas about pitching these to donors, please let me know. For example: 

  • Kelly and I want to digitize the Leiburg maps from the northern Sierra to add to the VTM stack;
  • We want to find a better way to index and view historical aerial photography state-wide. Something like this for historical maps: http://ngmdb.usgs.gov/maps/TopoView/help/

And we had a field trip looking at Mono Lake water issues. Great time spent!

Density of VTM features across the collections

New VTM retakes, this time from Heather

Plus sa change, plus sa la meme chose. Thanks to Heather Constable, who went out exploring near Morro Bay. Here is one of her retakes. 

Date of original photo: Feb 25, 1936, taken in San Luis Obispo County, California, US. Looking north toward Morro Bay. Shows almost dense stand of Arctostaphylos morroensis in foreground. Quad name: Cayucos. Quad number: 132B. Reference to map: 1. Photographer: Albert Wieslander.

The Conversation: VTM data helps us understand changes to California forests

I recently adventured into science journalism with a piece describing our recent article in PNAS detailing changes in forest structure over the 20th century. I talk about the use of the old data, and what the implications are for these changes. Check it out!

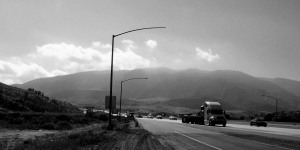
California’s majestic trees are declining — a harbinger of future forests

By Maggi Kelly, University of California, Berkeley

Scientists in my native state of California were handed a gift: a trove of detailed information about the state’s forests taken during the 1920s and 1930s and digitized over the past 15 years. When we compared this historical data – covering an area bigger than Great Britain – to current forests surveys, we found that California’s famed giant trees are suffering due to drier and warmer conditions.

This change to the forest landscape is important not only to the people of California. Large trees are huge sinks of carbon dioxide, provide habitat for many creatures and play a vital role in the water supply by, for example, providing catchment areas for snow. Forests that are denser with smaller trees are also more likely to burn.

Studying how the structure of forests is shifting over time provides us insight into how forests — a resource we depend on for many environmental and economic reasons — could change in a world of warmer temperatures.

Saved from destruction

Researchers from the University of California at Berkeley and Davis, the Department of Forest Management at the University of Montana, and the US Geological Survey’s California Water Science Center worked together on a paper on California’s forests published last week in the Proceedings of the National Academy of Sciences.

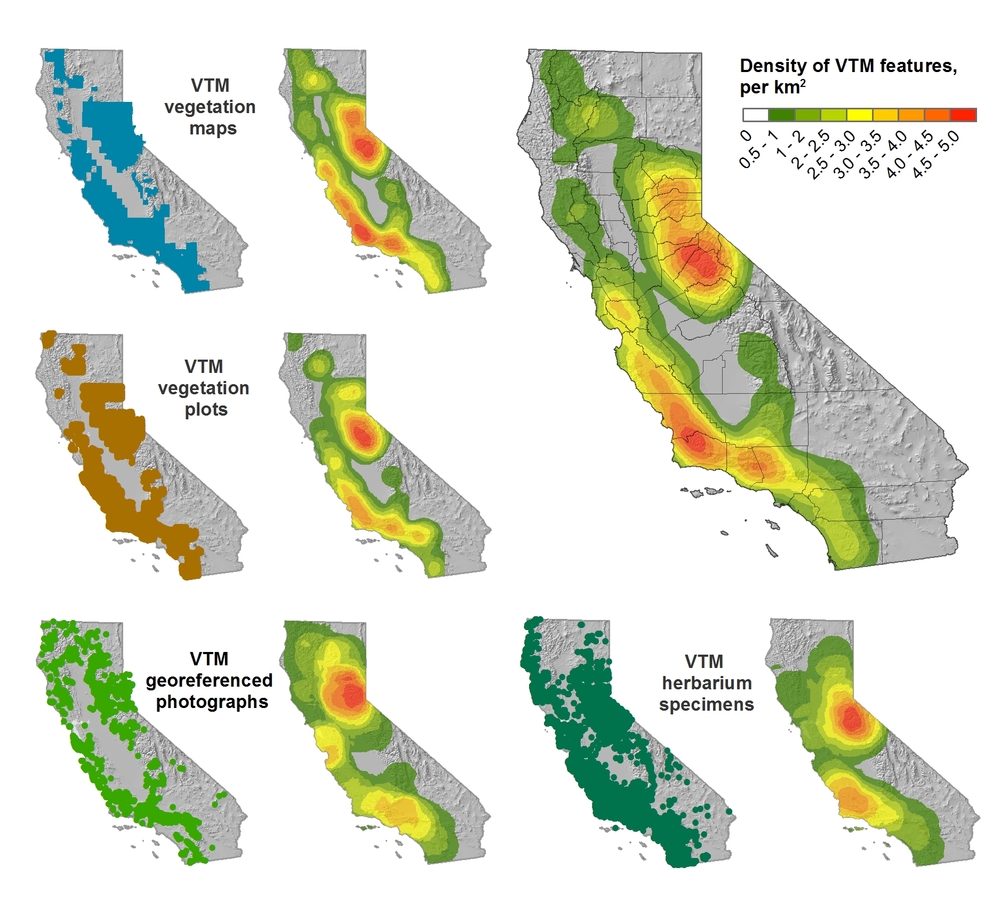
The historical data for our study came from the Wieslander Vegetation Type Mapping (VTM) collection, which was created in the 1920s and 1930s. It’s been described in a 2000 paper as “the most important and comprehensive botanical map of a large area ever undertaken anywhere on the earth’s surface.”

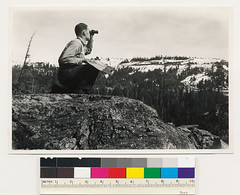
This botanical map was pioneered by Albert Wieslander, an employee of the Forest Service Forest and Range Experiment Station in Berkeley, California. The collection consists of 18,000 detailed vegetation plots, over 200 vegetation maps, 3,100 photographs and hundreds of plant specimens. Overall, the collection covers about 280,000 square kilometers, or just over a third of the state. Combined, the data created a detailed picture of the state’s vegetation in the early 20th century — an important marker ecologists today can use for comparison.

During the 2000s, several groups, including my lab, launched efforts to digitize the plot data, maps and photograph portions of the collection. There still are some missing pieces. Indeed, the journey from paper collection to digital data has been a long one, with several cases in which documents were nearly destroyed either intentionally or by accident. It’s a cautionary tale about the importance of rescued and shared historical data in ecological and geographical analysis.

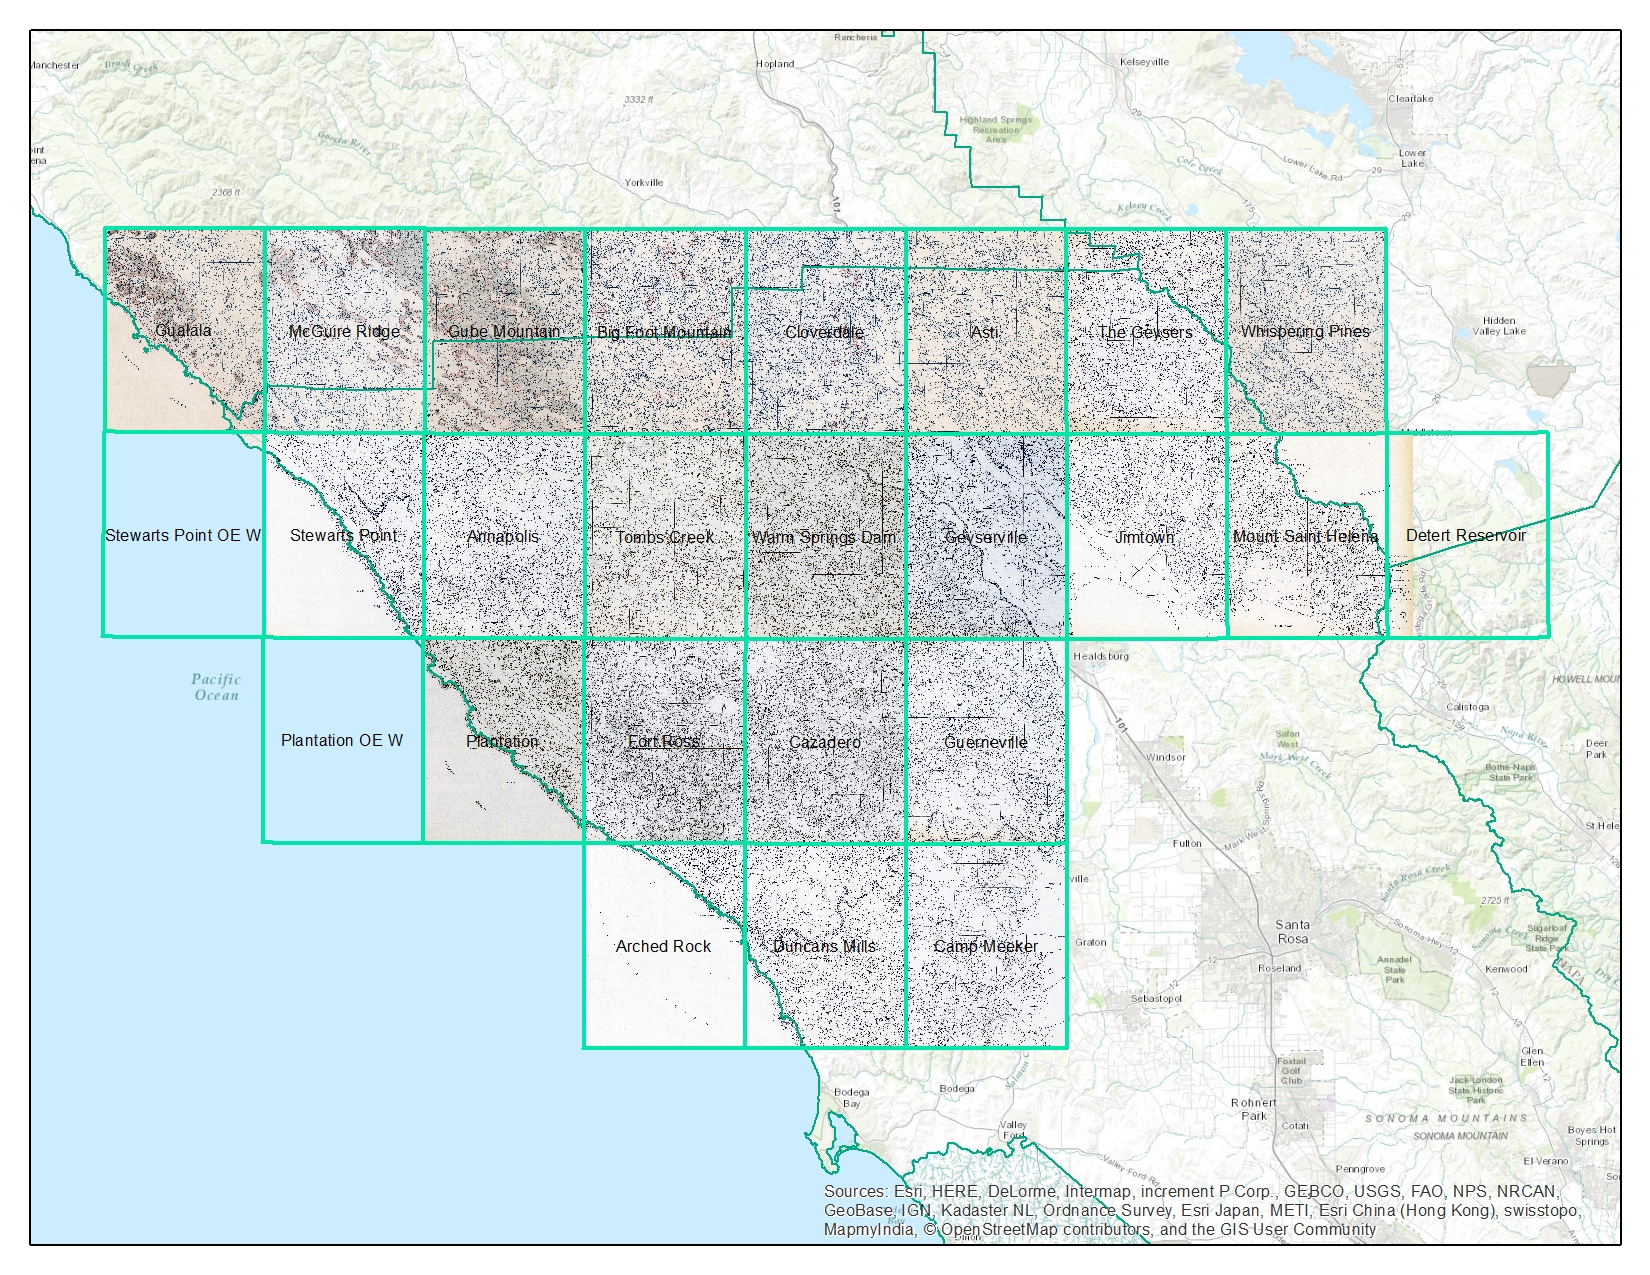
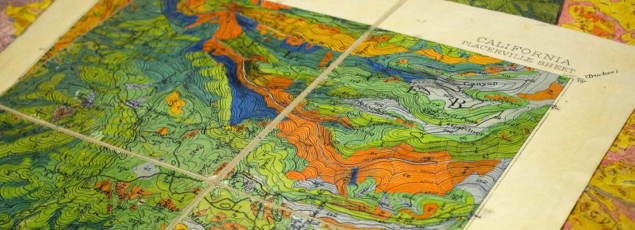
An example of one of the vegetation maps from the VTM collection. Shufei Lei, photographer


In our large trees study, we wanted to look at forest structure throughout the state by comparing the 1920s and 30s data with contemporary data collected through the Forest Inventory and Analysis (FIA) program. The FIA program is similar to the VTM project: Forest Service crews report on the species, size, and health of trees across all forest land ownerships. Our study was comprehensive, covering the five ecological regions of the state - over 120,000 square kilometers in total – and took into account land-management and land-use history.

Denser forests with more smaller trees

We found that statewide, tree density – or the number of trees in a given area – in forested regions increased by 30% between the two time periods and that forest biomass declined by 19%. This means that there are more smaller trees filling in the forest, while the number of large trees is shrinking. (A large tree was defined as having a diameter larger than 60 centimeters or two feet.)


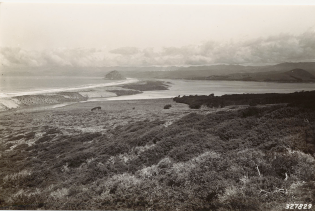
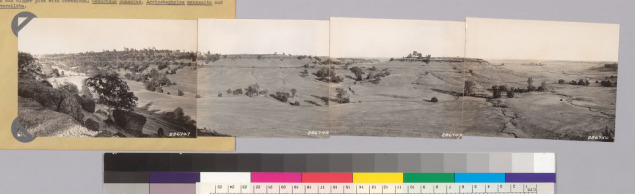
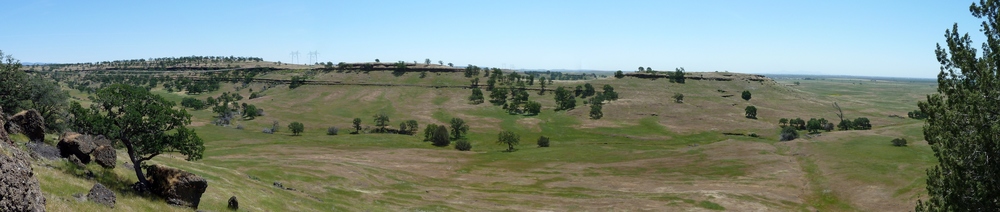
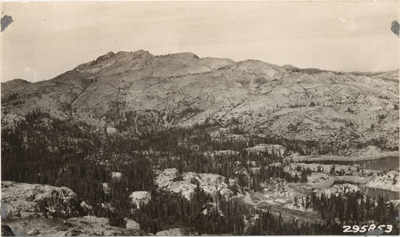
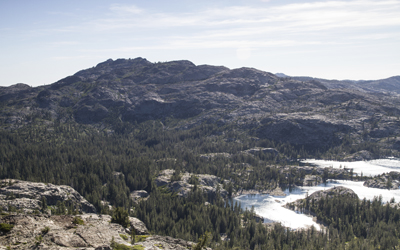
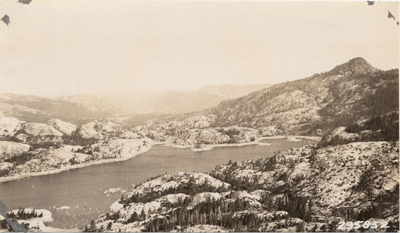
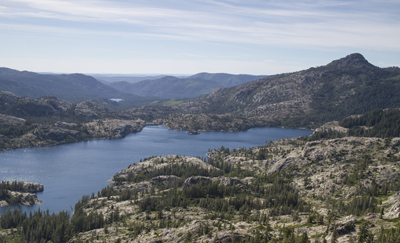
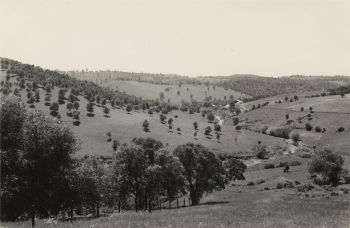
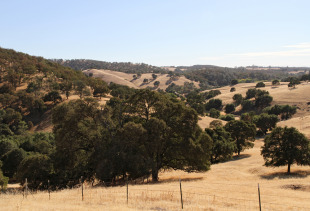
Wieslander’s photo of French Lake and English Mt. looking north, morphing into 2014 photo by Joyce Gross. Wieslander’s photo shows a large area of barren and semi-barren oak. University of California, Berkeley, CC BY


Also, we found that forest composition in California in the last century shifted toward increased dominance by oaks relative to pines, a pattern consistent with warming and increased water stress. It also fits the shifts in vegetation we can surmise from the paleorecord in California over the last 150,000 years.

Why this shift from fewer large trees to more smaller trees?

Water stress seems to be the best explanation for the pattern we observed. Water stress in a forest is caused by a combination of rising temperatures, which cause trees to lose more water to the air and to earlier melting of snowpacks, which reduces the amount of water available to trees. And indeed, large tree declines were more severe in areas experiencing greater increases in water deficit since the 1930s.

Large trees, in general, seem to be more vulnerable to water shortfalls. This might be because larger, taller trees have trouble getting water to the tops of the trees when water is short, a phenomenon being studied by many tree physiologists.

It might also be that these big trees – some likely 300 years old or more – grew up in a different, colder and moister climate. Regardless of the reasons for large tree decline, we likely can expect more water stress in California from rising global temperatures.

A different forest than what your grandparents saw

Apart from the fact that we tend to love and admire our emblematic large trees, they also serve very important roles in the forests. And changes to forest structure – a shift to fewer large trees and more smaller trees – are important for us to pay attention to.

Forests with large trees store more carbon; groups of larger trees provide preferential habitat for many species; forest structure impacts the way fires burn and impacts the way forests store and release water. These changes are a warning of possible changes to come. The loss of these trees, for example, would take away a massive carbon sink, change the way wildlife use these forests, and change the way they burn.

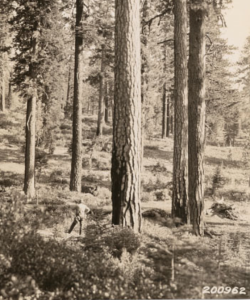
This photo was taken by Albert Wieslander in 1936 in a redwood grove in San Mateo County. The tree in the front has a diameter around 6 feet. Marian Koshland Biosciences Library


Finally, we would like to stress the importance of rescuing, curating and digitizing historic data. The changes we observed here, although large, did not happen over night – indeed, they really took two or three generations to occur.

Each generation perhaps sees the nature around them as the “normal.” Yet the forests of our grandparents and great-grandparents, observed by the Wieslander crews, were very different than ours today and they will be different again for our grandchildren. We need these historic data to document these changes and demonstrate the rate of change in the natural world.

Some key references:

Jepson, W. L., R. Beidleman, and B. Ertter. 2000. Willis Linn Jepson’s ‘‘Mapping in Forest Botany’’. Madroño 47:269–272.

Kelly, M., B. Allen-Diaz, and N. Kobzina. 2005. Digitization of a historic dataset: the Wieslander California vegetation type mapping project. Madroño 52(3):191-201

Wieslander, A. E. 1935. A vegetation type map of California. Madroño 2:140-144

This article was originally published on The Conversation. Read the original article.

VTM data helps us understand changes to California forests

Some press on our PNAS paper: Twentieth-century shifts in forest structure in California: Denser forests, smaller trees, and increased dominance of oaks.

In the paper we document changes in forest structure between historical (1930s) and contemporary (2000s) surveys of California vegetation. The shorthand is:

  1. Statewide, tree density in forested regions increased by 30% between the two time periods, and forest biomass declined by 19%.
  2. Larger trees (>60 cm diameter at breast height) declined, whereas smaller trees (<30 cm) have increased.
  3. Large tree declines were more severe in areas experiencing greater increases in climatic water deficit since the 1930s.
  4. Forest composition in California in the last century has also shifted toward increased dominance by oaks relative to pines, a pattern consistent with warming and increased water stress, and also with paleohistoric shifts in vegetation in California over the last 150,000 years.

New VTM reshot, from Tim Hanson

This one from Tim Hanson. The caption from the photos (286747. 286748, 286749, 286750) reads:

"Butte County. Panorama looking SW, S. SE and E from Neal Road. Note Juniperus californica in ravine. Woodland grass type of blue oak and digger pines with occasional Ceanothus cuneatus, Arctostaphylos manzanita and Rhus diversiloba."

There is still California juniper in the ravine, including far right of the new photo, which is uncommon in Butte County. The rare Monardella venosa grows in patches of dense clay soil in the flats of the canyon. The Wieslander picture was taken on 6/24/1933 and his picture was taken on 5/3/2011.


New VTM photo reshoots from Joyce - check it!

Joyce Gross is our most avid VTM photography buffs. Here are two new VTM reshoots for our viewing pleasure. Her original post here, and here are all her new photos on CalPhoto.

She says: This was the first VTM photo site I've found that required a hike to get there. Not only was the photo not taken from a road, but it was not taken from a trail. The hike from my car to the site was a little over a mile, but it felt like more. It was all uphill, and we didn't really know where we were going. The first 2/3 of the hike was along a narrow, rocky road (image below). The last third of the hike involved somewhat random wandering over rocks and around bushes towards a view we hoped to see but weren't sure exactly where it was. My Garmin GPS, and Gaia GPS on my iPad, were my friends on this hike, helping us get to the photo location and, especially, helping us get back. Thanks Joyce!

Upper end of French Lake and Black Buttes. One of the largest natural barren areas on the Colfax map.Joyce's photograph


French Lake and English Mt. Looking north, 45 degrees west. Large area of barren and semi-barren Quercus vaccinifolia.Joyce's photograph of French Lake

NEW VTM Reshoot!

Take a look at this awesome VTM reshoot from the folks over at Geographic Resource Solutions (GRS), photographed during a recent mapping project of Lassen Volcanic National Park. Yet another great example and an incredible testament to lasting power of the VTM dataset. This particular photo was taken near the Chaos Crags Jumble in Lassen Volcanic National Park. Thanks to Ken Stumpf and GRS for sharing!

Albert Wieslander (October 1, 1925): Looking N 35 degrees W from 1/4 corner 16/17 T 31-4. Foreground dwarf timber on glacial deposit. Slope in background, section 7 and 8 Tyler Brown of GRS (September,2011): At Accuracy Assessment Site 091646 located in the Chaos Crags Jumble in Lassen Volcanic National Park

In a similar vein I recently stumbled upon another meshing of historical and contemporary photographs. The project features reshoots of the Grand Canyon and resulted in a 2012 book titled: Reconstructing the View: The Grand Canyon Photographs of Mark Klett and Byron Wolfe

Published by University of California Press. You can see a few of the photographer’s recent projects on their website. Historical photos are just the best!


Rescuing historic data for modern use: a cautionary tale from the past

An example of a VTM vegetation map, from Shufei LeiWe have been talking recently with the HOLOS project and the IGIS InfoBase project about the need to "rescue" data and to provide frameworks for data synthesis. I present to you a profound example of these needs: the VTM project. We have launched the new VTM website, in which the maps, plots, and photograph portions of the VTM collection are united and powered by HOLOS, open data, and sharing. The journey from paper collection to digital data has been a long one, with several cases of almost accidental and purposeful destruction. As such it is a cautionary tale about the importance of rescued and shared historical data in ecological and geographical analysis. We owe much to all the people who have contributed to the preservation and digitization of this important collection.

I spent this evening reading the oral history conducted in 1985 by Ann Lange of Albert Wieslander. It is called: California Forester: Mapper of Wildland Vegetation and Soils A. E. Wieslander, and it is a fascinating read. In addition to being a real spitfire and having very clear opinions on things (and people), he also tells this tale about the near loss in 1952 of the vegetation maps. Wieslander had made 23 of his vegetation maps available for publication through the University Press, for production and sale at a cost of $1 each. This was meant to supply funds for the rest of the maps to be published. But that didn't work out as planned.

"Not very many of the maps were sold, even though articles were written to give them publicity. I realized fairly soon that we wouldn't be able to publish any more unless we got additional money someplace.” He was "casually told one day that the University Press had written a letter to the station saying that the maps weren't selling very well, and it wanted to return the quadrangles to the station. They didn't want to handle it anymore.” A forest service employee "told the University Press the station didn't want the maps back and authorized it to dump them. I didn't know anything about this until after it was done. There was nothing I could do about it then. Imagine all these beautiful maps. They didn't even take out one as a sample.”

What!! That is so shortsighted… Anyway read on…

Wies (he refers to himself "Wies" in the interviews) then found out that the University Press couldn't understand the dumping of all those maps and alerted Paul Zinke, Forestry Professor here at Berkeley.

"So Zinke went down and got twenty copies of each of the quadrangles.”

But, we still had all the original field maps, kept at the experiment station. Just before I retired, I talked with Herbert Mason about all the printed maps having been destroyed and about how it was important to preserve the originals. Researchers could use them. He suggested that the Botany Department set up in the Life Sciences Building a plant geography room. And the main feature of this plant geography room would be the vegetation mapping project. So I moved all the files of maps and sample plots over to the Life Sciences Building. Mason went through the material and found at least a third, maybe more, of the original maps were gone.” Apparently, different national forests had been writing to the station requesting certain maps. Since they didn't have any of the printed maps, originals were sent out, with no record kept of what was sent, or to whom. 

This explains why the maps have been scattered across the state, and why it has taken so long to pull them (mostly) together again. 

"The maps then made a trip back to the station, where Dr. William Critchfield used them to write a publication called "The Profiles of California Vegetation”. "Anyway, I'm glad that was done. It was a very nice publication, and it gave proper credit to the draftsman who did the beautiful job of drafting, and to the project, and to me. Then Critchfield also worked with James Griffen, of the university, and got out another publication on "The Distribution of Trees in California." It was based on the maps and other data we had." When Wies expressed "concern about these maps and Dr. Critchfield said, "I would like to get them deposited in the Bancroft Library." I don't know whether he did it or not, but that's what he told me.”

Thank goodness that they are back on campus in the Marian Koshland Library (and for this we are forever in debt to the wonderful Norma Kobzina), and the plot data, plot maps, vegetation maps, and photographs will be re-united and available for use.

VTM wrap-up: check out some neat photos and videos...

The VTM collection is a great resource from the 1920s and 1930s that we are woking with as part of our Keck project. David Ackerly, Patrick McIntyre, Jim Thorne and I are working with four different parts of the collection:

  • 17,860 plots with digitized vegetation and locality data (UC Berkeley, Geospatial Innovation Facility);
  • ~195,000 square kilometers of digitized and georeferenced vegetation maps, covering 45% of the total area of California (UC Davis Information Center for the Environment);
  • 20,791 herbarium specimens with locality and collection information (UC Berkeley & Jepson Herbaria); and
  • ~ 3,100 digitized photographs (UC Berkeley Marion Koshland Bioscience and Natural Resources Library).

Pretty cool stuff! Some related cool VTM-related work out there:

First, Jim Thorne's fabulous movie about using VTM data to look at change in vegetation: http://vimeo.com/41524838.

Also, a nice photo re-shoot project from Elsmere Canyon that Patrick McIntyre pointed out...

And one of his own before and after photos.

The original VTM version...

Patrick's retake, 2012

AAG 2012 Wrap-up

NY skyline from Tim DeChant's blogAAG was a moderately large conference (just under 9,000) this year, held in mid-town NY. It was a brief trip for me, but I did go to some great talks across RS, GIScience, cartography, and VGI. I also went to a very productive OpenGeoSuite workshop hosted by OpenGeo. Some brief highights from the conference: Muki Hacklay discussed participation inequities in VGI: when you mine geoweb data, you are mining outliers, not society; there are biases in gender, education, age and enthusiasm. Agent-based modeling is still hot, and still improving. I saw some great talks in ABM for understanding land use change. Peter Deadman showed how new markets in a hot crop (like Acai) can transform a region quite quickly. Landsat 8 will likely be launched in early 2013, but further missions are less certain. My talk was in a historical ecology session, and Qinghua Guo and I highlighted some of the new modeled results of historic oak diversity in California using VTM data and Maxent.

Saturday evening I had the great pleasure of being locked in after hours at the NY Public Library for a session on historic maps. David Rumsey, with Humphrey Southall (University of Portsmouth) and Petr Pridal (Moravian Library) led a presentation introducing a new website: oldmapsonline.org. The website's goal is to provide a clearer way to find old maps, and provide them with a stable digital reference. 

New Interface for the Manhatta Project. Check it.

We talked about this before here; and the Manhatta project has a nice new interface for exploring the 1609 map of the island of Manhatta(n), block by block, through time.  I love this project! The combination of mashup, history, design and art are breathtaking.  (And our own Tim Bean worked on reconstructing the early topography! - see his comment below.) Go Fullscreen on your 30"-monitor. I dare you.

“The goal of the Mannahatta Project has never been to return Manhattan to its primeval state. The goal of the project is discover something new about a place we all know so well, whether we live in New York or see it on television, and, through that discovery, to alter our way of life. New York does not lack for dystopian visions of the future…. But what is the vision of the future that works? Might it lie in Mannahatta, the green heart of New York, and with a new start to history, a few hours before Hudson arrived that sunny afternoon four hundred years ago?”

- from Mannahatta: A Natural History of New York City

The VTM photo-hunt is on (at least in the Bay Area)

I am reinvigorating the mission to re-shoot the VTM photos. At least in the Bay Area. This was prompted by the recent Berkleyan article about the new UC reserve in Santa Clara County ("preserves oak-woodland ecosystem at urban/wildland interface"). I thought "I wonder if there are any pictures of the area from the VTM collection?" and had a search this weekend. Sure enough, there are some nice ones. So I've geo-located a few from around the bay to get us started. Any ideas on: automating the process; making an easy site to upload paired photos; an easy way to link Township/Range queries into gmaps... Any volunteers to do Santa Cruz County? Lots of great pics there. And check out the local logging history documented in the photos of the New Almaden quad.

Mapserver Foundation

Mapserver is an open source web mapping software package that I use for the VTM site and that Brent uses for the Fire Information Engine. Recently, several core Mapserver developers announced the formation of a Mapserver Foundation, an organization intended to unite Mapserver with several related open source projects under a single banner for the purpose of standardized development and release procedures, and to provide a single body to mediate funding requests and donations, among other things. Most likely modelled after the Apache Software Foundations, this is certainly a Good Thing, as all these kinds of management and governance issues were previously handled in an ad hoc manner by the developers and a handful of contributing organizations like the University of Minnesota and DM Solutions, which has lead to a lot of inconsistency and occasional gaps in documentation.

However, in addition to Mapserver, the new Mapserver Foundation will also host the newly open sourced AutoDesk MapGuide, a web mapping package from the company that makes AutoCAD. Confusingly, MapGuide will now be known as Mapserver Enterprise, and the old Mapserver will be called Mapserver Cheetah (although the naming is apparently still up in the air). Several people in the Mapserver user and developer communities are peeved because the Foundation was planned without community input. Many are also displeased by this alliance with AutoDesk, a company not generally known for its commitment to open source. Some argue that this new naming scheme will confuse potential users and dilute the Mapserver brand, eventually resulting in less use and development for the traditional Mapserver we all know and love. While I think the new naming scheme is stupid and possibly detremental, I think the Foundation will ultimately be a force for good. Anything that provides greater stability and more documentation can't hurt, right? Links for the interested: Mapserver Mapserver Foundation AutoDesk MapGuide Official announcment of the Mapserver Foundation Comments by Ed McNierney (founder of topozone.com) Comments by Gary Lang (a lead MapGuide developer) Discussion on mapserver-users (a search for 'Foundation' should bring up most of the relevant threads, assuming there aren't any Asimov nerds getting way OT)