AAG Boston 2017 Day 1 wrap up!

Day 1: Thursday I focused on the organized sessions on uncertainty and context in geographical data and analysis. I’ve found AAGs to be more rewarding if you focus on a theme, rather than jump from session to session. But less steps on the iWatch of course. There are nearly 30 (!) sessions of speakers who were presenting on these topics throughout the conference.

An excellent plenary session on New Developments and Perspectives on Context and Uncertainty started us off, with Mei Po Kwan and Michael Goodchild providing overviews. We need to create reliable geographical knowledge in the face of the challenges brought up by uncertainty and context, for example: people and animals move through space, phenomena are multi-scaled in space and time, data is heterogeneous, making our creation of knowledge difficult. There were sessions focusing on sampling, modeling, & patterns, on remote sensing (mine), on planning and sea level rise, on health research, on urban context and mobility, and on big data, data context, data fusion, and visualization of uncertainty. What a day! All of this is necessarily interdisciplinary. Here are some quick insights from the keynotes.

Mei Po Kwan focused on uncertainty and context in space and time:

  • We all know about the MAUP concept, what about the parallel with time? The MTUP: modifiable temporal unit problem.
  • Time is very complex. There are many characteristics of time and change: momentary, time-lagged response, episodic, duration, cumulative exposure
    • sub-discussion: change has patterns as well - changes can be clumpy in space and time. 
  • How do we aggregate, segment and bound spatial-temporal data in order to understand process?
  • The basic message is that you must really understand uncertainty: Neighborhood effects can be overestimated if you don’t include uncertainty.

As expected, Michael Goodchild gave a master class in context and uncertainty. No one else can deliver such complex material so clearly, with a mix of theory and common sense. Inspiring. Anyway, he talked about:

  • Data are a source of context:
    • Vertical context – other things that are known about a location, that might predict what happens and help us understand the location;
    • Horizontal context – things about neighborhoods that might help us understand what is going on.
    • Both of these aspects have associated uncertainties, which complicate analyses.
  • Why is geospatial data uncertain?
    • Location measurement is uncertain
    • Any integration of location is also uncertain
    • Observations are non-replicable
    • Loss of spatial detail
    • Conceptual uncertainty
  • This is the paradox. We have abundant sources of spatial data, they are potentially useful. Yet all of them are subject to myriad types of uncertainty. In addition, the conceptual definition of context is fraught with uncertainty.
  • He then talked about some tools for dealing with uncertainty, such as areal interpolation, and spatial convolution.
  • He finished with some research directions, including focusing on behavior and pattern, better ways of addressing confidentiality, and development of a better suite of tools that include uncertainty.

My session went well. I chaired a session on uncertainty and context in remote sensing with 4 great talks from Devin White and Dave Kelbe from Oak Ridge NL who did a pair of talks on ORNL work in photogrammetry and stereo imagery, Corrine Coakley from Kent State who is working on reconstructing ancient river terraces, and Chris Amante from the great CU who is developing uncertainty-embedded bathy-topo products. My talk was on uncertainty in lidar inputs to fire models, and I got a great question from Mark Fonstad about the real independence of errors – as in canopy height and canopy base height are likely correlated, so aren’t their errors? Why do you treat them as independent? Which kind of blew my mind, but Qinghua Guo stepped in with some helpful words about the difficulties of sampling from a joint probability distribution in Monte Carlo simulations, etc. 

Plus we had some great times with Jacob, Leo, Yanjun and the Green Valley International crew who were showcasing their series of Lidar instruments and software. Good times for all!

New digitization project: Soil-Vegetation Map Collection

Between the years 1949-1979 the Pacific Southwest research station branch of the U.S. Forest service published two series of maps: 1) The Soil-Vegetation Maps, and 2) Timber Stand Vegetation Maps. These maps to our knowledge have not been digitized, and exist in paper form in university library collections, including the UC Berkeley Koshland BioScience Library.

Index map for the Soil Vegetation MapsThe Soil-Vegetation Maps use blue or black symbols to show the species composition of woody vegetation, series and phases of soil types, and the site-quality class of timber. A separate legend entitled “Legends and Supplemental Information to Accompany Soil-Vegetation Maps of California” allow for the interpretation of these symbols in maps published 1963 or earlier. Maps released following 1963 are usually accompanied by a report including legends, or a set of “Tables”. These maps are published on USGS quadrangles at two scales 1:31,680 and 1:24,000. Each 1:24,000 sheet represents about 36,000 acres. 

The Timber Stand Vegetation Maps use blue or black symbols to show broad vegetation types and the density of woody vegetation, age-size, structure, and density of conifer timber stands and other information about the land and vegetation resources is captured. The accompanying “Legends and Supplemental Information to Accompany Timber Stand-Vegetation Cover Maps of California” allows for interpretation of those symbols. Unlike the Soil-Vegetation Maps a single issue of the legend is sufficient for interpretation. 

We found 22 quad sheets for Sonoma County in the Koshland BioScience Library at UC Berkeley, and embarked upon a test digitization project. 

Scanning. Using a large format scanner at UC Berkeley’s Earth Science and Map library we scanned each original quad at a standard 300dpi resolution. The staff at the Earth Science Library completes the scans and provides an online portal with which to download. 

Georeferencing. Georeferencing of the maps was done in ArcGIS Desktop using the georeferencing toolbar. For the Sonoma county quads which are at a standard 1:24,000 scale we were able to employ the use of the USGS 24k quad index file for corner reference points to manually georeference each quad. 

Error estimation. The georeferencing process of historical datasets produces error. We capture the error created through this process through the root mean squared error (RMSE). The min value from these 22 quads is 4.9, the max value is 15.6 and the mean is 9.9. This information must be captured before the image is registered. See Table 1 below for individual RMSE scores for all 22 quads. 

Conclusions. Super fun exercise, and we look forward to hearing about how these maps are used. Personally, I love working with old maps, and bringing them into modern data analysis. Just checking out the old and the new can show change, as in this snap from what is now Lake Sonoma, but was the Sonoma River in the 1930s.

Thanks Kelly and Shane for your work on this!

New datum for Australia: catch me if you can!

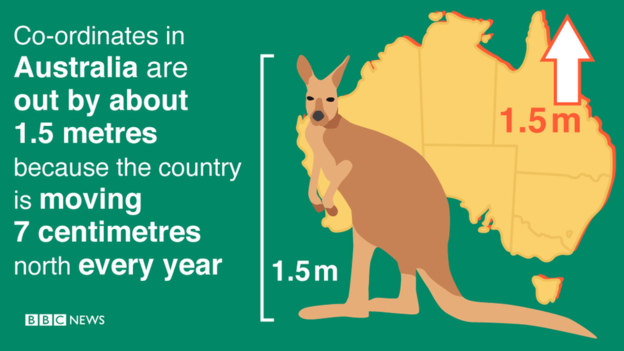
In the US, we have revised our geodetic datum over the yearrs. Most famously the switch from NAD27 to NAD83 as instrumention necessitated more measurements and resulted in a more accurate model. But in Australia, they are creating a new datum because the continent is MOVING 7cm a year. 

Read here: http://www.bbc.com/news/technology-36912700

Check it:

The Geocentric Datum of Australia, the country's local co-ordinate system, was last updated in 1994. Since then, Australia has moved about 1.5 metres north.

So on 1 January 2017, the country's local co-ordinates will also be shifted further north - by 1.8m.

The over-correction means Australia's local co-ordinates and the Earth's global co-ordinates will align in 2020.

National Park moved 150 miles to the east to take up role as urban escape

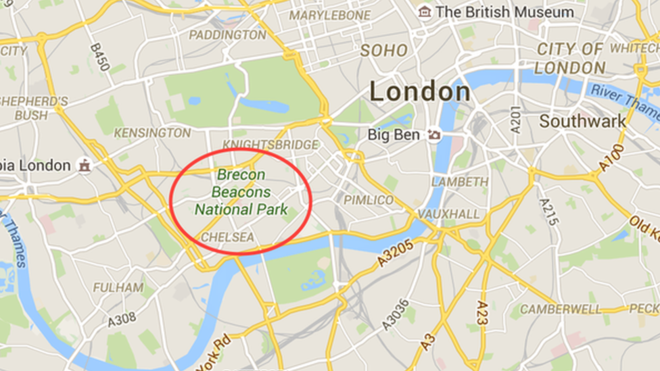
Here is a funny response to a major map error on Google Maps, found last month. From BBC Wales: http://www.bbc.com/news/uk-wales-mid-wales-34410736

The gorgeous Brecon Beacons was erroneously positioned outside of downtown London. The technical error has directed people searching for the national park more than 150m (241km) away to a location between Chelsea and Knightsbridge.

Brecon Beacons National Park Authority posted the image online with the caption: "We have now moved. Londoners get an upgrade thanks to Google Maps."

Chief executive John Cook joked: "Well the move has come as a bit of a shock to us all."

He added: "I'm sure it will come as good news to Londoners who want some fresh mountain air on their doorstep.

"The truth is we are only three hours away from London - don't rely on your sat-nav or Google Maps - just head to Bristol on the M4, cross the bridge, ask a local and they'll know exactly where to find us."

Hilarious response. I've been walking on the Beacons exactly once, and it was divine. 

False precision in the English Lidar release

Great commentary from Martin Isenburgon of LASTools fame on releasing data with false precision. This deals with the new open data release by the Environment Agency in England. So far LiDAR-derived DTM and DSM rasters have been released for 72% of the entire English territory at horizontal resolutions of 50 cm, 1 m, and 2 m. They can be downloaded here. The rasters are distributed as zipped archives of tiles in textual ASC format (*.asc). 

Martin gives us a cautionary tale on how not to release national data. It is not the ASC format that he has problems with, but the vertical precision. He says:

"The vertical resolution ranges from femtometers to attometers. This means that the ASCII numbers that specify the elevation for each grid cell are written down with 15 to 17 digits after the decimal point."

Example heights might be something like: 79.9499969482421875 or 80.23999786376953125. These data should be resolved to about the cm, not attometer, whatever that is. Crazy man!

Read the full post: http://rapidlasso.com/2015/09/02/england-releases-national-lidar-dem-with-insane-vertical-resolution/

Google Maps border becomes part of international dispute

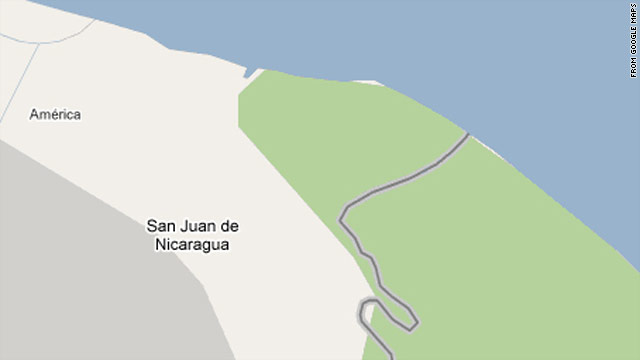
(CNN) -- The accuracy of Google Maps has been pulled into a debate about the border between two Central American countries.

A Nicaraguan general cited Google's version of the border map as an after-the-fact justification of a reported raid of a disputed area between that country and Costa Rica.

http://www.cnn.com/2010/TECH/web/11/05/nicaragua.raid.google.maps/index.html