NASA Data and the Distributed Active Archive Centers

I’ve been away from the blog for awhile, but thought I’d catch up a bit. I am in beautiful Madison Wisconsin (Lake Mendota! 90 degrees! Rain! Fried cheese curds!) for the NASA LP DAAC User Working Group meeting. This is a cool deal where imagery and product users meet with NASA team leaders to review products and tools. Since this UWG process is new to me, I am highlighting some of the key fun things I learned. 

What is a DAAC?
A DAAC is a Distributed Active Archive Center, run by NASA Earth Observing System Data and Information System (EOSDIS). These are discipline-specific facilities located throughout the United States. These institutions are custodians of EOS mission data and ensure that data will be easily accessible to users. Each of the 12 EOSDIS DAACs process, archive, document, and distribute data from NASA's past and current Earth-observing satellites and field measurement programs. For example, if you want to know about snow and ice data, visit the National Snow and Ice Data Center (NSIDC) DAAC. Want to know about social and population data? Visit the Socioeconomic Data and Applications Data Center (SEDAC). These centers of excellence are our taxpayer money at work collecting, storing, and sharing earth systems data that are critical to science, sustainability, economy, and well-being.

What is the LP DAAC?
The Land Processes Distributed Active Archive Center (LP DAAC) is one of several discipline-specific data centers within the NASA Earth Observing System Data and Information System (EOSDIS). The LP DAAC is located at the USGS Earth Resources Observation and Science (EROS) Center in Sioux Falls, South Dakota. LP DAAC promotes interdisciplinary study and understanding of terrestrial phenomena by providing data for mapping, modeling, and monitoring land-surface patterns and processes. To meet this mission, the LP DAAC ingests, processes, distributes, documents, and archives data from land-related sensors and provides the science support, user assistance, and outreach required to foster the understanding and use of these data within the land remote sensing community.

Why am I here?
Each NASA DAAC has established a User Working Group (UWG). There are 18 people on the LP DAAC committee, 12 members from the land remote sensing community at large, like me! Some cool stuff going on. Such as...

New Sensors
Two upcoming launches are super interesting and important to what we are working on. First, GEDI (Global Ecosystem Dynamics Investigation) will produce the first high resolution laser ranging observations of the 3D structure of the Earth. Second, ECOSTRESS (The ECOsystem Spaceborne Thermal Radiometer Experiment on Space Station), will measure the temperature of plants: stressed plants get warmer than plants with sufficient water. ECOSTRESS will use a multispectral thermal infrared radiometer to measure surface temperature. The radiometer will acquire the most detailed temperature images of the surface ever acquired from space and will be able to measure the temperature of an individual farmer's field. Both of these sensors will be deployed on the International Space Station, so data will be in swaths, not continuous global coverage. Also, we got an update from USGS on the USGS/NASA plan for the development and deployment of Landsat 10. Landsat 9 comes 2020, Landsat 10 comes ~2027.

Other Data Projects
We heard from other data providers, and of course we heard from NEON! Remember I posted a series of blogs about the excellent NEON open remote sensing workshop I attended last year. NEON also hosts a ton of important ecological data, and has been thinking through the issues associated with cloud hosting. Tristin Goulden was here to give an overview.

Tools Cafe
NASA staff gave us a series of demos on their WebGIS services; AppEEARS; and their data website. Their webGIS site uses ArcGIS Enterprise, and serves web image services, web coverage services and web mapping services from the LP DAAC collection. This might provide some key help for us in IGIS and our REC ArcGIS online toolkits. AppEEARS us their way of providing bundles of LP DAAC data to scientists. It is a data extraction and exploration tool. Their LP DAAC data website redesign (website coming soon), which was necessitated in part by the requirement for a permanent DOI for each data product.

User Engagement
LP DAAC is going full-force in user engagement: they do workshops, collect user testimonials, write great short pieces on “data in action”, work with the press, and generally get the story out about how NASA LP DAAC data is used to do good work. This is a pretty great legacy and they are committed to keep developing it. Lindsey Harriman highlighted their excellent work here.

Grand Challenges for remote sensing
Some thoughts about our Grand Challenges: 1) Scaling: From drones to satellites. It occurs to me that an integration between the ground-to-airborne data that NEON provides and the satellite data that NASA provides had better happen soon; 2) Data Fusion/Data Assimilation/Data Synthesis, whatever you want to call it. Discovery through datasets meeting for the first time; 3) Training: new users and consumers of geospatial data and remote sensing will need to be trained; 4) Remote Sensible: Making remote sensing data work for society. 

A primer on cloud computing
We spent some time on cloud computing. It has been said that cloud computing is just putting your stuff on “someone else’s computer”, but it is also making your stuff “someone else’s problem”, because cloud handles all the painful aspects of serving data: power requirements, buying servers, speccing floor space for your servers, etc. Plus, there are many advantages of cloud computing. Including: Elasticity. Elastic in computing and storage: you can scale up, or scale down or scale sideways. Elastic in terms of money: You pay for only what you use. Speed. Commercial clouds CPUs are faster than ours, and you can use as many as you want. Near real time processing, massive processing, compute intensive analysis, deep learning. Size. You can customize this; you can be fast and expensive or slow and cheap. You use as much as you need. Short-term storage of large interim results or long-term storage of data that you might use one day.

Image courtesy of Chris Lynnes

Image courtesy of Chris Lynnes

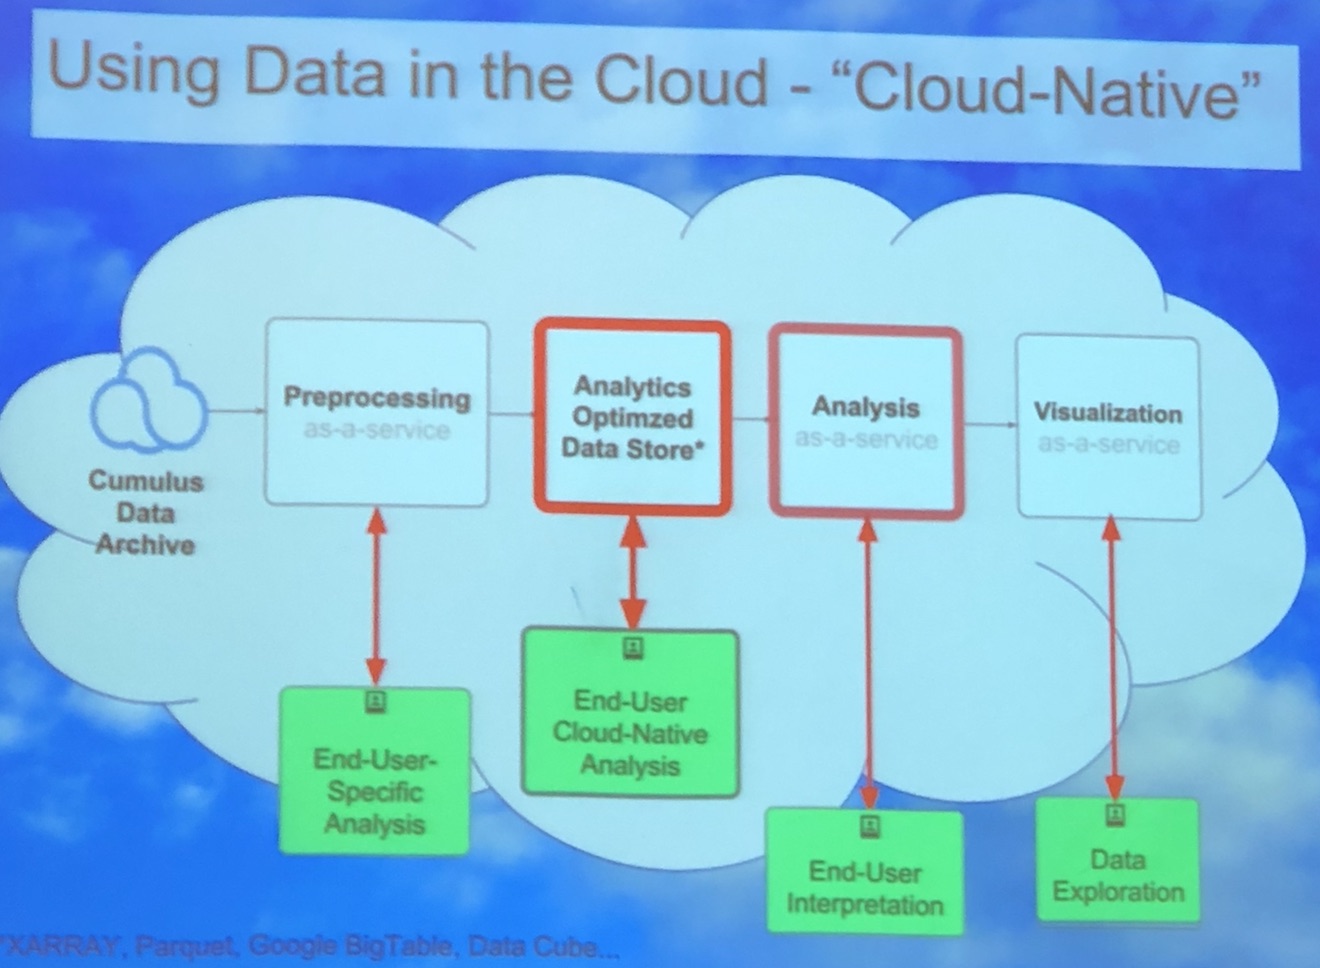
We can use the cloud as infrastructure, for sharing data and results, and as software (e.g. ArcGIS Online, Google Earth Engine). Above is a cool graphic showing one vision of the cloud as a scaled and optimized workflow that takes advantage of the cloud: from pre-processing, to analytics-optimized data store, to analysis, to visualization. Why this is a better vision: some massive processing engines, such as SPARC or others, require that data be organized in a particular way (e.g. Google Big Table, Parquet, or DataCube). This means we can really crank on processing, especially with giant raster stacks. And at each step in the workflow, end-users (be they machines or people) can interact with the data. Those are the green boxes in the figure above. Super fun discussion, leading to importance of training, and how to do this best. Tristan also mentioned Cyverse, a new NSF project, which they are testing out for their workshops.

Image attribution: Corey Coyle

Image attribution: Corey Coyle

Super fun couple of days. Plus: Wisconsin is green. And warm. And Lake Mendota is lovely. We were hosted at the University of Wisconsin by Mutlu Ozdogan. The campus is gorgeous! On the banks of Lake Mendota (image attribution: Corey Coyle), the 933-acre (378 ha) main campus is verdant and hilly, with tons of gorgeous 19th-century stone buildings, as well as modern ones. UW was founded when Wisconsin achieved statehood in 1848, UW–Madison is the flagship campus of the UW System. It was the first public university established in Wisconsin and remains the oldest and largest public university in the state. It became a land-grant institution in 1866. UW hosts nearly 45K undergrad and graduate students. It is big! It has a med school, a business school, and a law school on campus. We were hosted in the UW red-brick Romanesque-style Science Building (opened in 1887). Not only is it the host building for the geography department, it also has the distinction of being the first building in the country to be constructed of all masonry and metal materials (wood was used only in window and door frames and for some floors), and may be the only one still extant. How about that! Bye Wisconsin!
Wrap up from the Esri Imagery and Mapping Forum

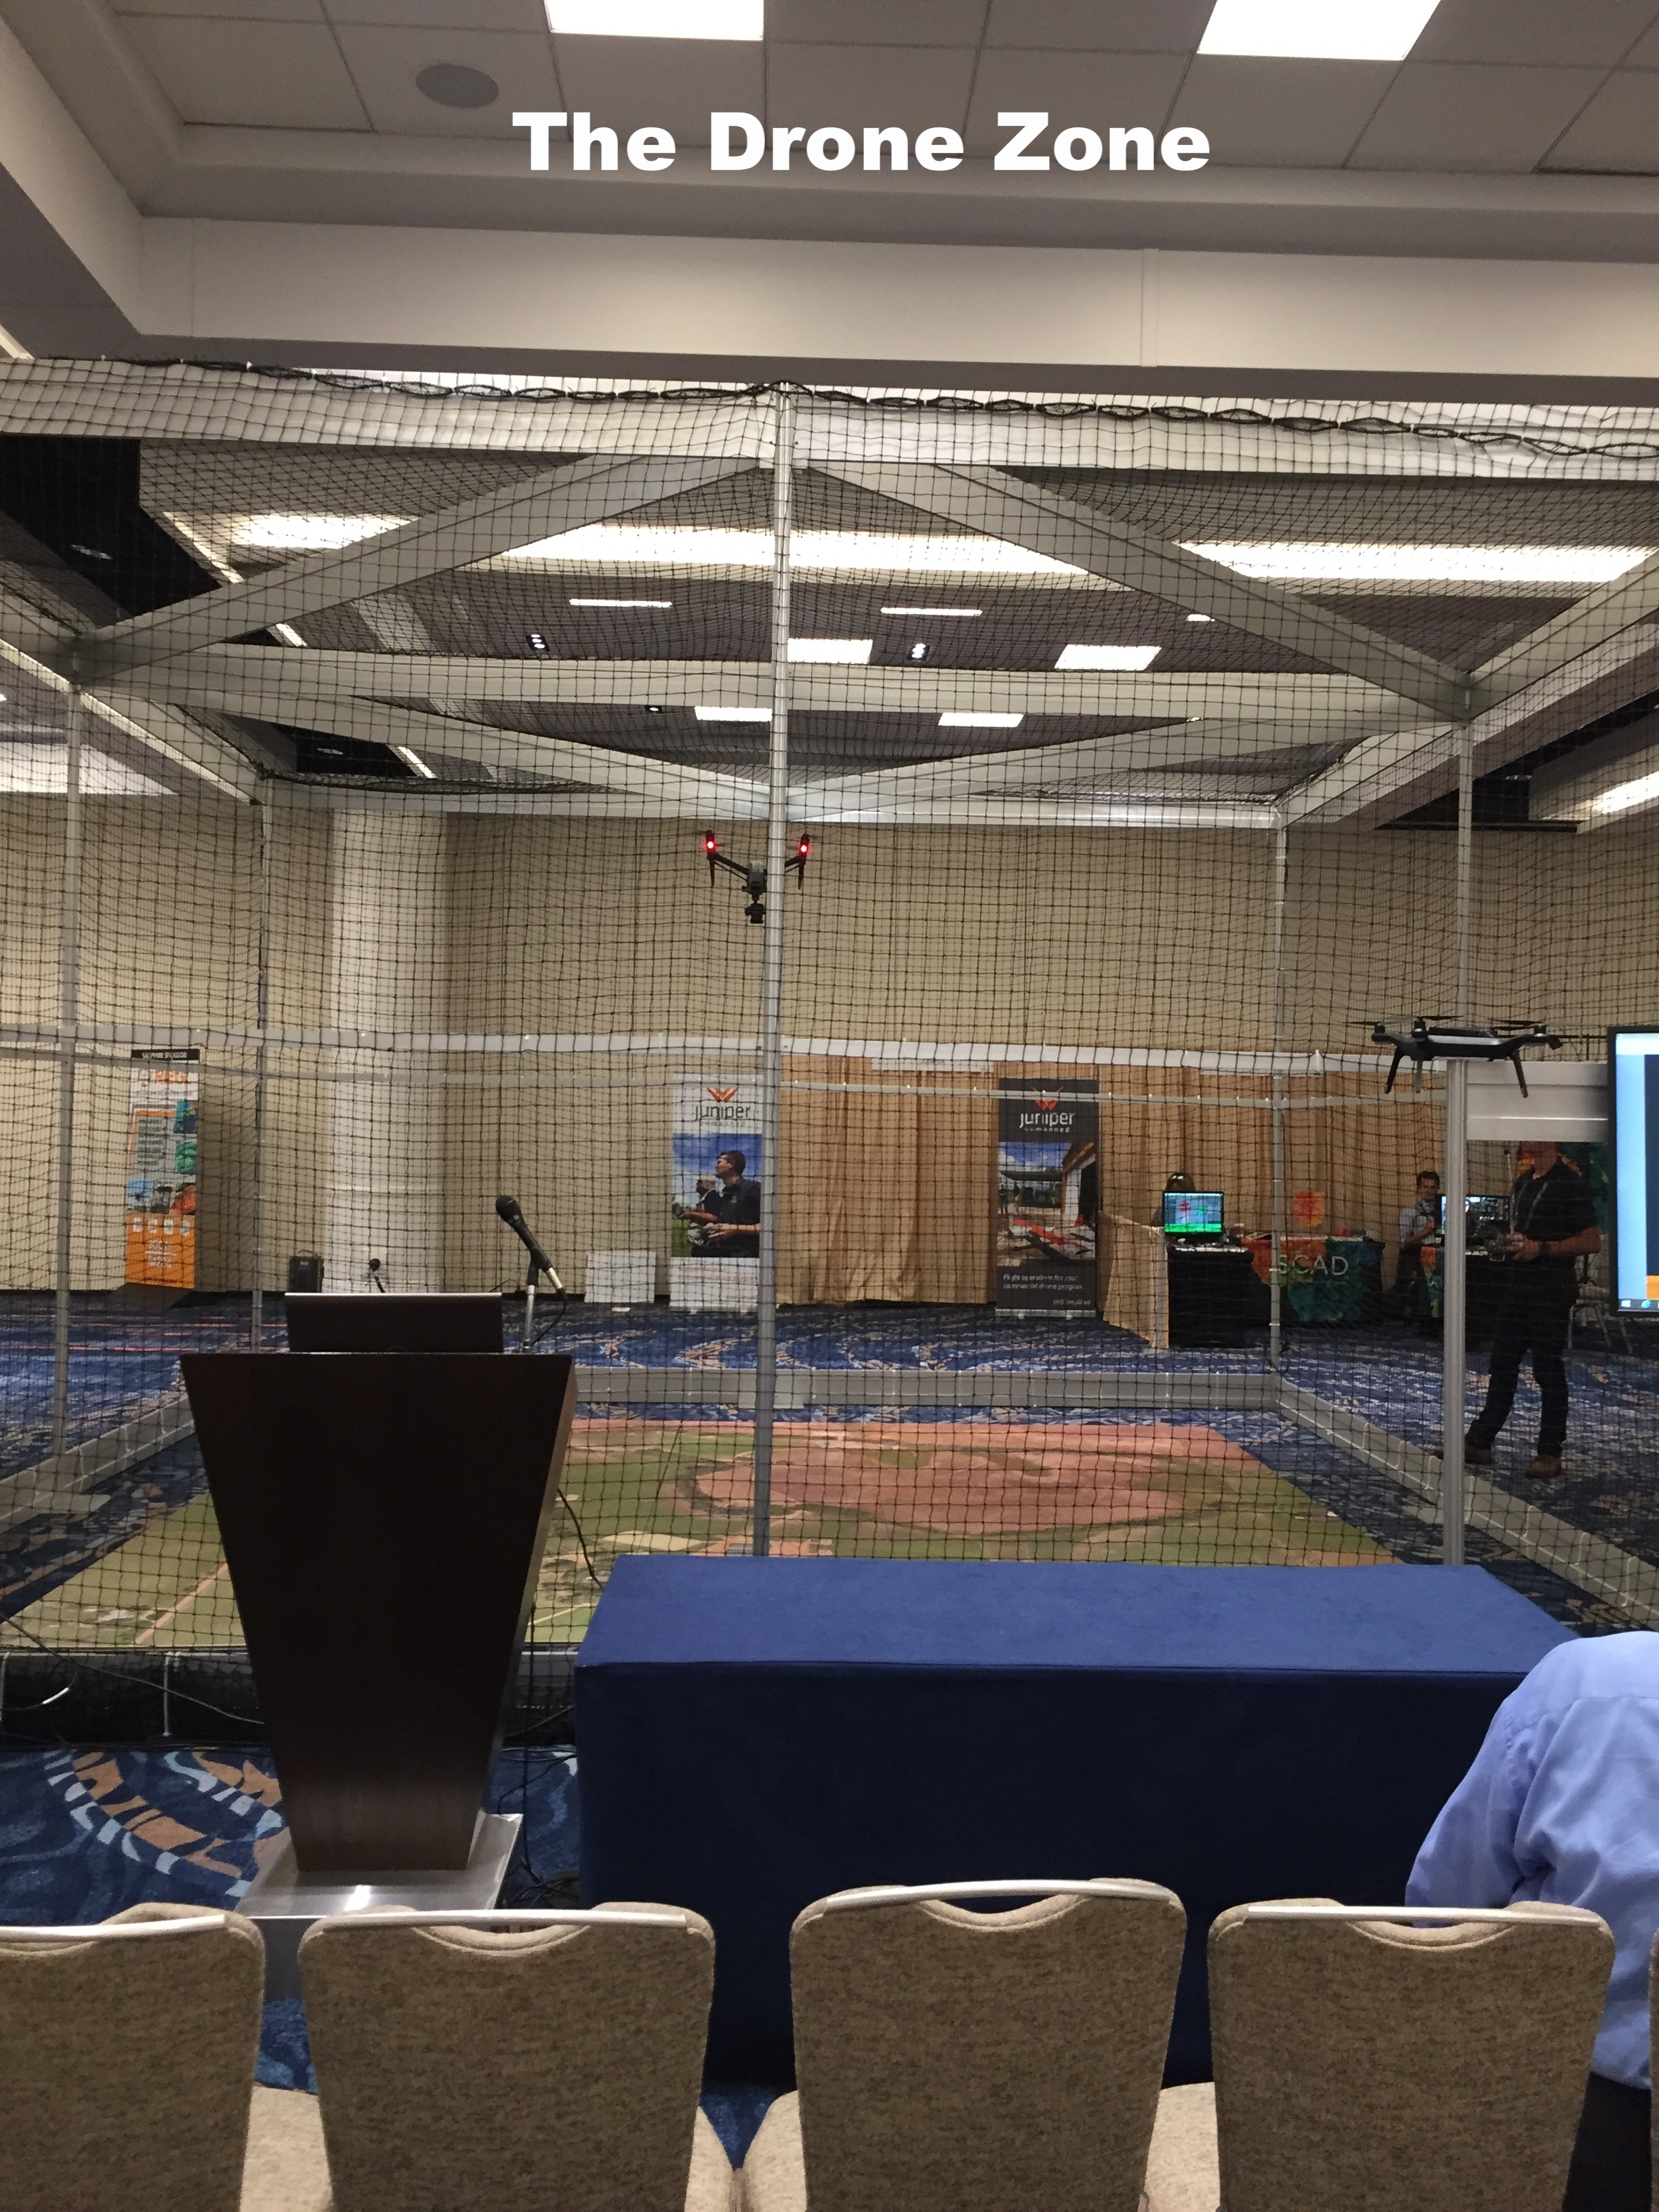
Recently, Esri has been holding an Imagery and Mapping Forum prior to the main User Conference. This year I was able to join as an invited panelist for the Executive Panel and Closing Remarks session on Sunday. During the day I hung out in the Imaging and Innovation Zone, in front of the Drone Zone (gotta get one of these for ANR). This was well worth attending: smaller conference - focused topics - lots of tech reveals - great networking. 

Notes from the day: Saw demos from a range of vendors, including:

  • Aldo Facchin from Leica gave a slideshow about the Leica Pegasus: Backpack. Their backpack unit workflow uses SLAM; challenges include fusion of indoor and outdoor environments (from transportation networks above and below ground). Main use cases were industrial, urban, infrastructure. http://leica-geosystems.com/en-us/products/mobile-sensor-platforms/capture-platforms/leica-pegasus-backpack
  • Jamie Ritche from Urthecast talked about "Bringing Imagery to Life". He says our field is "a teenager that needs to be an adult". By this he means that in many cases businesses don't know what they need to know. Their solution is in apps- "the simple and the quick": quick, easy, disposable and useful. 4 themes: revisit, coverage, time, quality. Their portfolio includes DEIMOS 1, Theia, Iris, DEIMOIS-2, PanGeo + . Deimos-1 focuses on agriculture. UrtheDaily: 5m pixels, 20TB daily, (40x the Sentinel output); available in 2019. They see their constellation and products as very comparable to Sentinel, Landsat, RapidEye. They've been working with Land O Lakes as their main imagery delivery. Stressing the ability of apps and cloud image services to deliver quick, meaningful information to users. https://www.urthecast.com/
  • Briton Vorhees from SenseFly gave an overview of: "senseFly's Drone Designed Sensors". They are owned by Parrot, and have a fleet of fixed wing drones (e.g. the eBee models); also drone optimized cameras, shock-proof, fixed lens, etc (e.g. SODA). These can be used as a fleet of sensors (gave an citizen-science example from Zanzibar (ahhh Zanzibar)). They also use Sequoia cameras on eBees for a range of applications. https://www.sensefly.com/drones/ebee.html
  • Rebecca Lasica and Jarod Skulavik from Harris Geospatial Solutions: The Connected Desktop". They showcased their new ENVI workflow implemented in ArcGIS Pro. Through a Geospatial Services Framework that "lifts" ENVI off the desktop; and creates an ENVI Engine. They showed some interesting crop applications - they call it "Crop Science". This http://www.harrisgeospatial.com/
  • Jeff Cozart and McCain McMurray from Juniper Unmanned shared "The Effectiveness of Drone-Based Lidar" and talked about the advantages of drone-based lidar for terrain mapping and other applications. They talked through a few projects, and highlighted that the main advantages of drone-based lidar are in the data, not in the economics per se. But the economies do work out too. (They partner with Reigl and YellowScan from France.)  They showcased an example from Colorado that compared lidar (I think it was a Reigl on a DJI Matrice) and traditional field survey - the lidar cost was 1/24th as expensive as the field survey. They did a live demo of ArcGIS tools with their CO data: classification of ground, feature extraction, etc. http://juniperunmanned.com/
  • Aerial Imaging Productions talked about their indoor scanning - this linking-indoor-to-outdoor (i.e. making point cloud data truly geo) is a big theme here. Also OBJ is a data format. (From Wikipedia: "The OBJ file format is a simple data-format that represents 3D geometry alone — namely, the position of each vertex, the UV position of each texture coordinate vertex, vertex normals, and the faces that make each polygon defined as a list of vertices, and texture vertices.") It is used in the 3D graphics world, but increasingly for indoor point clouds in our field.
  • My-Linh Truong from Riegl talked about their new static, mobile, airborne, and UAV lidar platforms. They've designed some mini lidar sensors for smaller UAVas (3lbs; 100kHz; 250m range; ~40pts/m2). Their ESRI workflow is called LMAP, and it relies on some proprietary REIGL software processing at the front end, then transfer to ArcGIS Pro (I think). http://www.rieglusa.com/index.html

We wrapped up the day with a panel discussion, moderated by Esri's Kurt Schwoppe, and including Lawrie Jordan from Esri, Greg Koeln from MDA, Dustin Gard-Weiss from NGA, Amy Minnick from DigitalGlobe, Hobie Perry from USFS-FIA, David Day from PASCO, and me. We talked about the promise and barriers associated with remote sensing and image processing from all of our perspectives. I talked alot about ANR and IGIS and the use of geospatial data, analysis and viz for our work in ANR. Some fun things that came out of the panel discussion were:

  • Cool stuff:
    • Lawrie Jordan started Erdas!
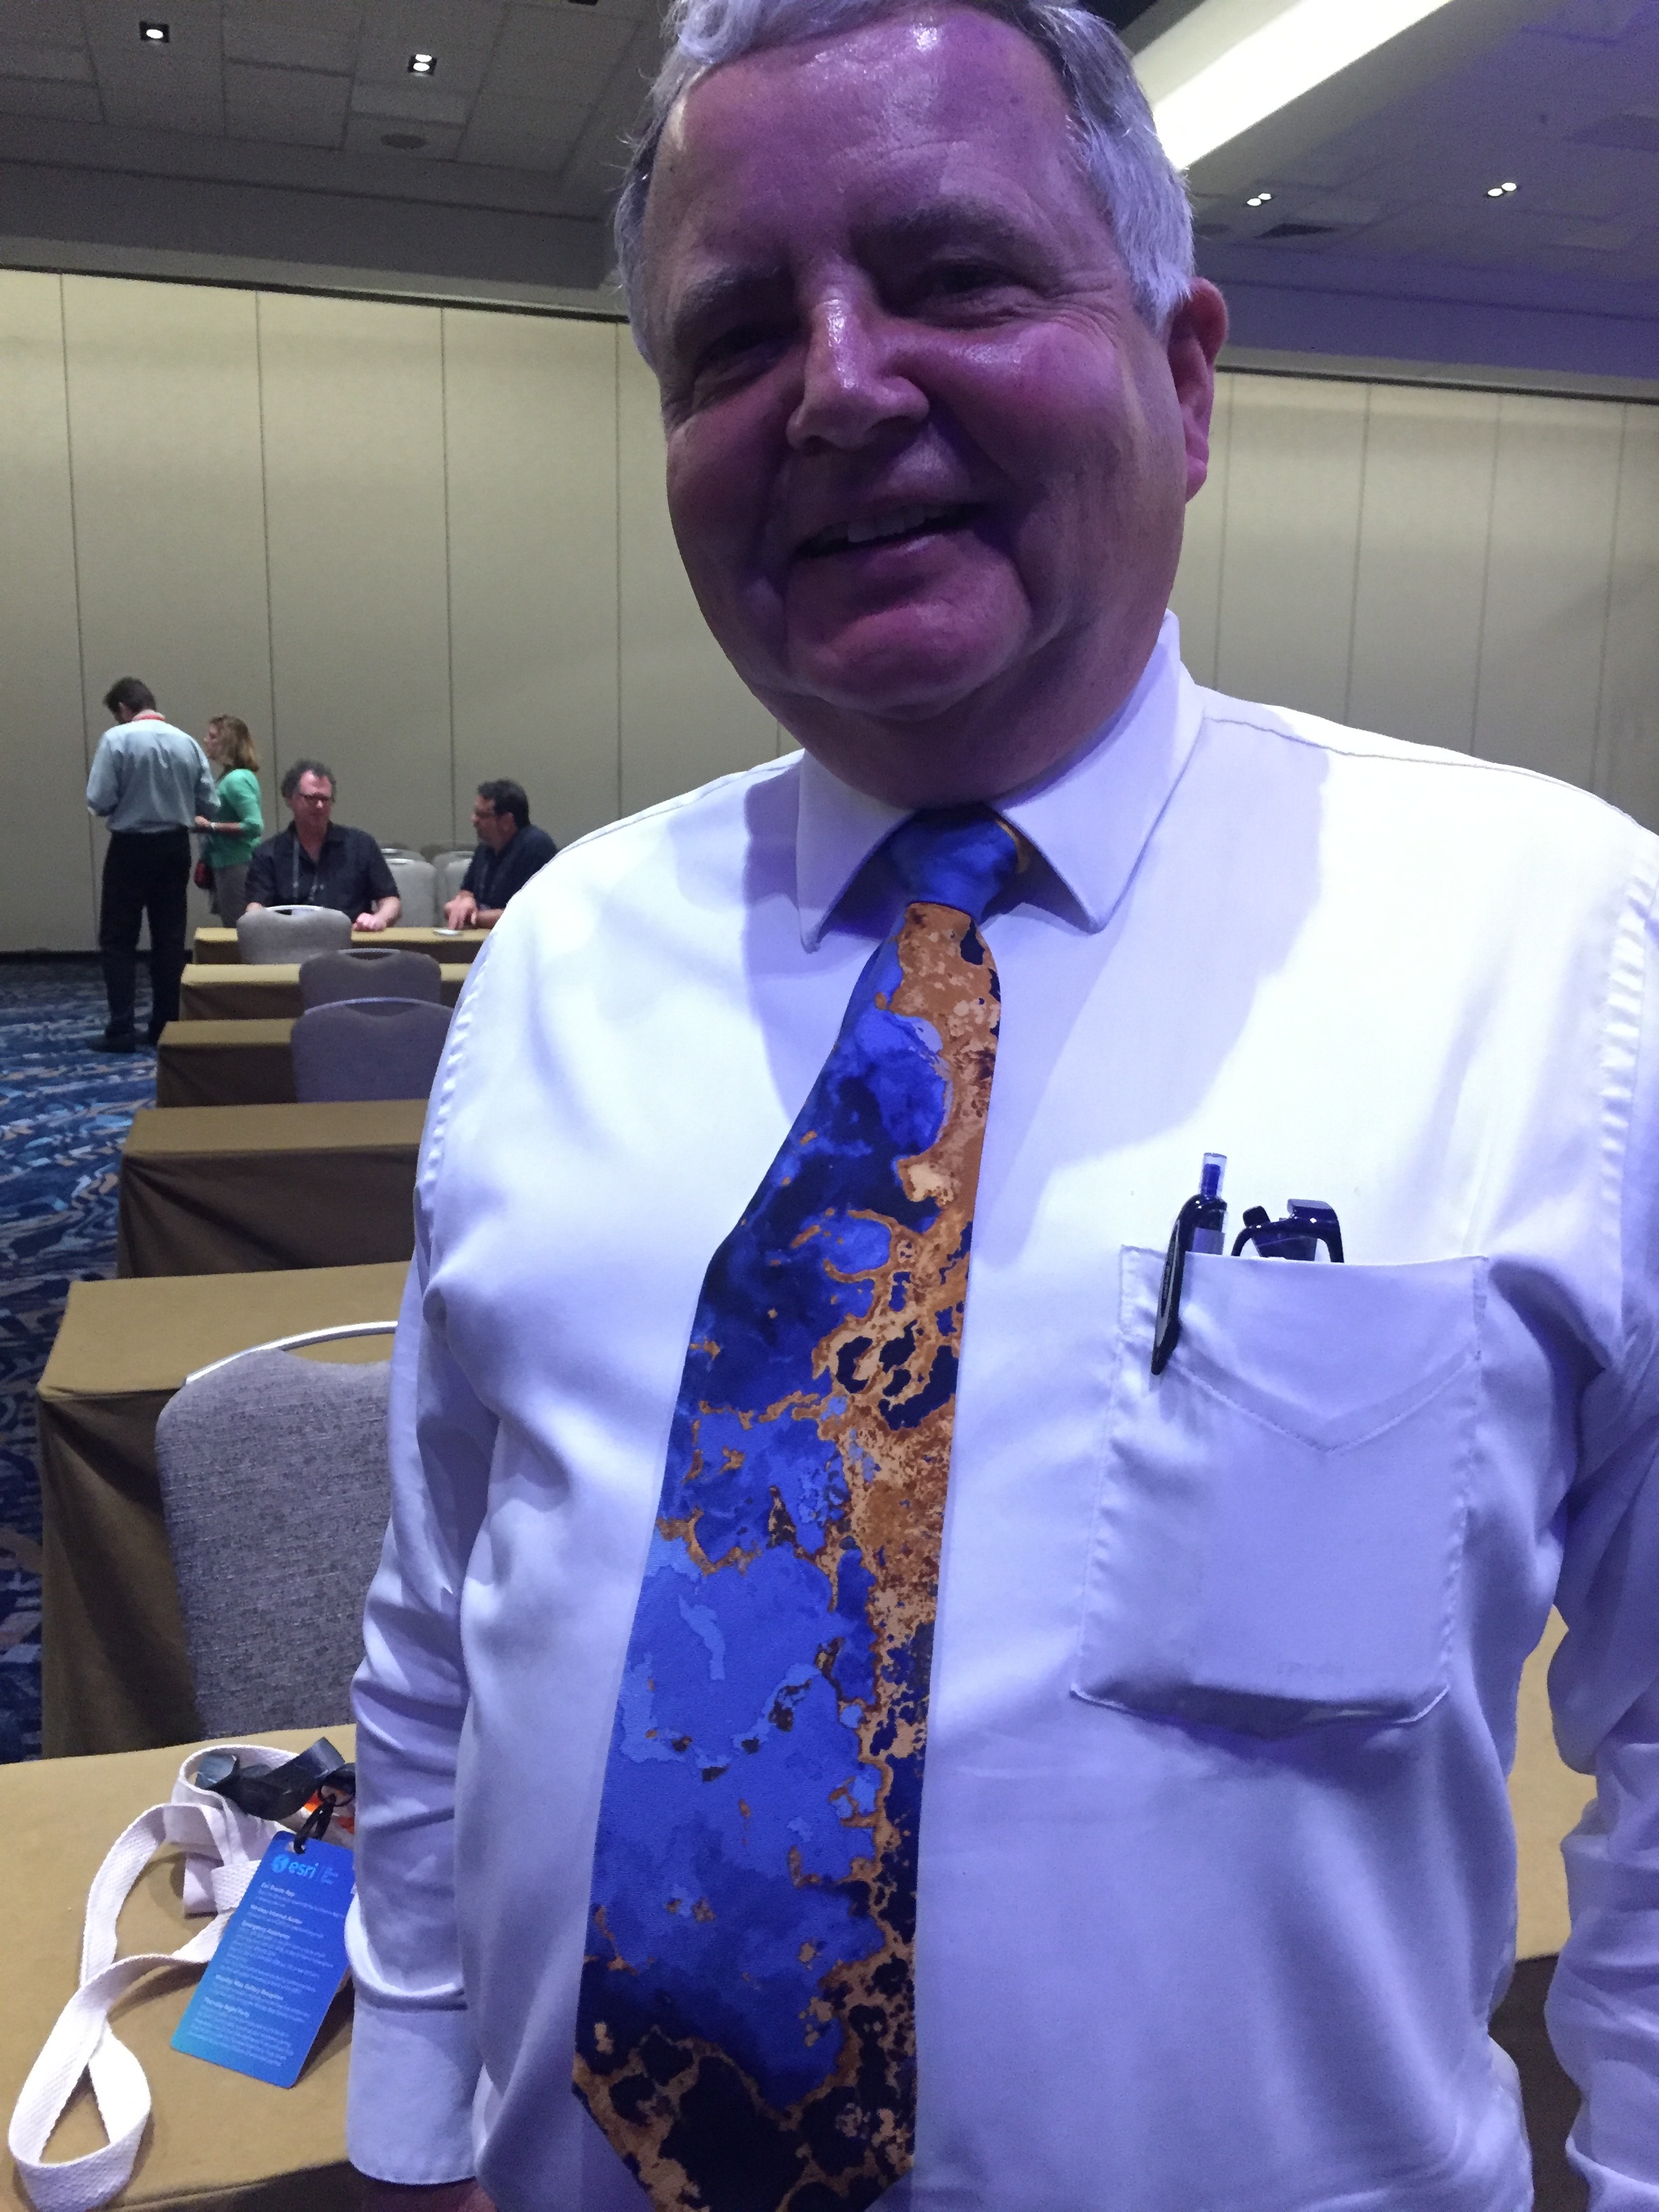
    • Greg Koeln wears Landsat ties (and has a Landsat sportcoat). 
    • Digital Globe launched their 30cm resolution WorldView-4. One key case study was a partnership with Associated Press to find a pirate fishing vessel in action in Indonesia. They found it, and busted it, and found on board 2,000 slaves.
    • The FIA is increasingly working on understanding uncertainty in their product, and they are moving for an image-base to a raster-based method for stratification.
    • Greg Koeln, from MDA (he of the rad tie- see pic below) says: "I'm a fan of high resolution imagery...but I also know the world is a big place".
  • Challenges: 
    • We all talked about the need to create actionable, practical, management-relevant, useful information from the wealth of imagery we have at our fingertips: #remotesensible. 
    • Multi-sensor triangulation (or georeferencing a stack of imagery from multiple sources to you and me) is a continual problem, and its going to get worse before it gets better with more imagery from UAVs. On that note, Esri bought the patent for "SIFT" a Microsoft algorithm to automate the relative registration of an image stack.
    • Great question at the end about the need to continue funding for the public good: ANR is critical here!
    • Space Junk.
  • Game-changers: 
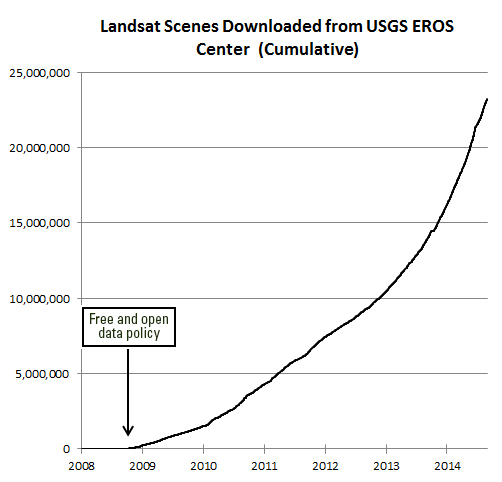
    • Opening the Landsat archive: leading to science (e.g. Hansen et al. 2013), leading to tech (e.g. GEE and other cloud-based processors). Greg pointed out that in the day, his former organization (Ducks Unlimited) paid $4,400 per LANDSAT scene to map wetlands nationwide! That's a big bill. 
    • Democratization of data collection: drones, smart phones, open data...
The panel in action

The panel in action

Notes and stray thoughts:

  • Esri puts on a quality show always. San Diego always manages to feel simultaneously busy and fun, while not being crowded and claustrophobic. Must be the ocean, the light and the air.
  • Trying to get behind the new "analytics" replacement of "analysis" in talks. I am not convinced everyone is using analytics correctly ("imagery analytics such as creating NDVI"), but hey, it's a thing now: https://en.wikipedia.org/wiki/Analytics#Analytics_vs._analysis
  • 10 years ago I had a wonderful visitor to my lab from Spain - Francisco Javier Lozano - and we wrote a paper: http://www.sciencedirect.com/science/article/pii/S003442570700243X. He left to work at some crazy startup company called Deimos in Spain, and Lo and Behold, he is still there, and the company is going strong. The Deimos satellites are part of the UrtheCast fleet. Small world!
  • The gender balance at the Imagery portion of the Esri UC is not. One presenter at a talk said to the audience with a pointed stare at me: "Thanks for coming Lady and Gentlemen".

Good fun! Now more from Shane and Robert at the week-long Esri UC!

ASTER Data Open - No April Fools!

We know about the amazing success for science, education, government, and business that has resulted from the opening of the Landsat archive in 2008. Now more encouraging news about open data:

On April 1, 2016, NASA's Land Processes Distributed Active Archive Center (LP DAAC) began distributing ASTER Level 1 Precision Terrain Corrected Registered At-Sensor Radiance (AST_L1T) data products over the entire globe at no charge. Global distribution of these data at no charge is a result of a policy change made by NASA and Japan.

The AST_L1T product provides a quick turn-around of consistent GIS-ready data as a multi-file product, which includes a HDF-EOS data file, full-resolution composite images (FRI) as GeoTIFFs for tasked telescopes (e.g., VNIR/SWIR and TIR ), and associated metadata files. In addition, each AST_L1T granule contains related products including low-resolution browse and, when applicable, a Quality Assurance (QA) browse and QA text report.

More than 2.95 million scenes of archived data are now available for direct download through the LP DAAC Data Pool and for search and download through NASA‘s Earthdata Search Client and also through USGS‘ GloVis , and USGS‘ EarthExplorer . New scenes will be added as they are acquired and archived.

ASTER is a partnership between NASA, Japan‘s Ministry of Economy, Trade and Industry (METI), the National Institute of Advanced Industrial Science and Technology (AIST) in Japan, and Japan Space Systems (J-spacesystems ).

Visit the LP DAAC ASTER Policy Change Page to learn more about ASTER. Subscribe to the LP DAAC listserv for future announcements.

GIF & IGIS from space

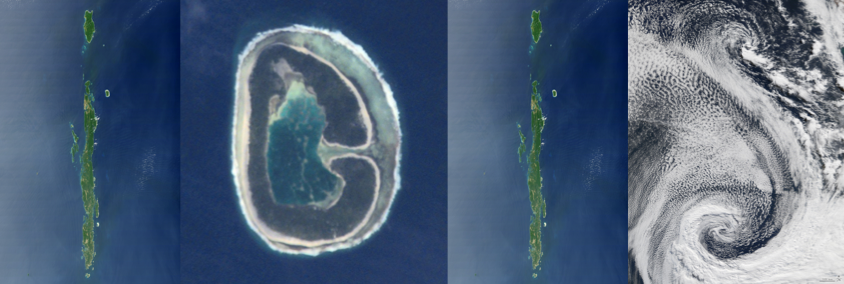
Made this for fun for the GIF & IGIS from NASA's "abcs from space" site: http://earthobservatory.nasa.gov/Features/ABC/. Was going to do "Kellylab" but ran out of time.

  • G: This image of Pinaki Island was captured by astronauts on the International Space Station in April 2001.
  • I: On February 10, 2007, the Moderate Resolution Imaging Spectroradiometer (MODIS) on NASA’s Terra satellite captured this image of the Andaman Islands. The thin, bright rings surrounding several of the islands are coral reefs that were lifted up by a massive earthquake near Sumatra in 2004.
  • F: The Operational Land Imager (OLI) on Landsat 8 acquired this false-color image of valleys and snow-covered mountain ranges in southeastern Tibet on August 4, 2014. Firn is a granular type of snow often found on the surface of a glacier before it has been compressed into ice.

  • I: On February 10, 2007, the Moderate Resolution Imaging Spectroradiometer (MODIS) on NASA’s Terra satellite captured this image of the Andaman Islands. The thin, bright rings surrounding several of the islands are coral reefs that were lifted up by a massive earthquake near Sumatra in 2004.
  • G: This image of Pinaki Island was captured by astronauts on the International Space Station in April 2001.
  • S: On April 29, 2009, the Moderate Resolution Imaging Spectroradiometer (MODIS) on the Terra satellite acquired this image of clouds swirling over the Atlantic Ocean.

Landsat Seen as Stunning Return on Public Investment

Undersanding the value of Landsat program to the U.S. economy has been the ambitious goal of the Landsat Advisory Group of the National Geospatial Advisory Committee. This team of commercial, state/local government, and NGO geospatial information experts recently updated a critical review of the value of Landsat information that has recently been released to the public.

They found that the economic value of just one year of Landsat data far exceeds the multi-year total cost of building, launching, and managing Landsat satellites and sensors.  This would be considered a stunning return on investment in any conventional business setting.

Full article by Jon Campbell, U.S. Geological Survey found here.

NLCD released and webinar April 15 2014

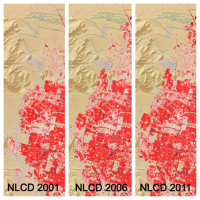
These three panels of cyclical data (2001, 2006, 2011) from the National Land Cover Database depict intervals of land cover change in the vicinity of Spring Valley, a suburb of Las Vegas, NV.[Source: USGS] Just released, the latest edition of the nation’s most comprehensive look at land-surface conditions from coast to coast shows the extent of land cover types from forests to urban areas. The National Land Cover Database (NLCD 2011) is made available to the public by the U.S. Geological Survey and partners.

Dividing the lower 48 states into 9 billion geographic cells, the massive database provides consistent information about land conditions at regional to nationwide scales. Collected in repeated five-year cycles, NLCD data is used by resource managers and decision-makers to conduct ecosystem studies, determine spatial patterns of biodiversity, trace indications of climate change, and develop best practices in land management.

Based on Landsat satellite imagery taken in 2011, NLCD 2011 describes the land cover of each 30-meter cell of land in the conterminous United States and identifies which ones have changed since the year 2006. Nearly six such cells — each 98 feet long and wide — would fit on a football field. Land cover is broadly defined as the biophysical pattern of natural vegetation, agriculture, and urban areas. It is shaped by both natural processes and human influences. NLCD 2011 updates the previous database version, NLCD 2006.

Webinar about the release will be Tuesday, April 15, 2014, 2:00 PM Eastern Time: "New Version of the National Land Cover Database - April 4, 2014 Release”

The latest version of the National Land Cover Database (NLCD) for the conterminous United States will be publicly released on April 4, 2014.  NLCD 2011 is the most up-to-date and extensive iteration of the National Land Cover Database, the definitive Landsat-based, 30-meter resolution land cover database for the Nation.  NLCD 2011 products are completely integrated with those of previous versions (2001, 2006), providing a 10-year record of change for the Nation.  Products include 16 classes of land cover, the percent of imperviousness in urban areas, and the percent of tree canopy cover. NLCD is constructed by the 10-member federal interagency Multi-Resolution Land Characteristics (MRLC) Consortium.   This seminar will highlight the new features of NLCD 2011 and the related applicationsCollin Homer, 605-594-2714, homer@usgs.gov)
For more information and to download NLCD data, visit http://www.mrlc.gov/.
Please click the following link to join the webinar:
 https://usgs.webex.com/usgs/j.php?ED=279876177&UID=490357047&RT=MiM3

At start time of the webinar, each location must call one of the dial-in numbers:
From the National Center in Reston, dial internally x4848
From all other USGS/DOI locations, dial 703-648-4848
From non DOI locations, dial toll free 855-547-8255
After the voice prompt, please enter the Conference Security Code 73848024 followed by the # key. You will hear a tone confirming that you have successfully joined the conference call. If you weren't successful, you will hear another voice prompt with instructions.

Happy Valentine's Day Landsat 8!

It's meta-gorgeous, and better than spy vs spy: Landsat 8 catches a glimpse of its older, retired uncle Landsat 5. From NASA:

Feb 14, 2014 • Eight months ago, on June 5, 2013, the U.S. Geological Survey decommissioned the venerable Landsat 5 satellite. That day, the USGS Landsat Flight Operations Team transmitted the last command to Landsat 5, effectively terminating the mission and leaving it in a disposal orbit.

This week, Landsat 8 overflew the defunct Landsat 5, and thanks to some clever work by Mike Gartley, a Research Scientist with the Digital Imaging and Remote Sensing group at Rochester Institute of Technology (RIT)—a group that has long participated in Landsat calibration and validation—Landsat 5 was seen in an image taken by Landsat 8.

In these images, the satellite is seen as a streak of pixels (dark or light depending on the spectral band). There is one image from each of Landsat 8′s OLI bands, except for Band 7, or SWIR-2, where she blended into the clouds and was impossible to distinguish. In these images Landsat 5 is much closer to Landsat 8 than she is to the Earth. More here.

Musings about Robert N. Colwell

I am working on a retrospective of remote sensing of forests in California for the centennial. I am trying to highlight some of the pioneering work done by remote sensors that focused on Californian forests from the 1960s through the use of lidar today.

Oblique aerial view of Berkeley Campus of University of California taken with Camouflage Detection film. Robert N. Colwell

Of course with this topic you must begin with Robert N. Colwell. Dr. Colwell was an internationally renowned remote sensing scientist; he was former associate director of the Space Sciences Laboratory at the UC Berkeley, and he was the instructor of remote sensing in our own Mulford Hall from 1947 until his retirement in 1983. He was NASA co-investigator for Apollo IX, and his research in the 1960s on reflectance and multispectral reconnaissance were the primary basis for selecting the type of sensors and the spectral bands implemented in Landsat. Neat guy, and we all benefit from his intellectual legacy.

Anyway, for this paper, I am going through some of his work as he transitioned from aerial photography to digital imaging, and I came across this picture. Mulford is just off the scene in the upper left corner, and Hearst Gym pool is visible in lower part. In his caption he says:

"Oblique aerial view of Berkeley Campus of University of California taken with Camouflage Detection film." (That is what they used to call color infrared.) "Such photography is superior to any other for certain photo interpretation purposes as indicated by some of the preceding examples. Note in this photo how color values for each species of tree tend to remain uniform from foreground to background because of the superior haze penetration offered by this film. The relatively long wavelengths to which this infrared-sensitive film reacts are scattered but very little by atmospheric haze particles, thus accounting for the uniform color values and for excellent image sharpness." I dig this part: "The original color transparencies have the same color values as seen here and consequently make very attractive panels for lamp shades, although certain of their colors fade upon prolonged exposure to light."

The trend for using map products as kitchy home decorations PRE-DATES 1970! Take that hipsters!

Article source: Colwell, R.N. 1964. Aerial photography - A valuable sensor for the scientist. American Scientist, Vol. 52, No. 1 (MARCH 1964), pp. 16-49

Some more about him here: http://senate.universityofcalifornia.edu/inmemoriam/robertcolwell.htm

Global forest change from Landsat and Google

The video describing the partnership and the product is available now.

A new high-resolution global map of forest loss and gain has been created with the help of Google Earth. The interactive online tool is publicly available and zooms in to a remarkably high level of local detail - a resolution of 30m. Snapshot of Russia here (green = forest, blue = gain, red = loss):

Russia has much forest activity

Results from time-series analysis of 654,178 Landsat images from 2000–2012 characterize forest extent and change. Between 2000 and 2012, according to this analysis, the Earth lost a combined "forest" the size of Mongolia. http://www.bbc.co.uk/news/science-environment-24934790

Here is the abstract from the accompanying paper in Science:

Quantification of global forest change has been lacking despite the recognized importance of forest ecosystem services. In this study, Earth observation satellite data were used to map global forest loss (2.3 million square kilometers) and gain (0.8 million square kilometers) from 2000 to 2012 at a spatial resolution of 30 meters. The tropics were the only climate domain to exhibit a trend, with forest loss increasing by 2101 square kilometers per year. Brazil’s well-documented reduction in deforestation was offset by increasing forest loss in Indonesia, Malaysia, Paraguay, Bolivia, Zambia, Angola, and elsewhere. Intensive forestry practiced within subtropical forests resulted in the highest rates of forest change globally. Boreal forest loss due largely to fire and forestry was second to that in the tropics in absolute and proportional terms. These results depict a globally consistent and locally relevant record of forest change.

Hansen, M.C.; Potapov, P.V.; Moore, R.; Hancher, M.; Turubanova, S.A.; Tyukavina, A.; Thau, D.; Stehman, S.V.; Goetz, S.J.; Loveland, T.R.; Kommareddy, A.; Egorov, A.; Chini, L.; Justice, C.O.; Townshend, J.R.G. High-Resolution Global Maps of 21st-Century Forest Cover Change. Science 2013, 342, 850-853

NASA shares satellite and climate data on Amazon’s cloud


NASA has announced a partnership with Amazon Web Services that the agency hopes will spark wider collaboration on climate research. In an effort that is in some ways parallel to Google's Earth Engine, NASA has uploaded terabytes of data to Amazon's public cloud and made it available to the anyone. 

Three data sets are already up at Amazon. The first is climate change forecast data for the continental United States from NASA Earth Exchange (NEX) climate simulations, scaled down to make them usable outside of a supercomputing environment. The other two are satellite data sets—one from from the US Geological Survey's Landsat, and the other a collection of Moderate Resolution Imaging Spectroradiometer (MODIS) data from NASA's Terra and Aqua Earth remote sensing satellites.

More Here

The art of remote sensing: Van Gogh in Space via Landsat

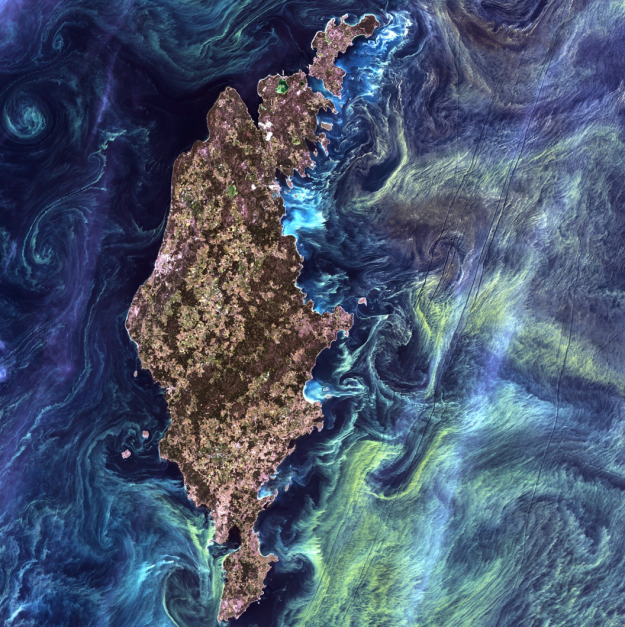
This image is making the rounds on social media, and it is a beaut. The Landsat program calls this one "Van Gogh from Space" - It was imaged July 13th, 2005. 

In the style of Van Gogh's painting "Starry Night," massive congregations of greenish phytoplankton swirl in the dark water around Gotland, a Swedish island in the Baltic Sea.In a recent paper by Michael Wulder and others discuss the tremendous benefits of the Landsat program on numerous scientific disciplines, and the overwhelming benefits to science of open access to the Landsat archive.

"Landsat occupies a unique position in the constellation of civilian earth observation satellites, with a long and rich scientific and applications heritage. With nearly 40 years of continuous observation – since launch of the first satellite in 1972 – the Landsat program has benefited from insightful technical specification, robust engineering, and the necessary infrastructure for data archive and dissemination. Chiefly, the spatial and spectral resolutions have proven of broad utility and have remained largely stable over the life of the program. The foresighted acquisition and maintenance of a global image archive has proven to be of unmatched value, providing a window into the past and fueling the monitoring and modeling of global land cover and ecological change."

Reference: Wulder, M.A.; Masek, J.G.; Cohen, W.B.; Loveland, T.R.; Woodcock, C.E. Opening the archive: How free data has enabled the science and monitoring promise of Landsat. Remote Sensing of Environment 2012,122, 2-10

Workshop wrap up: Google Earth Higher Education Summit 2013

For three days in late July 2013 Kevin Koy, Executive Director of the GIF and Maggi spent time at Google with 50+ other academics and staff to learn about Google Earth's mapping and outreach tools that leverage cloud computing. The meeting was called Google Earth for Higher Education Summit, and it was jam packed with great information and hands-on workshops. Former Kellylabber Karin Tuxen-Bettman was at the helm, with other very helpful staff (including David Thau - who gave the keynote at last year's ASPRS conference). Google Earth Outreach has been targeting non-profits and K-12 education, and are now increasingly working with higher education, hence the summit. We learned about a number of valuable tools for use in classrooms and workshops, a short summary is here.  

Google Mapping Tools - the familiar and the new

  • Google Earth Pro. You all know about this tool, increasing ability to plan, measure and visualize a site, and to make movies and maps and export data.
  • Google Maps Engine Lite. This is a free, lite mapping platform to import, style and embed data. Designed to work with small (100 row) spreadsheets.
  • Google Maps Engine Platform. The scaleable and secure mapping platform for geographic data hosting, data sharing and map making. streamlines the import of GIS data: you can import shapefiles and imagery. http://mapsengine.google.com.
  • Google Earth Engine. Data (40 years of global satellite imagery - Landsat, MODIS, etc.) + methods to analyze (Google's and yours, using python and javascript) + the Cloud make for a fast analytical platform to study a changing earth. http://earthengine.google.org/#intro
  • TimeLapse. A new tool showcasing 29 years of Landsat imagery, allows you to script a tour through a part of the earth to highlight change. Features Landsat 4, 5 7 at 30m, with clouds removed, colors normalized with MODIS. http://earthengine.google.org/
  • Field Mobile Data Collection. GME goes mobile, using Open Data Kit (ODK) - a way to capture structured data and locate it and analyze after home.
  • Google Maps APIs. The way to have more hands-on in map styling and publishing. developers.google.com/maps
  • Street View. They have a car in 32 countries, on 7 continents, and are moving into national parks and protected areas. SV is not just for roads anymore. They use trikes, boats, snowmobiles, trolleys; they go underwater and caves, backpacks.

Here are a couple of my first-cuts:

Landsat 8 imagery available

From Kelly:

Data collected by the Operational Land Imager (OLI) and the Thermal Infrared Sensor (TIRS) onboard the Landsat 8 satellite are available to download at no charge from GloVis, EarthExplorer, or via the LandsatLook Viewer

Orbiting the Earth every 99 minutes, Landsat 8 images the entire Earth every 16 days in the same orbit previously used by Landsat 5. Data products are available within 24 hours of reception. Check it.

Google Timelapse

Google recently released the Timelapse project, hosted by Time Magazine, which shows Landsat images from 1984 to today in a timelapse video animation for the entire globe. The viewer allows users to navigate to any spot on the globe via place name and visualize changes on the earth’s surface over the time period captured by Landsat. Google highlights specific areas of interest such as Dubai, Las Vegas, and the Amazon.

Click the image below for more info and to access the site:

Screenshot of Google Timelapse on Time.com

LDCM releases first images of Earth!

Turning on new satellite instruments is like opening new eyes. This week, the Landsat Data Continuity Mission (LDCM) released its first images of Earth, collected at 1:40 p.m. EDT on March 18. The first image shows the meeting of the Great Plains with the Front Ranges of the Rocky Mountains in Wyoming and Colorado. The natural-color image shows the green coniferous forest of the mountains coming down to the dormant brown plains. The cities of Cheyenne, Fort Collins, Loveland, Longmont, Boulder and Denver string out from north to south. Popcorn clouds dot the plains while more complete cloud cover obscures the mountains.

Much more on the story and the images here:

http://www.nasa.gov/mission_pages/landsat/news/first-images-feature.html

Update from LDCM

Some updates from this video from NASA:

  • Imagery should be available late May 2013
  • Landsat 7 has enough fuel to last until 2016
  • LCDM has a 5 year mission, but they are hopeful for a 10 year mission
  • Data continuity is the key to this whole deal: "continuity drives landsat"
  • High resolution data does not have the temporal resolution as Landsat - via Kass G.

Very excited.

LDCM FAQ here.


Landsat 8 is up and orbiting!

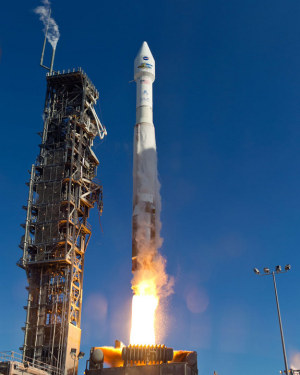
Atlas 5 Rocket With Landsat PayloadFun day today watching the LDCM (Landsat Data Continuity Mission) make its successful launch of the newest and coolest sensor in the Landsat family. The flawless launch from Vandenburg AFB was witnessed with lots of cheering and earth-themed cupcakes in Mulford Hall!

While I am not actively using Landsat imagery, I used Landsat 4 and 5 imagery for my dissertation, back in the day, and use it still to introduce geographic concepts in class. And I am super excited to see the new imagery. The sensor has similar spectral bands to the ETM+ sensor on Landsat 7, but also I think includes a new coastal aerosol band (443 nm) and cirrus detection band (1375 nm). The legacy of the Landsat program is tremendous; the program has given us reliable, comprehensive, and detailed views of a dynamic earth for decades. It is a government sponsored science program with lasting impact.

Some nice write-ups about Landsat:

NASA Earth Observatory Landsat Looks and Sees
NASA Landsat: http://www.nasa.gov/mission_pages/landsat/main/index.html
USGS Landsat Missions: http://landsat.usgs.gov/
Landsat Top 10: http://www.nasa.gov/mission_pages/landsat/news/landsat-40th-top10.html

Anyway, it was nice to have everyone on board to witness the launch! Thanks GIF folks and everyone else in the lab. Now we just have to watch out for DA14 on Friday!

New Landsat Satellite set to launch Feb 11th

NASA's Landsat Data Continuity Mission (LDCM) is scheduled to launch Feb. 11 from Vandenberg Air Force Base in California. A joint NASA and U.S. Geological Survey (USGS) mission, LDCM will add to the longest continuous data record of Earth's surface as viewed from space.

LDCM is the eighth satellite in the Landsat series, which began in 1972. The mission will extend more than 40 years of global land observations that are critical in many areas, such as energy and water management, forest monitoring, human and environmental health, urban planning, disaster recovery and agriculture. NASA and the USGS jointly manage the Landsat Program. Check out more info.