Planet Lab wants YOU to work with their data!

They say: 

Are you a college student, researcher or professor? We’re looking for innovative academics, researchers and scientists to unlock the power of a one-of-a-kind dataset. You can now apply for access to Planet’s unique dataset for non-commercial research purposes. In an area as large as 2,000 square kilometers, you’ll have access to download imagery, analyze trends, and publish your results.

Check it: https://www.planet.com/products/education-and-research/

ISECCI historical ecology working group wrap-up

Last week Kelly and I with others travelled to the Sierra Nevada Aquatic Research Lab (SNARL) in the eastern Sierra Nevada, just south of Mono Lake for a research retreat. SNARL is part of the UC's Natural Reserve System, which is comprised of nearly 40 properties across the state. These are preserves that foster research, education and collaboration. They have much in common with ANR's REC system. I've been to a few of them now, and am very pleased to make more visits. I love the east side of the Sierra, and that iconic Highway 395. 

This trip was a retreat for the ISECCI historical ecology working group, led by the inspirational Peter Alagona from UCSB. We discussed our existing projects, including the VTM work (see figure below), and talked about potentials for more collaborative research and further integration between NRS and ANR. We have a list of wishes for digitization, and if anyone out there has ideas about pitching these to donors, please let me know. For example: 

  • Kelly and I want to digitize the Leiburg maps from the northern Sierra to add to the VTM stack;
  • We want to find a better way to index and view historical aerial photography state-wide. Something like this for historical maps: http://ngmdb.usgs.gov/maps/TopoView/help/

And we had a field trip looking at Mono Lake water issues. Great time spent!

Density of VTM features across the collections

Hopland Bioblitz is on!

Our big Hopland scientific bioblitz is this weekend (9-10 April, with some events on the 8th) and I look forward to seeing many of you there. If you can't make it to HREC, there are many ways you can remotely help us and check out what is happening all weekend long.

HELP US OUT. http://www.inaturalist.org/ Many people will be using iNaturalist to make and share observations. Helping out the effort is easy. Look for observations at the iNaturalist site by searching for "Hopland" in the "Projects" pulldown menu and choose "Hopland Research Extension Center". Once there, you can browse the plants and animals needing identification and needing confirmation. Every identification counts toward our goal of massively increasing the knowledge of the HREC's flora and fauna.

VOTE ON IMAGES.  http://www.hoplandbioblitz.org/ We are hosting an image contest for the plants and animals of HREC. Great prizes will be given  for images that get the most votes(REI gift cards and a GoPro grand prize!). Please visit the site and vote for your favorites frequently during the weekend and share them and then sit back and what the slide show.  

CHECK US OUT. http://geoportal.ucanr.edu/# Our new app will graphically show you our progress for the bioblitz observations. Results will be updated every 15 minutes. See how your favorite groups are doing in the challenge to document as many species as possible.

Look for #HoplandBioblitz on Twitter and Instagram

Follow along on Facebook https://www.facebook.com/HoplandREC/

LandFire is looking for field data! Add yours now.

I wanted to send out a friendly reminder that the data submission deadline for the current data call is March 31, 2016.  Data submitted before March 31 are evaluated for inclusion in the appropriate update cycle, and submissions after March 31 are typically considered in subsequent updates.  

This is the last call for vegetation/fuel plot data that can be used for the upcoming LANDFIRE Remap. If you have any plot data you would like to contribute please submit the data by March 31 in order to guarantee the data will be evaluated for inclusion in the LF2015 Remap. LANDFIRE is also accepting contributions of polygon data from 2015/2016 for disturbance and treatment activities. Please see the attached data call letter for more information.

Brenda Lundberg, Senior Scientist

Stinger Ghaffarian Technologies (SGT, Inc.)

Contractor to the U.S. Geological Survey (USGS)

Earth Resources Observation & Science (EROS) Center

Phone: 406.329.3405

Email: blundberg@usgs.gov

Our summary from SNAMP: 31 integrated recommendations

The following forest management recommendations consider the SNAMP focal resources (forest, water, wildlife), as well as public participation, as an integrated group. These recommendations were developed by the UC Science Team working together. Although each recommendation was written by one or two authors, the entire team has provided input and critique for the recommendations. The entire UC Science Team endorses all of these integrated management recommendations. Click at the bottom of the post for the full description of each recommendation. 

Section 1: Integrated management recommendations based directly on SNAMP science

Wildfire hazard reduction

1. If your goal is to reduce severity of wildfire effects, SPLATs are an effective means to reduce the severity of wildfires. 

SPLAT impacts on forest ecosystem health 

2. If your goal is to improve forest ecosystem health, SPLATs have a positive effect on tree growth efficiency.

SPLAT impact assessment

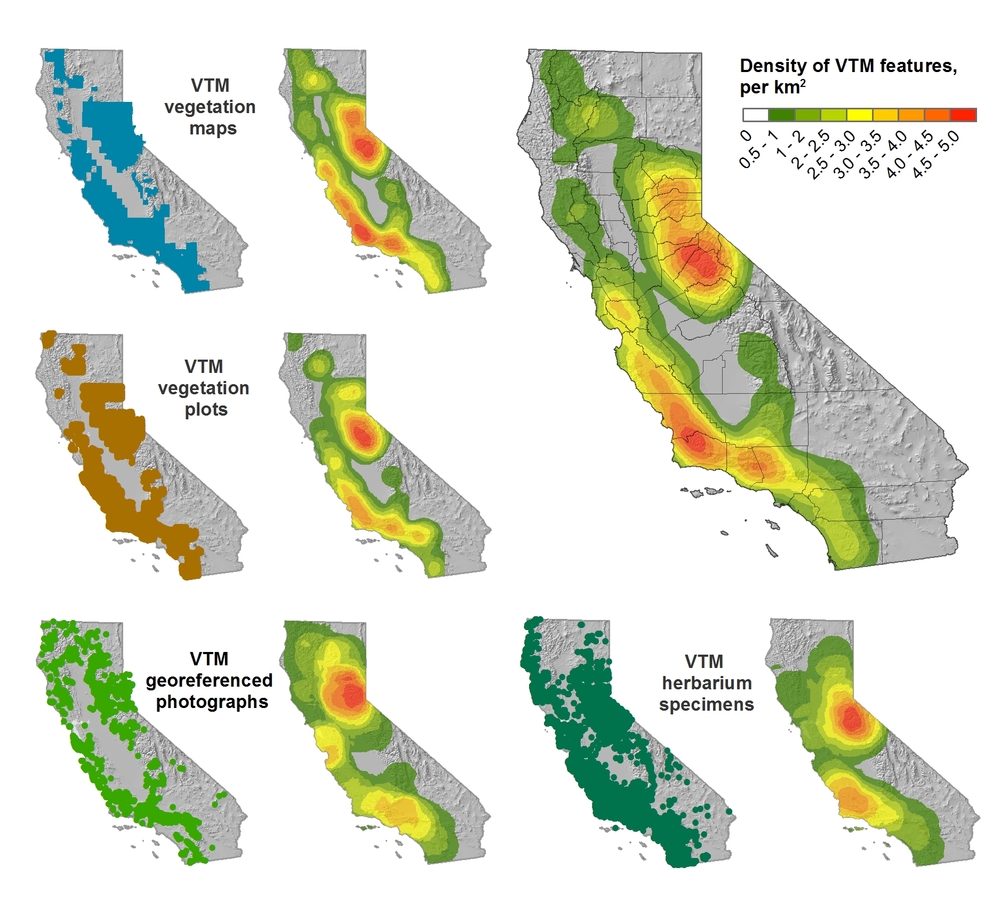
3. If your goal is to integrate across firesheds, an accurate vegetation map is essential, and a fusion of optical, lidar and ground data is necessary. 

4. If your goal is to understand the effects of SPLATs, lidar is essential to accurately monitor the intensity and location of SPLAT treatments.

SPLAT impacts on California spotted owl and Pacific fisher

5. If your goal is to maintain existing owl and fisher territories, SPLATs should continue to be placed outside of owl Protected Activity Centers (PACs) and away from fisher den sites, in locations that reduce the risk of high-severity fire occurring within or spreading to those areas.

6. If your goal is to maintain landscape connectivity between spotted owl territories, SPLATs should be implemented in forests with lower canopy cover whenever possible.

7. If your goal is to increase owl nest and fisher den sites, retain oaks and large conifers within SPLAT treatments.

8. If your goal is to maintain fisher habitat quality, retention of canopy cover is a critical consideration.

9. If your goal is to increase fisher foraging activity, limit mastication and implement more post-mastication piling and/or burning to promote a faster recovery of the forest floor condition. 

10. If your goal is to understand SPLAT effects on owl and fisher, it is necessary to consider a larger spatial scale than firesheds.

SPLAT impacts on water quantity and quality

11. If your goal is to detect increases in water yield from forest management, fuel treatments may need to be more intensive than the SPLATs that were implemented in SNAMP.

12. If your goal is to maintain water quality, SPLATs as implemented in SNAMP have no detectable effect on turbidity.

Stakeholder participation in SPLAT implementation and assessment

13. If your goal is to increase acceptance of fuel treatments, employ outreach techniques that include transparency, shared learning, and inclusiveness that lead to relationship building and the ability to work together.

14. If your goal is the increased acceptance of fuel treatments, the public needs to understand the tradeoffs between the impacts of treatments and wildfire.

Successful collaborative adaptive management processes

15. If your goal is to establish a third party adaptive management project with an outside science provider, the project also needs to include an outreach component.

16. If your goal is to develop an engaged and informed public, you need to have a diverse portfolio of outreach methods that includes face to face meetings, surveys, field trips, and web-based information.

17. If your goal is to understand or improve outreach effectiveness, track production, flow, and use of information.

18. If your goal is to engage in collaborative adaptive management at a meaningful management scale, secure reliable long term sources of funding.

19. If your goal is to maintain a successful long-term collaborative adaptive management process, establish long-term relationships with key people in relevant stakeholder groups and funding agencies.

Section 2: Looking forward - Integrated management recommendations based on expert opinion of the UC Science Team

Implementation of SPLATs

20. If your goal is to maximize the value of SPLATs, complete treatment implementation, especially the reduction of surface fuels.

21. If your goal is to efficiently reduce fire behavior and effects, SPLATs need to be strategically placed on the landscape.

22. If your goal is to improve SPLAT effectiveness, increase heterogeneity within treatment type and across the SPLAT network.

Forest ecosystem restoration

23. If your goal is to restore Sierra Nevada forest ecosystems and improve forest resilience to fire, SPLATs can be used as initial entry, but fire needs to be reintroduced into the system or allowed to occur as a natural process (e.g., managed fire).

24. If your goal is to manage the forest for long-term sustainability, you need to consider the pervasive impacts of climate change on wildfire, forest ecosystem health, and water yield.

Management impacts on California spotted owl and Pacific fisher 

25. If your goal is to enhance landscape habitat condition for owl and fisher, hazard tree removal of large trees should be carefully justified before removing.

26. If your goal is to minimize the effects of SPLATs on fisher, SPLAT treatments should be dispersed through space and time.

Management impacts on water quantity and quality

27. If your goal is to optimize water management, consider the range of potential fluctuations in precipitation and temperature.

Successful collaborative adaptive management processes

28. If your goal is to implement collaborative adaptive management, commit enough time, energy, and training of key staff to complete the adaptive management cycle.

29. The role of a third party science provider for an adaptive management program can be realized in a variety of ways.

30. If the goal is to implement adaptive management, managers must adopt clear definitions and guidelines for how new information will be generated, shared, and used to revise subsequent management as needed.

31. If your goal is to increase forest health in the Sierra Nevada, we now know enough to operationalize some of the aspects of SNAMP more broadly.

Read More

SNAMP wrap up: Forest Service should implement proposed forest treatments

SNAMP field trip: photo from Shufei LeiFull press release: http://ucanr.edu/?blogpost=19857&blogasset=81020

After conducting extensive forest research and taking into consideration all aspects of forest health – including fire and wildlife behavior, water quality and quantity – a group of distinguished scientists have concluded that enough is now known about proposed U.S. Forest Service landscape management treatments for them to be implemented in Sierra Nevada forests. We say:

“There is currently a great need for forest restoration and fire hazard reduction treatments to be implemented at large spatial scales in the Sierra Nevada.”

“The next one to three decades are a critical period: after this time it may be very difficult to influence the character of Sierra Nevada forests, especially old forest characteristics.”

The scientists' recommendation is in the final report of a unique, 10-year experiment in collaboration: the Sierra Nevada Adaptive Management Project (SNAMP). A 1,000-page final report on the project was submitted to the U.S. Forest Service at the end of 2015. In it, scientists reached 31 points of consensus about managing California forests to reduce wildfire hazards and protect wildlife and human communities.

SNAMP – funded with $15 million in grants mainly from the U.S. Forest Service, with support from U.S. Fish and Wildlife, California Natural Resources Agency and University of California – ran from 2007 to 2015. The project ended with the submission of the final report that contains details about the study areas, the treatment processes and reports from each of the six science teams. The science teams and their final reports are:

A key chapter in the publication is titled Integrated Management Recommendations. In it, the 31 points of consensus are outlined.

“The integration in this project is also unique,” Susie Kocher, CE advisor said. “Scientists tend to work in their own focus areas, but we can learn a lot from each other's research projects.”

Karin in the news! Google camera helps capture bay’s rising sea levels

Neat article about Google teaming up with the nonprofit San Francisco Baykeeper to use Google Street View technology to map tides and sea level rise around the Bay. Former kellylabber Karin Tuxen-Bettman is involved. 

http://www.sfgate.com/bayarea/article/Google-camera-helps-capture-bay-s-rising-sea-6080481.php#photo-7524438

Find related research based on location and biophysical attributes: Map search

Check it out: another way to search for research. JournalMap is a scientific literature search engine that empowers you to find relevant research based on location and biophysical attributes combined with traditional keyword searches. It works ok, I found one of my papers, not others. But the interface it quick and intuitive.

http://www.journalmap.org/

NEW VTM Reshoot!

Take a look at this awesome VTM reshoot from the folks over at Geographic Resource Solutions (GRS), photographed during a recent mapping project of Lassen Volcanic National Park. Yet another great example and an incredible testament to lasting power of the VTM dataset. This particular photo was taken near the Chaos Crags Jumble in Lassen Volcanic National Park. Thanks to Ken Stumpf and GRS for sharing!

Albert Wieslander (October 1, 1925): Looking N 35 degrees W from 1/4 corner 16/17 T 31-4. Foreground dwarf timber on glacial deposit. Slope in background, section 7 and 8 Tyler Brown of GRS (September,2011): At Accuracy Assessment Site 091646 located in the Chaos Crags Jumble in Lassen Volcanic National Park

In a similar vein I recently stumbled upon another meshing of historical and contemporary photographs. The project features reshoots of the Grand Canyon and resulted in a 2012 book titled: Reconstructing the View: The Grand Canyon Photographs of Mark Klett and Byron Wolfe

Published by University of California Press. You can see a few of the photographer’s recent projects on their website. Historical photos are just the best!


2014 Western Section of the Wildlife Society Meeting wrap-up

I recently attended the 2014 annual meeting of the Western Section of the Wildlife Society in Reno CA. The focus of the conference was on harnessing citizen science toward greater conservation.

I saw some interesting talks in my session (I was clearly the odd-talk-out in a session dominated by animal tracking (I spoke about our SNAMP website evaluation)). For example:

  • Peter Bloom discussed red-tailed hawk movements from banded bird recovery. The birds are banded as juveniles and observed by citizens and scientists. In this way their movements can be mapped: across southern California, across the Pacific flyway, and across the US.
  • Joe Burnett presented on the use of GSM transmitters to track California condor (the largest flying bird in north America) movement patterns. He caught us up on condor recovery and current threats (lead poisoning from foraging on wild game) to condors. He showed some very nice visualizations of wild condor flights between Ventana and the Pinnacles (including some stops for water and dead animal chomping) from the GSM transmitters and Google Earth. 
  • Shannon Rich looked at migration patterns of flammulated owls using light-level geolocators. "What is a flammulated owl”? you say: I will tell you. They are super cute tiny owls, with neat flame-like markings on their face and body. Geolocators are small (~1g) that record ambient light levels during the day, and from timing of sunrise and sunset, you can get latitude and longitude. These are not sending out signals, and you need to recapture the owl to download data. As always, I am stunned by the dedication and time it takes for wildlife biologists to gather their careful data on animal movement.
  • Russ Bryant talked about native honeybee habitat in North Dakota. He talked about the important services that bees give us: 95 agricultural plants benefit from pollination services (estimated at $15b). I did not know that ND is the top honey producer in the US. Colony collapse across the US has been profound. They used INVEST to explore the role of land cover and bee pollination to produce a pollinator habitat index, and a habitat connectivity for areas where bees had been captured. 

In the climate change session, I heard from a range of speakers on practical adaptation strategies, curriculum for climate change education (Whitney Albright), new tools and reports for grassland bird species conservation (Ryan Diguadio), landscape-scale conservation planning for bobcats in the San Diego area (Megan Jennings), and some neat genetics of the SF Bay’s salt marsh harvest mouse (Mark Statham). Also, Curtis Alling talked about local, regional and state climate preparedness planning, and dedicated a slide to cal-adapt.org. Nice!

I also got to catch up briefly with ESPM grads Sarah Sawyer who is now at the Forest Service and Tim Bean, who is thriving at HSU. Alice, he suggested a trip up to Redwood State Park to check out the dark figure of crime in the tall trees. 

Big Data for sustainability: an uneven track record with great potential

An interesting position piece on the appropriate uses of big data for climate resilience. The author, Amy Luers, points out three opportunities and three risks.

She sums up:

"The big data revolution is upon us. How this will contribute to the resilience of human and natural systems remains to be seen. Ultimately, it will depend on what trade-offs we are willing to make. For example, are we willing to compromise some individual privacy for increased community resilience, or the ecological systems on which they depend?—If so, how much, and under what circumstances?"

Read more from this interesting article here.

Global forest change from Landsat and Google

The video describing the partnership and the product is available now.

A new high-resolution global map of forest loss and gain has been created with the help of Google Earth. The interactive online tool is publicly available and zooms in to a remarkably high level of local detail - a resolution of 30m. Snapshot of Russia here (green = forest, blue = gain, red = loss):

Russia has much forest activity

Results from time-series analysis of 654,178 Landsat images from 2000–2012 characterize forest extent and change. Between 2000 and 2012, according to this analysis, the Earth lost a combined "forest" the size of Mongolia. http://www.bbc.co.uk/news/science-environment-24934790

Here is the abstract from the accompanying paper in Science:

Quantification of global forest change has been lacking despite the recognized importance of forest ecosystem services. In this study, Earth observation satellite data were used to map global forest loss (2.3 million square kilometers) and gain (0.8 million square kilometers) from 2000 to 2012 at a spatial resolution of 30 meters. The tropics were the only climate domain to exhibit a trend, with forest loss increasing by 2101 square kilometers per year. Brazil’s well-documented reduction in deforestation was offset by increasing forest loss in Indonesia, Malaysia, Paraguay, Bolivia, Zambia, Angola, and elsewhere. Intensive forestry practiced within subtropical forests resulted in the highest rates of forest change globally. Boreal forest loss due largely to fire and forestry was second to that in the tropics in absolute and proportional terms. These results depict a globally consistent and locally relevant record of forest change.

Hansen, M.C.; Potapov, P.V.; Moore, R.; Hancher, M.; Turubanova, S.A.; Tyukavina, A.; Thau, D.; Stehman, S.V.; Goetz, S.J.; Loveland, T.R.; Kommareddy, A.; Egorov, A.; Chini, L.; Justice, C.O.; Townshend, J.R.G. High-Resolution Global Maps of 21st-Century Forest Cover Change. Science 2013, 342, 850-853

Mobile Field Data Collection, Made Easy

Recommendation from Greeninfo Network's MapLines newsletter:

"Attention land trusts, weed mappers, trail maintainers and others - Are you ready for the Spring field work season?  GreenInfo recommends using this customizable, free app for collecting data in the field - Fulcrum App, which offers a free single user plan for storing up to 100 mb of data."

According to their website, with Fulcrum, you build apps to your specifications, allowing you to control exactly what data is captured from the field and how. Maintain high standards of quality to minimize rework, QA/QC, and error correction by getting it done right the first time.

Denali Repeat Photography Project

an example from the Denali ProjectFrom Shasta: along the lines of our VTM photo reshoot project, here is a far more advanced example - the Denali Repeat Photography Project.

he Denali Repeat Photography project has assembled more than 200 photo pairs taken across a large cross-section of Denali from the low-lying black spruce forests to ice fields high in the Alaska Range.  What unites these disparate images is that they show repeated views of a single location at different moments in time.  The interval separating the pairs of photos varies greatly – from just a few years to longer than a century!

map of global routes of ship-borne invasive species

From the BBC. Scientists have developed the first global model that analyses the routes taken by marine invasive species. The researchers examined the movements of cargo ships around the world to identify the hot spots where these aquatic aliens might thrive. The research is published in the Journal Ecology Letters.

Scientists mapped the global routes taken by cargo ships over a two-year period

Marine species are taken in with ballast water on freighters and wreak havoc in new locations, driving natives to extinction.

There has been a well-documented boom in global shipping over the past 20 years and this has led to growing numbers of species moving via ballast tanks, or by clinging to hulls.

Some ports such as San Francisco and Chesapeake Bay have reported several exotic new species arriving every year. Economic estimates indicate that marine invaders can have huge impacts that last for decades.

Now, scientists from the UK and Germany have developed a model that might help curb these unwanted visitors. They obtained detailed logs from nearly three million voyages that took place in 2007 and 2008. The model combines information such as shipping routes, ship sizes, temperatures and biogeography to come up with local forecasts of invasion probabilities.

New report on sierra forest health and carbon storage

The Sierra Nevada Conservancy has just released a new report on System Indicators for Forest Health and Carbon Storage. This fourth report in the System Indicators series focuses on Sierra Nevada forests, and includes indicators related to Forest Health and Biomass/Carbon Storage on forest lands. In addition, this report describes the extent, character, and ownership of forest land in the Sierra Nevada Conservancy (SNC) Region. The lead author on the report is our Susie Kocher, from UC Cooperative Extension, and from SNAMP.

See the report here: http://www.sierranevada.ca.gov/about-us/SystetmIndicatorsForestHealth.pdf/view

ANR Statewide Program on GIS

Mission Statement: IGIS aims to support high-priority programs to advance research and extension projects that enhance agricultural productivity, natural resource conservation and healthy communities into the future by providing Informatics and Geospatial Information Systems tools and applications.

ANR Recently announced the development of a new Statewide Program called the Informatics and GIS (IGIS) program. The new program aims to over the next five years become the nexus for ANR’s rich and diverse geospatial and ecological data, research information, and resources for academics and the public who rely on geospatial and informatics data, analysis and display.  Through data capture, information sharing, and collaboration, we aim to increase our ability to make meaningful predictions of the agricultural, ecosystem, and community response to future change, to increase our understanding of California’s diverse natural, agricultural and human resources, and to support research and outreach projects that enhance agricultural productivity, natural resource conservation and healthy communities into the future.

The IGIS team needs your input to design this resource to be an efficient and helpful delivery of information and GIS support. If you are affiliated with ANR, please take a few minutes to complete the Survey of Informatics and GIS Needs, Knowledge and Data Availability.  This is a short and comprehensive survey that will assess GIS, data and information needs, evaluate your level of informatics and GIS expertise and use of geospatial tools and data.  Your response will be of great assistance toward building a successful State-wide program.