Hey OakMappers! Updated OakMapper available for iPhones and iPads

The new OakMapper logo

We are excited to announce the new version (2.3) of the OakMapper iPhone/iPad App, available to download now for free at the iTunes App Store [link].

In this version of the OakMapper App, the original browse and search functionalities have been retooled to improve the user interface design and user interaction. A new user can sign up for a new OakMapper account directly using the App. Users who has logged into their account can manage their profile, change their password, and submit a SOD point. The submission process has been re-engineered to achieve a better and more intuitive submission workflow. Users can also take a picture of a suspected SOD infected tree and upload it right from their iOS devices.

To explore all the new features of the OakMapper iPhone/iPad App, please install OakMapper from the iTunes App Store [link] now. Please feel free to share this App with your friends. If you like the OakMapper app, please rate the app and leave your comments in the App store. If you should have any questions, please email us at oakmapper@gmail.com.

Enjoy!

OakMapper
Shufei Lei, Web/Mobile App Developer
Maggi Kelly, Principal Investigator
www.oakmapper.org

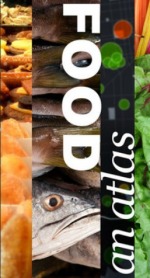
Food: An Atlas by Guerrilla Cartographers is ready for your support!

An atlas of food: a cooperatively-created, crowd-sourced and crowd-funded project of guerrilla cartography and publishing. Check it out! Food: An Atlas is ready to roll. Check out the promo at kickstarter and consider supporting the project.

5 months
+ 80 collaborating cartographers and researchers
+ 8 volunteer editors
+ An abundance of volunteer campaign wranglers, academics, designers, and artists
+ You
= Food: An Atlas

Crowdsourced neighborhood boundaries

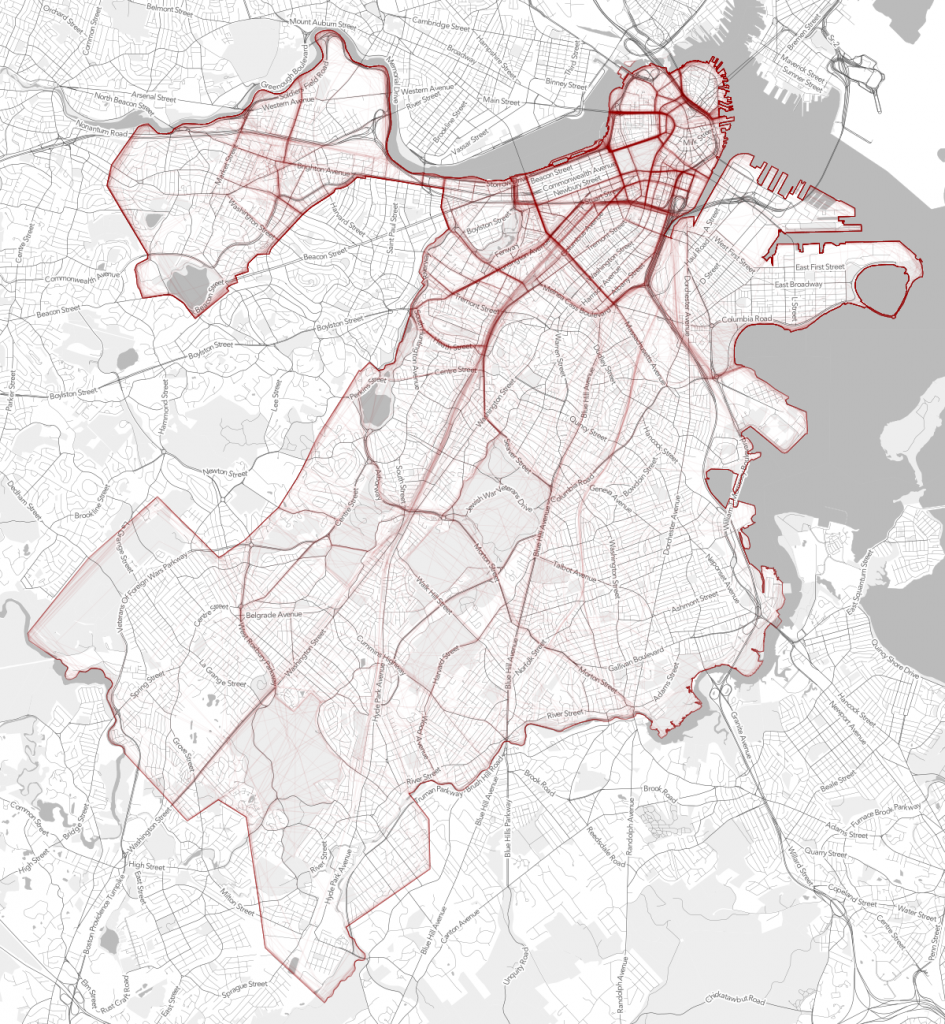
Andy Woodruff and Tim Wallace from Bostonography discuss the first preliminary results of an experiment they set up with an interactive webGIS tool that allows people to draw polygons where they think each of Boston’s neighborhoods are located. About 300 maps of neighborhoods have been submitted so far and with the compiled data there are many areas of agreement and disagreement on where neighborhood boundaries may lay. Bostonography created maps showing a gradient of agreement for each neighborhood's boundary. This exercise is reminiscent to the work of Kevin Lynch and is an interesting experiment in trying to see if there is a consensus on where people think neighborhood boundaries are as opposed to how they are defined officially by the city. For the full blog post and maps on Bostonography click here. For an article in the Atlantic Cities that discusses the maps click here.

Strength or density of polygon line placement of crowdsourced neighborhood boundaries

What is "success" with post-disaster crowdsourcing?

At a recent workshop I gave on webGIS, after giving an overview of some of the recent uses of crowdsourced and VGI in disasters (fire in San Diego, earthquake in Christchurch, Ushahidi everywhere...), I was asked about success of these projects. Who used the data? How? (and who funded these websites, but that is another story.) And I had only the vaguest of answers. Here is a thoughful critique on this subject by Paul Currion on MobileActive.org. He examines the use of the Ushahidi project in Haiti. Paul is an aid worker who has been working on the use of ICTs in large-scale emergencies for the last 10 years.  He asks whether crowdsourcing adds significant value to responding to humanitarian emergencies, arguing that merely increasing the quantity of information in the wake of a large-scale emergency may be counterproductive. Why? because aid workers need clear answers, not a fire-hose of information. Information from the crowd needs to be curated, organized, targeted for response. He makes the point that since crowdsourced data is going have to be sorted through, and can be biased, and can be temporary, aid agencies are going to have to carry out exactly the same needs assessments that they would done without the crowdsourced information.

Where and when do crowdsourced data add value to a situation or project? How can we effectively deal with the bias in the data that comes naturally? We deal with this all the time in my smaller web-related projects: oakmapper and snamp for example. What is the future role of the web for adaptive forest management for example? How do these new collaborative and extensive tools help us make important decisions about natural resources management in often contentious contexts? More to think about.

Livehoods: Dynamic maps of place via social networking

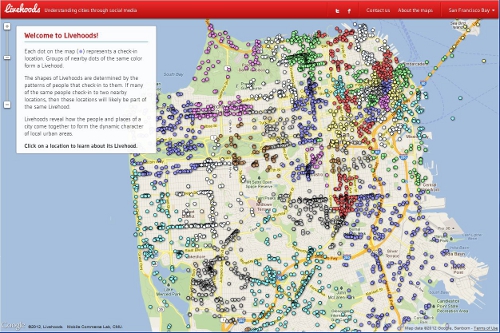
Livehoods is an interesting research project from the School of Computer Science at Carnegie Mellon University which maps social networking activity and patterns using tweets and check-ins to examine the hidden structure of cities and neighborhoods. For example below on the map each point represents a check-in location. Groups of nearby points of the same color represent a Livehood. Within a Livehood statistics are calculated aggregating check-ins overtime and depicts how a place is used. For more information on Livehoods click here.

Livehoods Screenshot

London Mapping Festival: 18 months of all things maps + london. Sign me up.

The London Mapping Festival 2011 – 2012, or LMF for short, is an exciting and unique initiative being launched in June 2011 and will run through to December 2012. It sets out to promote greater awareness and understanding of how maps and digital geographic data are being created and used within the Capital.   Through a diverse range of activities LMF will engage with a wide audience of mapping enthusiasts whether they are professionals, enthusiasts or others. We should do something like this for the SF Bay Area. More here.

Open Street Map's further integration into commercial mapping products

MapQuest has recently announced the opening of a secondary beta open source mapping website based on the Open Street Maps engine where community members can post and edit map data that will then be integrated into Open Street Maps and MapQuest products. The announcement also indicates MapQuest may in the near future merge this beta open source map portal with their commercial map portal. The integration of community based map editing and open source data in commercial products has started to become a trend in the commercial mapping world. Other commercial map products such as Microsoft Bing and commercial mapping applications such as ESRI ArcGIS 10 base maps already offer Open Street Map as a product to view alongside their propriety map data. Community led commercial map editing is not entirely new as Google and other map services already allow account members to point out errors and make corrections. What is different in the case of MapQuest is the integration of open source data with commercial data. This continues to push the boundaries of community led mapping and the further proliferation of open source data products in the commercial and public spheres.

Read the full article here.

Open MapQuest Beta

Mapping Traffic’s Toll on Wildlife

Roadkill and participatory GIS (two of my favorite topics) make it mainstream! A recent article from the New York Times describes a project out of UC Davis using citizen observers to map roadkill.

"Volunteers comb the state’s highways and country roads for dead animals, collecting GPS coordinates, photographs and species information and uploading it to a database and Google map populated with dots representing the kills. The site’s gruesome gallery includes photos of flattened squirrels or squashed skunks."

The project website can be found here: http://www.wildlifecrossing.net/california/

Read the NY times article here.

Disaster response evolves: faster, more detailed, and community focused

The recent earthquake in Haiti makes us, placed as we are on another of the great faults of the western hemisphere, take pause and think about the fragility of life and the suddenness of disasters like earthquakes.  The mapping of earthquakes - their shake strength, fault lines, and past seismicity - and their damage, has changed in recent years. The Haiti quake shows this: within hours and days of the quake, we were able to see the shake intensity, historical seismicity and detailed faults from the USGS, and Open Street Map opened up a crisis center for participatory mapping. International agencies requested satellite data of the area and, NASA, GeoEye and the European Space Agency responded, and shared their imagery freely.  A number of detailed before and after visualizations from outlets like the NY Times and Bing Maps quickly followed. The disaster and the geospatial response was chronicled in many blogs. 

This is more than what was available to us recently with the San Diego, California fires or the San Francisco Oil Spill in 2007, or Hurricane Katrina in 2005, or the Indian Ocean Tsunami in 2004, each of which set new records for mapping speed and creativity. Each global-scale disaster seems to be a driving innovative force to help shape and evolve participatory mapping, detailed imagery delivery, and spatial decision support tools.  For example, this past weekend I was involved in a World Bank effort called Operation GEO-CAN – Global Earth Observation – Catastrophe Assessment Network (press release here) to analyze aerial imagery from imagery from Port au Prince in 2009 (top) and 2010 (bottom)before and after the Haiti earthquake.  The World Bank needed fast action to get a clearer picture of damage and rebuilding needs. Hundreds of people, from 20 countries, recruited via email, were quick to lend their expertise to digitize and describe collapsed buildings evident in new GeoEye imagery when compared to older imagery (see example at left).  The Earthquake Engineering Research Institute (EERI), who helped coordinate the effort, used a fast, mobile, distributed thinking system that employed a Google Earth framework and a clever workload management system that allowed users to check out individual tiles of imagery, search for collapsed buildings, digitize them, and then upload the data as lean and mean kmz files. The effort was viral, and continued to grow over the weekend as many of us analyzed tile after tile of imagery, and saw the unimaginable destruction in Haiti. It is astonishing what you are able to see with detailed, multi-temporal, nadir view imagery: collapsed buildings and walls; tents erected in back yards; blocked roads.  The dataset we created will be used to guide emergency response and restoration.

This kind of distributed analysis was inconceivable not long ago. The GeoEye satellite, which captures sub-meter imagery routinely, and Google Earth, which seamlessly coordinates multiple imagery streams, are now mainstream in the 21st century, as are other tools like Open Street Map and Bing. New imagery of disaster foci, new software to fuse and analyze multi-temporal imagery, new database management tools to guide workflow are critical, but it is visionary thinking that is able to quickly capture a concerned and technically capable audience that is paramount. We can learn from our response to the horror of natural disasters like earthquakes to support research in environmental sciences.  These experiences reinforce the message that geospatial tools, as tools alone, are inconsequential. But when we can quickly and accurately map pattern and context, and use that to support decisions, plan for the future, and communicate options, geospatial tools can be the among most powerful available to us.  Along these lines, we at the GIF have been turning our attention internationally, and are focusing on several international projects. For example, we are working with colleagues from the Department of Economics to map land cover change in order to study patterns of human conflict in Sierra Leone, and helping train professional health care students from UCSF who will be stationed in African and India in coming years to look for connections between human health and environment.  We will write about some of these in our upcoming newsletter.

As a last word, there is plenty more to do in Haiti: places to donate include the Red Cross, Salvation Army, and Partners in Health, among many, many more.

The VTM photo-hunt is on (at least in the Bay Area)

I am reinvigorating the mission to re-shoot the VTM photos. At least in the Bay Area. This was prompted by the recent Berkleyan article about the new UC reserve in Santa Clara County ("preserves oak-woodland ecosystem at urban/wildland interface"). I thought "I wonder if there are any pictures of the area from the VTM collection?" and had a search this weekend. Sure enough, there are some nice ones. So I've geo-located a few from around the bay to get us started. Any ideas on: automating the process; making an easy site to upload paired photos; an easy way to link Township/Range queries into gmaps... Any volunteers to do Santa Cruz County? Lots of great pics there. And check out the local logging history documented in the photos of the New Almaden quad.

Mikel Maron’s blog: building digital technology for our planet

Here find another related blog: Brainoff.com. Mikel is an advocate of open collection and distribution of geographic data, particularly with OpenStreetMap the "free and openly editable map of the entire world". Using Wiki concepts and GPS units, They are rapidly mapping using entirely voluntary contributions.  There are some great examples of participatory mapping on this site, among many other interesting ideas.

Africa@home

A recent article in the economist highlighted the potential of volunteer computing projects, such as SETI@home, to utilize the ram power and brain power of the masses. This excerpt highlights a particularly interesting project (Africa@home) to classify remotely sensed data. The article also introduces BOSSA, a software made at Berkeley to integrate the skills of many volunteers over the Internet. "Bossa nova To lower the barrier to entry for projects like this, Dr Anderson recently launched a new open-source platform called BOSSA (Berkeley Open System for Skill Aggregation), which aims to do for “distributed thinking” what BOINC has done for distributed computing. One of Dr Anderson's first customers for BOSSA is Peter Amoako-Yirenkyi of the Kwame Nkrumah University of Science and Technology in Kumasi, Ghana, who is working with other African researchers and a research group called UNOSAT, which processes digital-satellite data for various United Nations agencies. The project, which is part of an initiative called Africa@home co-ordinated by the University of Geneva, will enlist volunteers to extract useful cartographic information—the positions of roads, villages, fields and so on—from satellite images of regions in Africa where maps either do not exist or are hopelessly out of date. This will help regional planning authorities, aid workers and scientists documenting the effects of climate change. Dr Amoako-Yirenkyi is excited by the prospects such projects open up for African researchers. “We can leapfrog expensive data centres, and plug directly into a global computer,” he says. Rather than fretting about a digital divide, researchers in developing countries stand to benefit from this digital multiplication effect."