Wrap up from the FOODIT: Fork to Farm Meeting

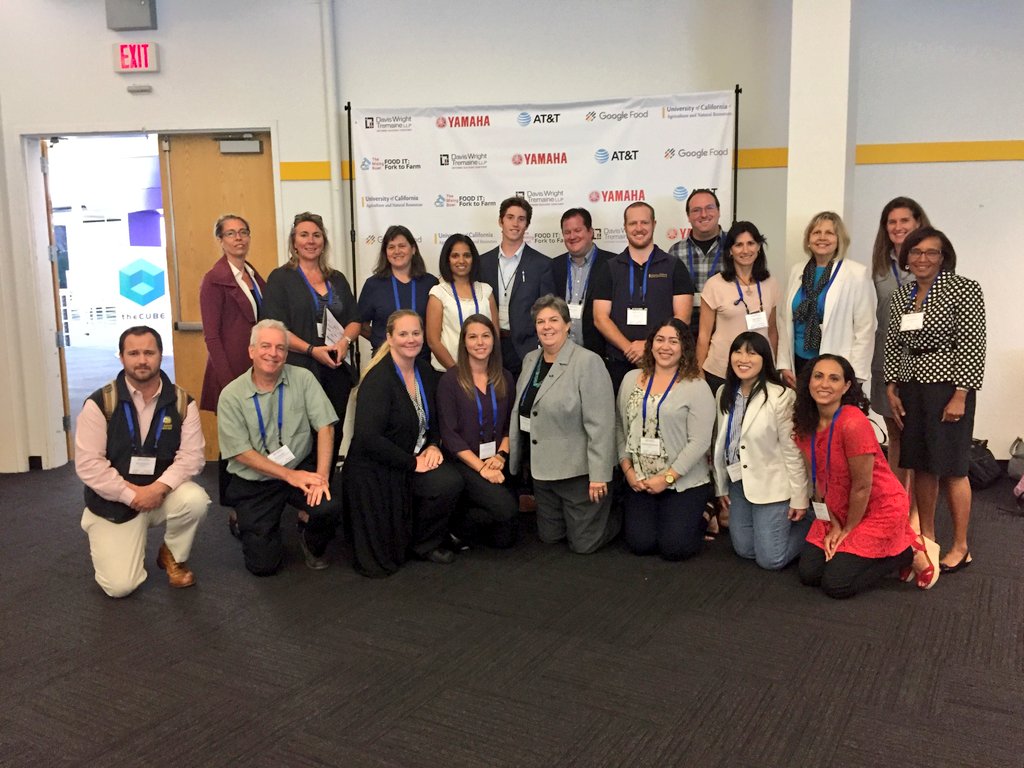
UC ANR was a sponsor for the FOODIT: Fork to Farm meeting in June 2017: http://mixingbowlhub.com/events/food-fork-farm/. Many of us were there to learn about what was happening in the food-data-tech space and learn how UCANR can be of service. It was pretty cool. First, it was held in the Computer History Museum, which is rad. Second, the idea of the day was to link partners, industry, scientists, funders, and foodies, around sustainable food production, distribution, and delivery. Third, there were some rad snacks (pic below). 

We had an initial talk from Mikiel Bakker from Google Food, who have broadened their thinking about food to include not just feeding Googlers, but also the overall food chain and food system sustainability. They have developed 5 "foodshots" (i.e. like "moonshot" thinking): 1) enable individuals to make better choices, 2) shift diets, 3) food system transparency, 4) reduce food losses, and 5) how to make a closed, circular food system.

We then had a series of moderated panels.

The Dean's List introduced a panel of University Deans, moderated by our very own Glenda Humiston @UCANR, and included Helene Dillard (UCDavis), Andy Thulin (CalPoly), Wendy Wintersteen (Iowa State). Key discussion points included lack of food system transparency, science communication and literacy, making money with organics, education and training, farm sustainability and efficiency, market segmentation (e.g. organics), downstream processing, and consumer power to change food systems. Plus the Amazon purchase of Whole Foods.

The Tech-Enabled Consumer session featured 4 speakers from companies who feature tech around food. Katie Finnegan from Walmart, David McIntyre from Airbnb, Barbara Shpizner from Mattson, Michael Wolf from The Spoon. Pretty neat discussion around the way these diverse companies use tech to customize customer experience, provide cost savings, source food, contribute to a better food system. 40% of food waste is in homes, another 40% is in the consumer arena. So much to be done!

The session on Downstream Impacts for the Food Production System featured Chris Chochran from ReFed @refed_nowaste, Sabrina Mutukisna from The Town Kitchen @TheTownKitchen, Kevin Sanchez from the Yolo Food Bank @YoloFoodBank, and Justin Siegel from UC Davis International Innovation and Health. We talked about nutrition for all, schemes for minimizing food waste, waste streams, food banks, distribution of produce and protein to those who need them (@refed_nowaste and @YoloFoodBank), creating high quality jobs for young people of color in the food business (@TheTownKitchen), the amount of energy that is involved in the food system (David Lee from ARPA-E); this means 7% of our energy use in the US inadvertently goes to CREATING FOOD WASTE. Yikes!

The session on Upstream Production Impacts from New Consumer Food Choices featured Ally DeArman from Food Craft Institute @FoodCraftInst, Micke Macrie from Land O' Lakes, Nolan Paul from Driscoll's @driscollsberry, and Kenneth Zuckerberg from Rabobank @Rabobank. This session got cut a bit short, but it was pretty interesting. Especially the Food Craft Institute, whose mission is to help "the small guys" succeed in the food space.

The afternoon sessions included some pitch competitions, deep dive breakouts and networking sessions. What a great day for ANR.

Planet Lab wants YOU to work with their data!

They say: 

Are you a college student, researcher or professor? We’re looking for innovative academics, researchers and scientists to unlock the power of a one-of-a-kind dataset. You can now apply for access to Planet’s unique dataset for non-commercial research purposes. In an area as large as 2,000 square kilometers, you’ll have access to download imagery, analyze trends, and publish your results.

Check it: https://www.planet.com/products/education-and-research/

Wow! New world view Chrome plugin

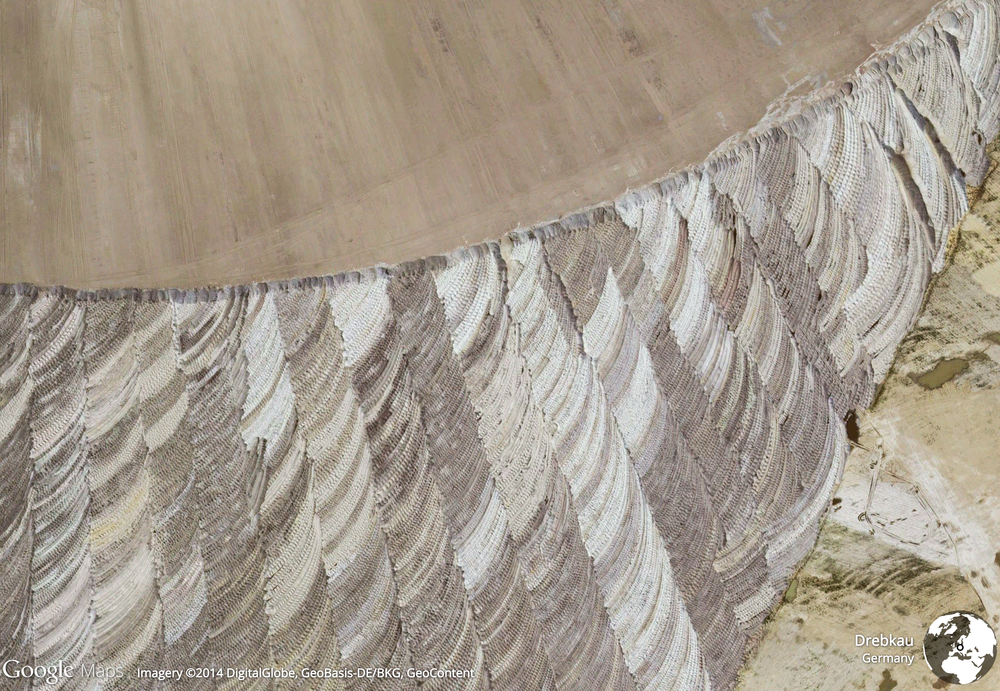
Kelly turned us on to this plugin from Google. Each time you get a new tab on your browser, you get treated to a new picture of the earth! But, check this one out: 

From Drebkau, Germany. I have no idea what this is an image of - could it be grain fields of some kind, or is it just someone at Google's garage sale carpet? Any thoughts? 

Here is another view of the same area:

Kelly Lab SPUR Students Visit Point Reyes National Seashore

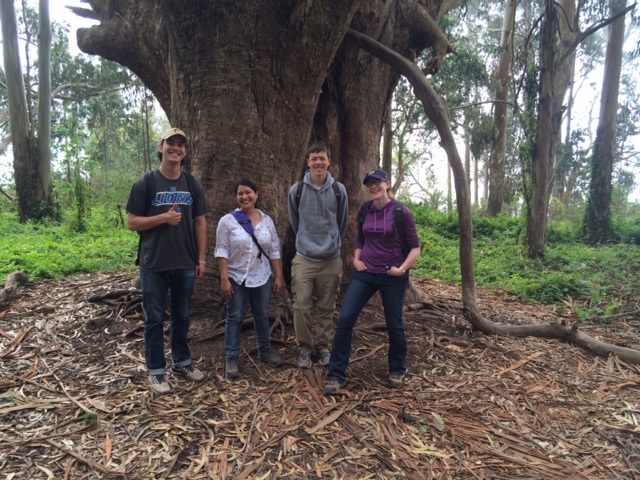
Kelly Lab SPUR Students Drew Adamski and Ryan Avery have been participating in lab research all semester.  In particular they have been helping classify trails within the Pacific West's National Parks.  This month we were lucky enough to travel out with them to Point Reyes National Seashore to see some of those trails in person.  We were also lucky enough to spend the day with Chief Ranger Schifsky who was kind enough to talk to us about what issues different trails in the park were facing and which trails seemed to be changing most rapidly.  Chief Schifsky was also kind enough to show us some of the points in the park where the landscape had changed dramatically over time due to fire, restoration projects, or differing management strategies.  Overall it was a really inspiring and informative trip!
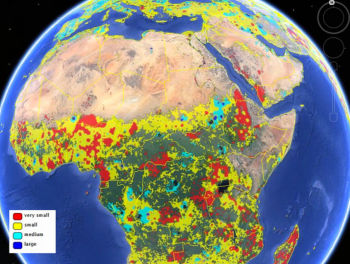
Croudsourced view of global agriculture: mapping farm size around the world

From Live Science. Two new maps released Jan. 16 considerably improve estimates of the amount of land farmed in the world — one map reveals the world's agricultural lands to a resolution of 1 kilometer, and the other provides the first look at the sizes of the fields being used for agriculture.

The researchers built the cropland database by combining information from several sources, such as satellite images, regional maps, video and geotagged photos, which were shared with them by groups around the world. Combining all that information would be an almost-impossible task for a handful of scientists to take on, so the team turned the project into a crowdsourced, online game. Volunteers logged into "Cropland Capture" on a computer or a phone and determined whether an image contained cropland or not. Participants were entered into weekly prize drawings.

Cropland Data Layer (CDL) and National Land Cover Dataset (NLCD): new versions released this year

Both the NASS Cropland Data Layer (CDL) and the National Land Cover Dataset (NLCD) released new versions in early 2014. Links for download are here:

NLCD released and webinar April 15 2014

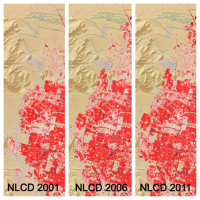
These three panels of cyclical data (2001, 2006, 2011) from the National Land Cover Database depict intervals of land cover change in the vicinity of Spring Valley, a suburb of Las Vegas, NV.[Source: USGS] Just released, the latest edition of the nation’s most comprehensive look at land-surface conditions from coast to coast shows the extent of land cover types from forests to urban areas. The National Land Cover Database (NLCD 2011) is made available to the public by the U.S. Geological Survey and partners.

Dividing the lower 48 states into 9 billion geographic cells, the massive database provides consistent information about land conditions at regional to nationwide scales. Collected in repeated five-year cycles, NLCD data is used by resource managers and decision-makers to conduct ecosystem studies, determine spatial patterns of biodiversity, trace indications of climate change, and develop best practices in land management.

Based on Landsat satellite imagery taken in 2011, NLCD 2011 describes the land cover of each 30-meter cell of land in the conterminous United States and identifies which ones have changed since the year 2006. Nearly six such cells — each 98 feet long and wide — would fit on a football field. Land cover is broadly defined as the biophysical pattern of natural vegetation, agriculture, and urban areas. It is shaped by both natural processes and human influences. NLCD 2011 updates the previous database version, NLCD 2006.

Webinar about the release will be Tuesday, April 15, 2014, 2:00 PM Eastern Time: "New Version of the National Land Cover Database - April 4, 2014 Release”

The latest version of the National Land Cover Database (NLCD) for the conterminous United States will be publicly released on April 4, 2014.  NLCD 2011 is the most up-to-date and extensive iteration of the National Land Cover Database, the definitive Landsat-based, 30-meter resolution land cover database for the Nation.  NLCD 2011 products are completely integrated with those of previous versions (2001, 2006), providing a 10-year record of change for the Nation.  Products include 16 classes of land cover, the percent of imperviousness in urban areas, and the percent of tree canopy cover. NLCD is constructed by the 10-member federal interagency Multi-Resolution Land Characteristics (MRLC) Consortium.   This seminar will highlight the new features of NLCD 2011 and the related applicationsCollin Homer, 605-594-2714, homer@usgs.gov)
For more information and to download NLCD data, visit http://www.mrlc.gov/.
Please click the following link to join the webinar:
 https://usgs.webex.com/usgs/j.php?ED=279876177&UID=490357047&RT=MiM3

At start time of the webinar, each location must call one of the dial-in numbers:
From the National Center in Reston, dial internally x4848
From all other USGS/DOI locations, dial 703-648-4848
From non DOI locations, dial toll free 855-547-8255
After the voice prompt, please enter the Conference Security Code 73848024 followed by the # key. You will hear a tone confirming that you have successfully joined the conference call. If you weren't successful, you will hear another voice prompt with instructions.

Clark Labs to Create Cloud-based Land Change Modeler for ArcGIS

Clark Labs was awarded a million dollar grant from Esri to create a cloud-based version of their Land Change Modeler for ArcGIS. Land Change Modeler is suite of tools to assess and predict land change and evaluate the impacts of change and includes REDD (Reducing Emissions from Deforestation and Forest Degradation) tools for modeling the impact of land cover change on carbon emissions. Currently Land Change Modeler is only available in IDRISI and as a software extension for ArcGIS (the latest version is compatible with v10.2). This will make this tool more easily assessable to the wider public and scientific community.

From Clark Labs press release:

"Clark Labs was recently awarded a million dollar grant from Esri to create a cloud-based version of their Land Change Modeler for ArcGIS. Currently, Clark Labs’ extension is for the ArcGIS desktop.

Land Change Modeler for ArcGIS, first released in 2007 with Version 2 released this past month, is a software extension for ArcGIS users, offering a suite of tools to assess and predict land change and evaluate the impacts of such change. Clark Labs recent release includes many significant enhancements. The new version is compatible with ArcGIS Version 10.2

The Land Change Modeler offers an extensive suite of tools for land change research in a simple and automated workflow. It provides a variety of tools for land change analysis and prediction, as well as the impacts of those changes.

The new version release of this fall provides significant enhancements, particularly for its utility for REDD (Reducing Emissions from Deforestation and Forest Degradation). Land Change Modeler now includes functionality for modeling the impact of land cover change on carbon emissions. “Our world is changing rapidly, and technology to efficiently model and predict future land change is vital to addressing global challenges,’ said Jack Dangermond, Esri President. “We’re pleased to award this grant to Clark Labs to jumpstart their effort to utilize and provide rich content through ArcGIS Online.”

The new version also provides more capability for estimating land change impacts on habitat and biodiversity. With the grant from Esri, Clark Labs will be creating a cloud-based implementation of Land Change Modeler for their platform.

Clark Labs and Esri have been business partners for nearly ten years, working collaboratively on GIS research."

For the full news release see here.

Help to Validate Global Land Cover with GeoWiki and Cropland Capture

Courtesy of the International Institute for Applied Systems Analysis

This creative project from GeoWiki seeks to get croudsourced feedback on crop types from participants around the world. They say: 

By 2050 we will need to feed more than 2 billion additional people on the Earth. By playing Cropland Capture, you will help us to improve basic information about where cropland is located on the Earth's surface. Using this information, we will be better equipped at tackling problems of future food security and the effects of climate change on future food supply. Get involved and contribute to a good cause! Help us to identify cropland area!

Oh yeah, and there are prizes!

Each week (starting Nov. 15th) the top three players with the highest score at the end of each week will be added to our weekly winners list. After 25 weeks, three people will be drawn randomly from this list to become our overall winners. Prizes will include an Amazon Kindle, a brand new smartphone and a tablet.

Global forest change from Landsat and Google

The video describing the partnership and the product is available now.

A new high-resolution global map of forest loss and gain has been created with the help of Google Earth. The interactive online tool is publicly available and zooms in to a remarkably high level of local detail - a resolution of 30m. Snapshot of Russia here (green = forest, blue = gain, red = loss):

Russia has much forest activity

Results from time-series analysis of 654,178 Landsat images from 2000–2012 characterize forest extent and change. Between 2000 and 2012, according to this analysis, the Earth lost a combined "forest" the size of Mongolia. http://www.bbc.co.uk/news/science-environment-24934790

Here is the abstract from the accompanying paper in Science:

Quantification of global forest change has been lacking despite the recognized importance of forest ecosystem services. In this study, Earth observation satellite data were used to map global forest loss (2.3 million square kilometers) and gain (0.8 million square kilometers) from 2000 to 2012 at a spatial resolution of 30 meters. The tropics were the only climate domain to exhibit a trend, with forest loss increasing by 2101 square kilometers per year. Brazil’s well-documented reduction in deforestation was offset by increasing forest loss in Indonesia, Malaysia, Paraguay, Bolivia, Zambia, Angola, and elsewhere. Intensive forestry practiced within subtropical forests resulted in the highest rates of forest change globally. Boreal forest loss due largely to fire and forestry was second to that in the tropics in absolute and proportional terms. These results depict a globally consistent and locally relevant record of forest change.

Hansen, M.C.; Potapov, P.V.; Moore, R.; Hancher, M.; Turubanova, S.A.; Tyukavina, A.; Thau, D.; Stehman, S.V.; Goetz, S.J.; Loveland, T.R.; Kommareddy, A.; Egorov, A.; Chini, L.; Justice, C.O.; Townshend, J.R.G. High-Resolution Global Maps of 21st-Century Forest Cover Change. Science 2013, 342, 850-853

Workshop wrap up: Google Earth Higher Education Summit 2013

For three days in late July 2013 Kevin Koy, Executive Director of the GIF and Maggi spent time at Google with 50+ other academics and staff to learn about Google Earth's mapping and outreach tools that leverage cloud computing. The meeting was called Google Earth for Higher Education Summit, and it was jam packed with great information and hands-on workshops. Former Kellylabber Karin Tuxen-Bettman was at the helm, with other very helpful staff (including David Thau - who gave the keynote at last year's ASPRS conference). Google Earth Outreach has been targeting non-profits and K-12 education, and are now increasingly working with higher education, hence the summit. We learned about a number of valuable tools for use in classrooms and workshops, a short summary is here.  

Google Mapping Tools - the familiar and the new

  • Google Earth Pro. You all know about this tool, increasing ability to plan, measure and visualize a site, and to make movies and maps and export data.
  • Google Maps Engine Lite. This is a free, lite mapping platform to import, style and embed data. Designed to work with small (100 row) spreadsheets.
  • Google Maps Engine Platform. The scaleable and secure mapping platform for geographic data hosting, data sharing and map making. streamlines the import of GIS data: you can import shapefiles and imagery. http://mapsengine.google.com.
  • Google Earth Engine. Data (40 years of global satellite imagery - Landsat, MODIS, etc.) + methods to analyze (Google's and yours, using python and javascript) + the Cloud make for a fast analytical platform to study a changing earth. http://earthengine.google.org/#intro
  • TimeLapse. A new tool showcasing 29 years of Landsat imagery, allows you to script a tour through a part of the earth to highlight change. Features Landsat 4, 5 7 at 30m, with clouds removed, colors normalized with MODIS. http://earthengine.google.org/
  • Field Mobile Data Collection. GME goes mobile, using Open Data Kit (ODK) - a way to capture structured data and locate it and analyze after home.
  • Google Maps APIs. The way to have more hands-on in map styling and publishing. developers.google.com/maps
  • Street View. They have a car in 32 countries, on 7 continents, and are moving into national parks and protected areas. SV is not just for roads anymore. They use trikes, boats, snowmobiles, trolleys; they go underwater and caves, backpacks.

Here are a couple of my first-cuts:

PROBA-V satellite launched May 7

Proba-V’s first image of FranceI haven't used PROBA imagery, but many colleagues in Europe rely on this sensor.

PROBA-V (i.e. "vegetation") was launched May 7. The miniature satellite is designed to map land cover and vegetation growth across the entire planet every two days. The data can be used for alerting authorities to crop failures or monitoring the spread of deserts and deforestation.

Less than a cubic metre in volume, Proba-V is a miniaturised ESA satellite tasked with a full-scale mission: to map land cover and vegetation growth across the entire planet every two days.

Proba-V is flying a lighter but fully functional redesign of the Vegetation imaging instruments previously flown aboard France’s full-sized Spot-4 and Spot-5 satellites, which have been observing Earth since 1998.

Check it out: http://www.esa.int/Our_Activities/Technology/Proba_Missions/Proba-V_opens_its_eyes

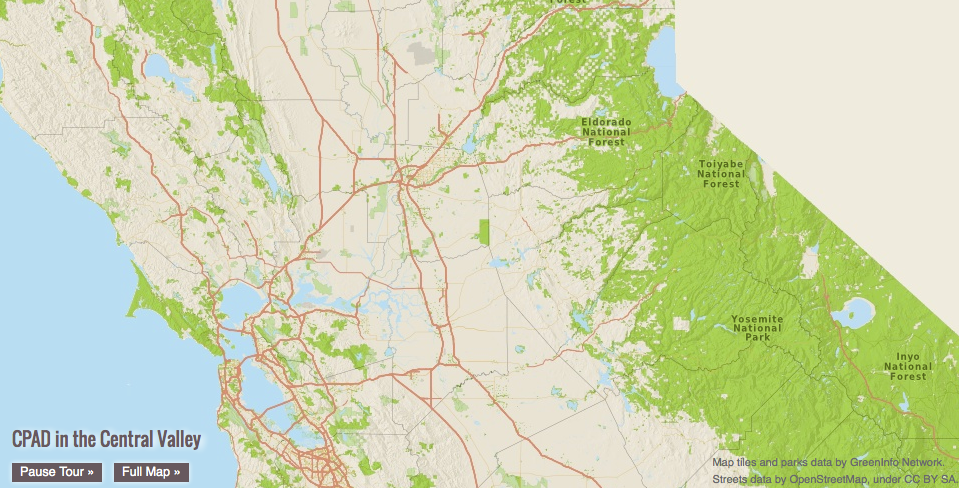
CPAD 1.9 released today: mapping protected areas in California

CPAD, the California's Protected Areas Database is releasing a new version. This product maps lands owned in fee by public and nongovernmental organizations for open space purposes, ranging from small neighborhood parks to large wilderness areas.

CPAD 1.9 a major update that corrects many outstanding issues with CPAD holdings data and also has many new additions, particular for urban parks.

CPAD is produced and managed by GreenInfo Network, a 16 year old non-profit organization that supports public interest groups and agencies with geospatial technology. CPAD data development is conducted with Esri ArcGIS products, supplemented with open source web application tools. 

Find the data here.

Lisa Schile is off to Abu Dhabi

Dr. Lisa Schile is off to Abu Dhabi for a postdoctoral research position with the Smithsonian Institution. She'll be working on a project monitoring carbon sequestration in wetlands. We checked out some of the available Abu Dhabi imagery on-line. The country has a long and interesting coastline, with many mangroves and wetlands, and of course the ever increasing coastal development. Here is a snapshot from NASA of coastal development. Lisa has started a blog, and taking lots of pics for us to see.

Launch of Sonoma County Veg Mapping Program

The Sonoma County Agricultural Preservation and Open Space District has begun a 3-5 year program to map Sonoma County’s diverse plant communities.

An accurate, up-to-date map of vegetation and habitat type is key to ensuring good planning and management for watershed protection, flood control, fire and fuels management, and wildlife habitat conservation. A vegetation map is also critical to assessing climate benefits provided by the landscape, such as the amount of carbon being absorbed from the atmosphere or the degree to which the landscape is buffering extreme weather events.

These folks are using 3-6-inch CIR imagery and obia to map vegetation across Sonoma County. GIF is serving up the imagery! Check it out!

ESRI MODIS Toolbox

Cool MODIS NDVI tool pointed out to us from Jenny P.

This toolbox contains scripts that download NASA satellite imagery from MODIS and import it into ArcMap. The four data products currently supported are: evapotranspiration, land surface temperature, normalized difference vegetation index (NDVI), and enhanced vegetation index (EVI).

These products are available for the entire surface of the Earth at 1 km resolution and for any month going back to January 2000, when MODIS first launched aboard the satellite Terra.

http://resources.arcgis.com/gallery/file/geoprocessing/details?entryID=9CC382D2-1422-2418-34F8-DC9F97B24052

Land Change Science Position Open!

We are very excited to have open a new Cooperative Extension specialist position in Land Change Science. The successful Land Change CE specialist will have a PhD, and will develop a vibrant applied research program, primarily based in California. There are no formal teaching duties with this position, instead, the incumbant will have outreach and extension duties.

We are searching for someone who can help us understand, predict and plan for the complexities of land use change in California. This might be someone from geography, landscape ecology, sociology, or economics, for example, and might focus on planning, modeling or observations of land change, biophysical feedbacks from land change, or spatial analysis. But they must be an adept and capable communicator who can speak to diverse audiences, from landowners, to politicians, to farmers, to scientists, to planners, to citizens.

The Specialist would provide science-based solutions and bridge conflicting interests with knowledge, targeted research, and local education regarding the relationships between expanding population and climate change, and the remaining matrix of wild landscapes, urban areas, working landscapes and agriculture.

The Specialist would provide resources for county-based Cooperative Extension personnel, including learning from UCCE personnel about the needs of decision makers at the local level, and acting as a information and training resource for the use of new tools (GIS, remote sensing, smart phone applications, etc.) for land use analysis.

Please consider applying if this fits you! I will be happy to answer questions.

New study on diabetes risk and neighborhood walkability

The reading for this week's GIS class on vector analysis discussed network buffer measures of neighborhood walkability, and the class came up with numerous components of the built and social environment that the authors didn't include in their land-use based walkability measure that also likely influence people's walking behaviors (e.g. destinations to walk to, crime/safety, trees and greenness, sidewealk quality and ramps, traffic, disincentives from parking costs, etc.). It was a great discussion! I just came acrosos this write-up about a recent article in the journal Diabetes Care that finds a strong relationship between neighborhood walkability and diabetes risk, especially for low-income immigrants. The UC Library doesn't have online access to the most recent one month of articles for this journal, so I haven't been able to look at the full methodolgy for their walkabilty measure. But, I wanted to note it here and will follow-up later with details. Or, if anyone finds access to the full article, please let me know!


ASPRS 2012 Wrap-up

ASPRS 2012, held in Sacramento California, had about 1,100 participants. I am back to being bullish about our organization, as I now recognize that ASPRS is the only place in geospatial sciences where members of government, industry, and academia can meet, discuss, and network in a meaningful way. I saw a number of great talks, met with some energetic and informative industry reps, and got to catch up with old friends. Some highlights: Wednesday's Keynote speaker was David Thau from Google Earth Engine whose talk "Terapixels for Everyone" was designed to showcase the ways in which the public's awareness of imagery, and their ability to interact with geospatial data, are increasing. He calls this phenomena (and GEE plays a big role here): "geo-literacy for all", and discussed new technologies for data/imagery acquisition, processing, and dissemination to a broad public(s) that can include policy makers, land managers, and scientists. USGS's Ken Hudnut was Thursday's Keynote, and he had a sobering message about California earthquakes, and the need (and use) of geospatial intelligence in disaster preparedness.

Berkeley was well represented: Kevin and Brian from the GIF gave a great workshop on open source web, Kevin presented new developments in cal-adapt, Lisa and Iryna presented chapters from their respective dissertations, both relating to wetlands, and our SNAMP lidar session with Sam, Marek, and Feng (with Wenkai and Jacob from UCMerced) was just great!

So, what is in the future for remote sensing/geospatial analysis as told at ASPRS 2012? Here are some highlights:

  • Cloud computing, massive datasets, data/imagery fusion are everywhere, but principles in basic photogrammetry should still comes into play;
  • We saw neat examples of scientific visualization, including smooth rendering across scales, fast transformations, and immersive web;
  • Evolving, scaleable algorithms for regional or global classification and/or change detection; for real-time results rendering with interactive (on-the-fly) algorithm parameter adjustment; and often involving open source, machine learning;
  • Geospatial data and analysis are heavily, but inconsistently, deployed throughout the US for disaster response;
  • Landsat 8 goes up in January (party anyone?) and USGS/NASA are looking for other novel parterships to extend the Landsat lifespan beyond that;
  • Lidar is still big: with new deployable and cheaper sensors like FLASH lidar on the one hand, and increasing point density on the other;
  • Obia, obia, obia! We organized a nice series of obia talks, and saw some great presentations on accuracy, lidar+optical fusion, object movements; but thorny issues about segmentation accuracy and object ontology remain; 
  • Public interaction with imagery and data are critical. The Public can be a broader scientific community, or a an informed and engaged community who can presumably use these types of data to support public policy engagement, disaster preparedness and response.

AAG 2012 Wrap-up

NY skyline from Tim DeChant's blogAAG was a moderately large conference (just under 9,000) this year, held in mid-town NY. It was a brief trip for me, but I did go to some great talks across RS, GIScience, cartography, and VGI. I also went to a very productive OpenGeoSuite workshop hosted by OpenGeo. Some brief highights from the conference: Muki Hacklay discussed participation inequities in VGI: when you mine geoweb data, you are mining outliers, not society; there are biases in gender, education, age and enthusiasm. Agent-based modeling is still hot, and still improving. I saw some great talks in ABM for understanding land use change. Peter Deadman showed how new markets in a hot crop (like Acai) can transform a region quite quickly. Landsat 8 will likely be launched in early 2013, but further missions are less certain. My talk was in a historical ecology session, and Qinghua Guo and I highlighted some of the new modeled results of historic oak diversity in California using VTM data and Maxent.

Saturday evening I had the great pleasure of being locked in after hours at the NY Public Library for a session on historic maps. David Rumsey, with Humphrey Southall (University of Portsmouth) and Petr Pridal (Moravian Library) led a presentation introducing a new website: oldmapsonline.org. The website's goal is to provide a clearer way to find old maps, and provide them with a stable digital reference.