Workshop wrap up: Google Earth Higher Education Summit 2013

For three days in late July 2013 Kevin Koy, Executive Director of the GIF and Maggi spent time at Google with 50+ other academics and staff to learn about Google Earth's mapping and outreach tools that leverage cloud computing. The meeting was called Google Earth for Higher Education Summit, and it was jam packed with great information and hands-on workshops. Former Kellylabber Karin Tuxen-Bettman was at the helm, with other very helpful staff (including David Thau - who gave the keynote at last year's ASPRS conference). Google Earth Outreach has been targeting non-profits and K-12 education, and are now increasingly working with higher education, hence the summit. We learned about a number of valuable tools for use in classrooms and workshops, a short summary is here.  

Google Mapping Tools - the familiar and the new

  • Google Earth Pro. You all know about this tool, increasing ability to plan, measure and visualize a site, and to make movies and maps and export data.
  • Google Maps Engine Lite. This is a free, lite mapping platform to import, style and embed data. Designed to work with small (100 row) spreadsheets.
  • Google Maps Engine Platform. The scaleable and secure mapping platform for geographic data hosting, data sharing and map making. streamlines the import of GIS data: you can import shapefiles and imagery. http://mapsengine.google.com.
  • Google Earth Engine. Data (40 years of global satellite imagery - Landsat, MODIS, etc.) + methods to analyze (Google's and yours, using python and javascript) + the Cloud make for a fast analytical platform to study a changing earth. http://earthengine.google.org/#intro
  • TimeLapse. A new tool showcasing 29 years of Landsat imagery, allows you to script a tour through a part of the earth to highlight change. Features Landsat 4, 5 7 at 30m, with clouds removed, colors normalized with MODIS. http://earthengine.google.org/
  • Field Mobile Data Collection. GME goes mobile, using Open Data Kit (ODK) - a way to capture structured data and locate it and analyze after home.
  • Google Maps APIs. The way to have more hands-on in map styling and publishing. developers.google.com/maps
  • Street View. They have a car in 32 countries, on 7 continents, and are moving into national parks and protected areas. SV is not just for roads anymore. They use trikes, boats, snowmobiles, trolleys; they go underwater and caves, backpacks.

Here are a couple of my first-cuts:
Introduction to the Web-enabled Landsat Data (WELD) products using open source software

Introduction to the Web-enabled Landsat Data (WELD) products using open source software

At American Geophysical Union Fall 2012 Meeting, San Francisco December 6, 2012
______________________________

The NASA funded Web-enabled Landsat Data (WELD) project is providing near-continental scale 30m Landsat time series products (http://weld.cr.usgs.gov).

This 4.5 hour training workshop will provide student and expert users with tips and techniques to handle the WELD products.

Participants will bring their own laptops and a Linux-like Virtual Machine will be installed with remote sensing and GIS open source software, sample WELD products, scripts, and example exercises that illustrate a variety of WELD environmental monitoring and assessment applications. Participants will be assisted through the example exercises and all training material will be available for their later consultation. New WELD product versions will be available and participant feedback and suggestions to evolve the WELD processing
algorithms, product contents and format will be sought.
More information at http://globalmonitoring.sdstate.edu/projects/weld/weldtraining.html

Cost: Free (No AGU Registration Fee Needed)
Date: December 6, 2012
Time: 6:00pm - 10:30pm
Location: San Francisco Marriott
Room: Sierra A

CartoDB launches tools for visualizing temporal data

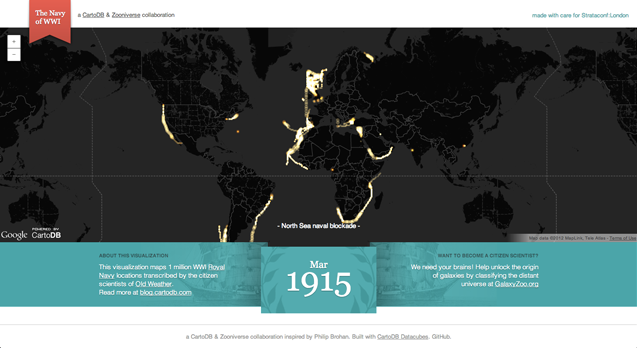
CartoDB, a robust and easy to use web mapping application, today launched "torque" a new feature enabling visualization of temporal data sets. 

From the CartoDB team:

Torque is a library for CartoDB that allows you to create beautiful visualizations with temporal datasets by bundling HTML5 browser rendering technologies with an efficient data transfer format using the CartoDB API. You can see an example of Torque in action on the Guardian's Data Blog, and grab the open source code from here.

Be sure to check out the example based on location data recorded from Captain's logs from the British Royal Navy during the first World War.  Amazing stuff!


New ArcGIS and QGIS desktop versions available

Big updates are now available to both ArcGIS and QGIS bringing more power and functionality to desktop GIS users!

ArcGIS 10.1 is now available with lots of new features.  Learn more from ESRI.com.  The GIF is now testing the updated software and we plan to make it available on lab workstations in the coming weeks.

QGIS 1.8 is also now available, and is free for download.  Visit QGIS.org for download instructions and to learn more about the new features available in this release.

Tim De Chant explains why you should be excited about vector-based maps in iOS 6

Former kellylabber Tim De Chant has a nice piece on the upcoming apple mapping software for mobile devices:

Apple announced today that it’s revamping the Maps application on iOS devices—iPhone, iPad, iPod touch—introducing a lot of showy new features like turn-by-turn directions and 3D flyovers. While those make for sexy commercials, they won’t be as impactful as the switch from raster- to vector-based map data. If you’re not sure why you should be excited about the change—and you should be—read on.

Check out his blog post here.


Jonathan Crowe (formerly of The Map Room, now of "My Correct Views on Everything") has a comprehensive post on the subject here.

Apple mobile mapping software? coming soon!

We mac users are all a-twitter about the news of an impending Apple mapping software. Here is a sample from NPR:

There's been speculation for months that Apple will try to elbow Google's popular Maps app aside on the iPhone and unveil its own map app, and some of the best evidence yet comes from Tuesday's Wall Street Journal.  The paper looked into the reasons for the impending switch and the broader implications it would have for the smartphone market.  The article continues...

The new software is rumored to be leaner, meaner, and packing a rad 3D visualization capability. It will be unveiled as soon as next week at the annual Apple developer conference in San Francisco.

New OSGeo-Live GIS software collection released

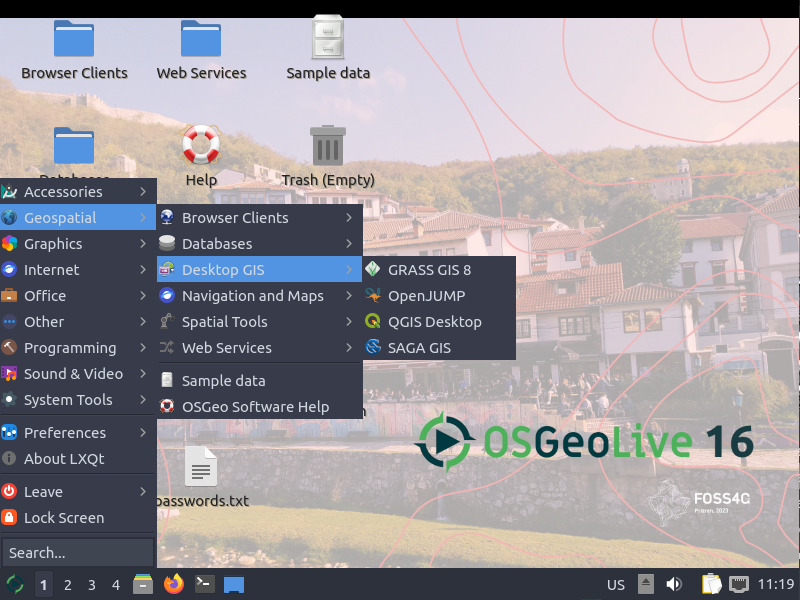
OSGeo-Live is a self-contained bootable DVD, USB flash drive and Virtual Machine based upon Ubuntu Linux that is pre-configured with a wide variety of robust open source geospatial software. The applications can be trialled without installing anything on your computer, simply by booting the computer from the DVD or USB drive. The lightening overview introduces all these applications, and hence provides a comprehensive introduction to the breadth of Geospatial Open Source.

http://live.osgeo.org

Highlights
50 Quality Geospatial Open Source applications installed and pre-configured
Quality free world maps and geodata
One page overviews and quick start guides for all applications
Overviews of key OGC standards
Translations for Greek, German, Polish, Spanish and Japanese

Contents

Browser Clients

  • OpenLayers - Browser GIS Client
  • Geomajas - Browser GIS Client
  • Mapbender - Geoportal Framework
  • MapFish - Web Mapping Framework
  • GeoMoose - Web GIS Portal

Crisis Management

  • Sahana Eden - Disaster management
  • Ushahidi - Mapping and Timeline for events

Databases

  • PostGIS - Spatial Database
  • SpatiaLite - Lightweight Database
  • Rasdaman - Multi-Dimensional Raster Database
  • pgRouting - Routing for PostGIS


Desktop GIS

  • Quantum GIS (QGIS)
  • GRASS GIS
  • gvSIG Desktop
  • User-friendly Desktop Internet GIS (uDig)
  • Kosmo Desktop
  • OpenJUMP GIS
  • SAGA
  • OSSIM - Image Processing
  • Geopublisher - Catalogue
  • AtlasStyler - Style Editor
  • osgEarth - 3D Terrain Rendering
  • MB-System - Sea Floor Mapping

Navigation and Maps

  • GpsDrive - GPS Navigation
  • Marble - Spinning Globe
  • OpenCPN - Marine GPS Chartplotter
  • OpenStreetMap - OpenStreetMap Tools
  • Prune - View, Edit and Convert GPS Tracks
  • Viking - GPS Data Analysis and Viewer
  • zyGrib - Weather Forecast Maps


Spatial Tools

  • GeoKettle - ETL (Extract, Transform and Load) Tool
  • GDAL/OGR - Geospatial Data Translation Tools
  • GMT - Cartographic Rendering
  • Mapnik - Cartographic Rendering
  • MapTiler - Create Map Tiles
  • OTB - Image Processing
  • R Spatial Task View - Statistical Programming


Web Services

  • GeoServer
  • MapServer
  • deegree
  • GeoNetwork - Metadata Catalogue
  • pycsw - Metadata Catalogue
  • MapProxy - Proxy WMS & tile services
  • QGIS Server - Web Map Service
  • 52°North WSS - Web Security Service
  • 52°North WPS - Web Processing Service
  • 52°North SOS - Sensor Observation Service
  • TinyOWS - WFS-T Service
  • ZOO Project - Web Processing Service


Data

  • Natural Earth - Geographic Data Sets
  • OSGeo North Carolina, USA Educational dataset
  • OpenStreetMap - Sample extract from OpenStreetMap


Geospatial Libraries

  • GeoTools - Java GIS Toolkit
  • MetaCRS - Coordinate Reference System Transformations
  • libLAS - LiDAR Data Access


Other software of interest (not available Live)

  • MapWindow GIS - Microsoft Windows based GIS
  • MapGuide Open Source - Web Service

New IDRISI Selva GIS and Image Processing Software Released


From Clark Labs:Image used with permission from Clark Labs

Clark Labs recently released its newest version of its geospatial and image processing software IDRISI called IDRISI Selva. IDRISI Selva is the 17th version of IDRISI which offers brand new features and significant updates to its predecessor IDRISI Taiga. IDRISI offers a suite of tools for basic and advanced spatial analysis, surface and statistical analysis, change and time series analysis, modeling, and decision support and uncertainty. IDRISI also offers a diversity of image processing tools including a variety of hard and soft classifiers, machine learning algorithms, and image segmentation tools. This latest version adds new tools to the Earth Trends Modeler application for the analysis of patterns and trends in earth observation image time series and new REDD-specific tools to the Land Change Modeler application for the modeling, prediction and impact assessment of land cover change. New analytical techniques and greater import/export support have been added, display and map composition elements have been enhanced and expanded and existing modules have been optimized.

More specifically some changes include:

  • Land Change Modeler has been enhanced and new modeling tools have been added such as SimWeight and tools to support modeling and accounting for REDD (Reducing Emissions from Deforestation and Forest Degradation) projects. An integrated interface to the Maxent software for species distribution modeling has also been added.
  • Earth Trends Modeler has been enhanced with new tools for the analysis of coupled systems such as the oceans and atmosphere. These include Extended PCA/EOF, Multi-channel Singular Spectrum Analysis, Extended EOT, Multichannel EOT and Canonical Correlation Analysis.
  • New tools have been added such as Radial Basis Function (RBF) neural network classifier, Chain Clustering, and Durbin-Watson modules.
  • Existing tools such as the distance based modules have been optimized for greater speed and the PCA module has been expanded. In addition, MODIS and Google KML file import and export support has been enhanced.
  • New support for image pyramids and large images up to 2 billion rows by 2 billion columns have been added.

For more on IDRISI Selva and specifics on what is new visit their website here or see the resources below:

IDRISI Selva news release 

IDRISI Selva brochure

IDRISI Selva what’s new brochure

Clark Labs is based within the Graduate School of Geography at Clark University in Worcester, MA. The information and images presented are used with permission from Clark Labs.

IDRISI Land Change Modeler (Image used with permission from Clark Labs)IDRISI Earth Trends Modeler (Image used with permission from Clark Labs)


3D Street level mapping with earthmine


earthmine's Anthony Fassero visited yesterday to give a Geolunch presentation and blew us away with the amazing technology that they are employing!  Anthony, and Co-Founder John Ristevski started earthmine just a few years ago after graduating from Cal. 

earthmine has developed the camera system and engineering to take high resolution 3d street level images using only photogrammetric techniques (no lidar), as well as software tools that allow users to work with the data directly in ArcGIS and other geospatial applications. These tools allow you to not only view the data alongside a map, but to actualy make 3d measurements one the fly and edit ancillary data layers from within the phot view.

You have to see it for yourself!  Check out this video to see teh data and tools in action.

MIT releases new Urban Network Analysis Tool for ArcGIS 10

The MIT City Form Research Group recently released a new open-source plugin for ArcGIS 10 to perform advanced spatial analyses on network data such as urban street networks. The tool can give researchers a better understanding of how the spatial layout of cities and their social, economic, and environmental processes affect the way people live in it.

The tool measures reach, gravity, betweenness, closeness, and straightness on spatial networks. This means you can assess the number of services or resources within a certain walking distance and can analyze the volume of traffic along sidewalks and streets. Like other network analysis tools, the tool evaluates network element geometry and distance and distinguishes between shorter and longer links. What is unique about this tool is that it not only operates with node and edge elements like other network analysis tools, but it can also incorporate additional network elements such as buildings. Individual buildings or objects can be characterized within spatial networks and can be weighted to give more or less influence. For example, more populated buildings can be set to have a greater impact on results. The tool can also be used to assess urban growth and change.

Click here for the press release.

ESRI's ChangeMatters and New Landsat Image Services

Yesterday at the annual ASPRS conference in Milwaukee, WI (yes there were sausages shaped like the state), Jack Dangermond announced the release of ChangeMatters, and new Landsat Image Services from ESRI.

ChangeMatters. Working with partners, ESRI developed this web application - ChangeMatters - which allows users throughout the globe to quickly view the GLS Landsat imagery both multi-spectrally (in different Landsat band combinations) and multi-temporally (across epochs), and to conduct simple change detection analysis.

Image Services, with examples of vegetation, false color, land-water band combinations in seamless, color matched Landsat mosaics. Downloads will be available soon. Pretty nice. Website.

Example from ChangeMatters: Las Vegas from 1975 - 2000. Green is increase and red decrease in veg


New Google SketchUp plug-in integrates 3D laser scan data

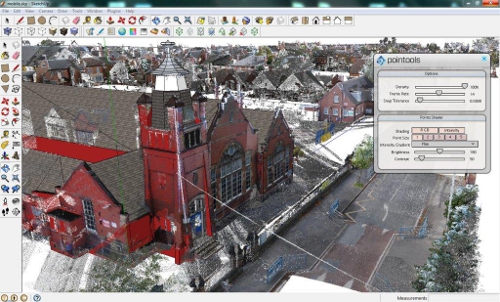
Pointools has just announced the availability of a new plug-in for Google SketchUp to be released in a few weeks. This new plug-in will make it easy to visualize and use point cloud data from sources such as mobile ground based scans and aerial lidar for 3D model building in Google SketchUp. The plug-in offers built-in support for Google’s geo-location services to coordinate StreetView textures and aerial imagery alongside point clouds. This new tool allows for a new data source to be used to create photo realistic 3D models of buildings and landscapes.

Click here for the full story and here for a video of the plug-in in action.

Image Source: Pointools Wordpress

ArcGIS 10 coming in June

The latest ArcGIS release, ArcGIS 10, is slated to become available in June with a lot of big updates.  Check out ESRI's website to see more about what's coming.  They have several informative videos that demo the new software. 

Some of the improvements listed include:

  • Faster display, smoother navigation, and the ability to run geoprocessing in the background.
  • Perform in 3D virtually everything you can do in a 2D environment: modeling, editing, visualization, and analysis.
  • Simplify map creation and production with streamlined sketch-based Desktop (2D/3D) and Web editing.
  • Use and manage imagery more efficiently on the desktop and on the server.
  • New image analysis window for image interpretation and processing.
  • Automate common tasks and analyses with Python scripting.


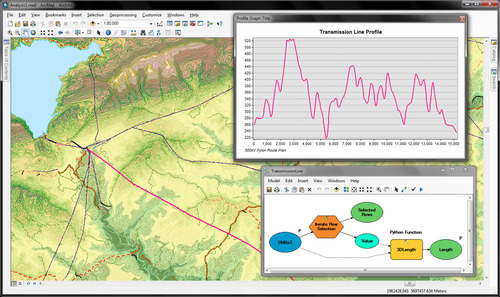
New: Geospatial Modelling Environment

If you're a fan of Hawth's tools, be sure to check out SpatialEcology.com's latest product, Geospatial Modelling Environment.

"It combines the power of the statistical software R with the geographic processing functionality of ESRI ArcGIS to drive geospatial analyses.

"It incorporates most of the functionality of its predecessor, HawthsTools, but with some important improvements. It has a greater range of analysis and modelling tools, supports batch processing, offers new graphing functionality, automatically records work-flows for future reference, supports geodatabases, and can be called programatically." - http://www.spatialecology.com/gme/

TauDEM software: for your hydro modeling needs

This was recommended to me recently by Orien; he is using it to create topographic indices to use as ancillary data in an object-based classification of palustrine wetlands in the foothills of the Sierra Nevada. These wetland sites are terrifically important for rails, and mapping them efficiently is a challenge.  Topographic information is proving useful in the classification, and Orien used this software rather than the ArcGIS hydro modeler suite.

From David Tarboton at Utah State: Terrain Analysis Using Digital Elevation Models (TauDEM) is a set of tools for the analysis of terrain using digital elevation models. TauDEM currently provides numerous capabilities that expand on the ESRI suite including (more listed on website):

  • Computation of flow directions and slopes;
  • Contributing area using single and multiple flow direction methods;
  • Multiple methods for the delineation of channel networks that include curvature;
  • Delineation of watersheds and subwatersheds draining to each stream segment; and
  • Specialized functions for terrain analysis, including wetness indices, accumulation measures, and downslope and upslope functions.

New 'Map Illustration' Software for Mac Users

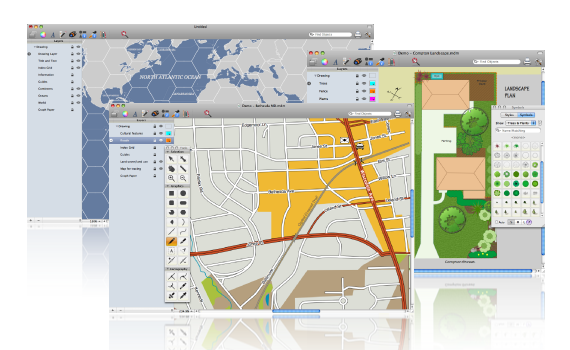
Mapdiva, LLC has just resleased its map illustration software OrteliusTM  for Mac computers. It's only 30Mb to download a free 31-day trial version, and for now they're offering an 'Introductory Price' of $79 (versus $99) until the end of September. An Education Edition is also available only $39 (after Sept. 30 willl be $49) for currently enrolled students with a valid .edu address.

Note that the company states, "Ortelius is designed for cartographic output as the end product, intentionally not a GIS system, though the Professional Edition with add more GIS-type operations to the currently available tools. On a general note the Standard Edition is likely to fall short in some aspects for hardcore geographers and GIS users; the Professional Edition is intended to provide many more GIS features." So some users may want to wait for the Pro Edition for increased functionality.

From The Map Room