Day 2 Wrap Up from the NEON Data Institute 2017

First of all, Pearl Street Mall is just as lovely as I remember, but OMG it is so crowded, with so many new stores and chains. Still, good food, good views, hot weather, lovely walk.

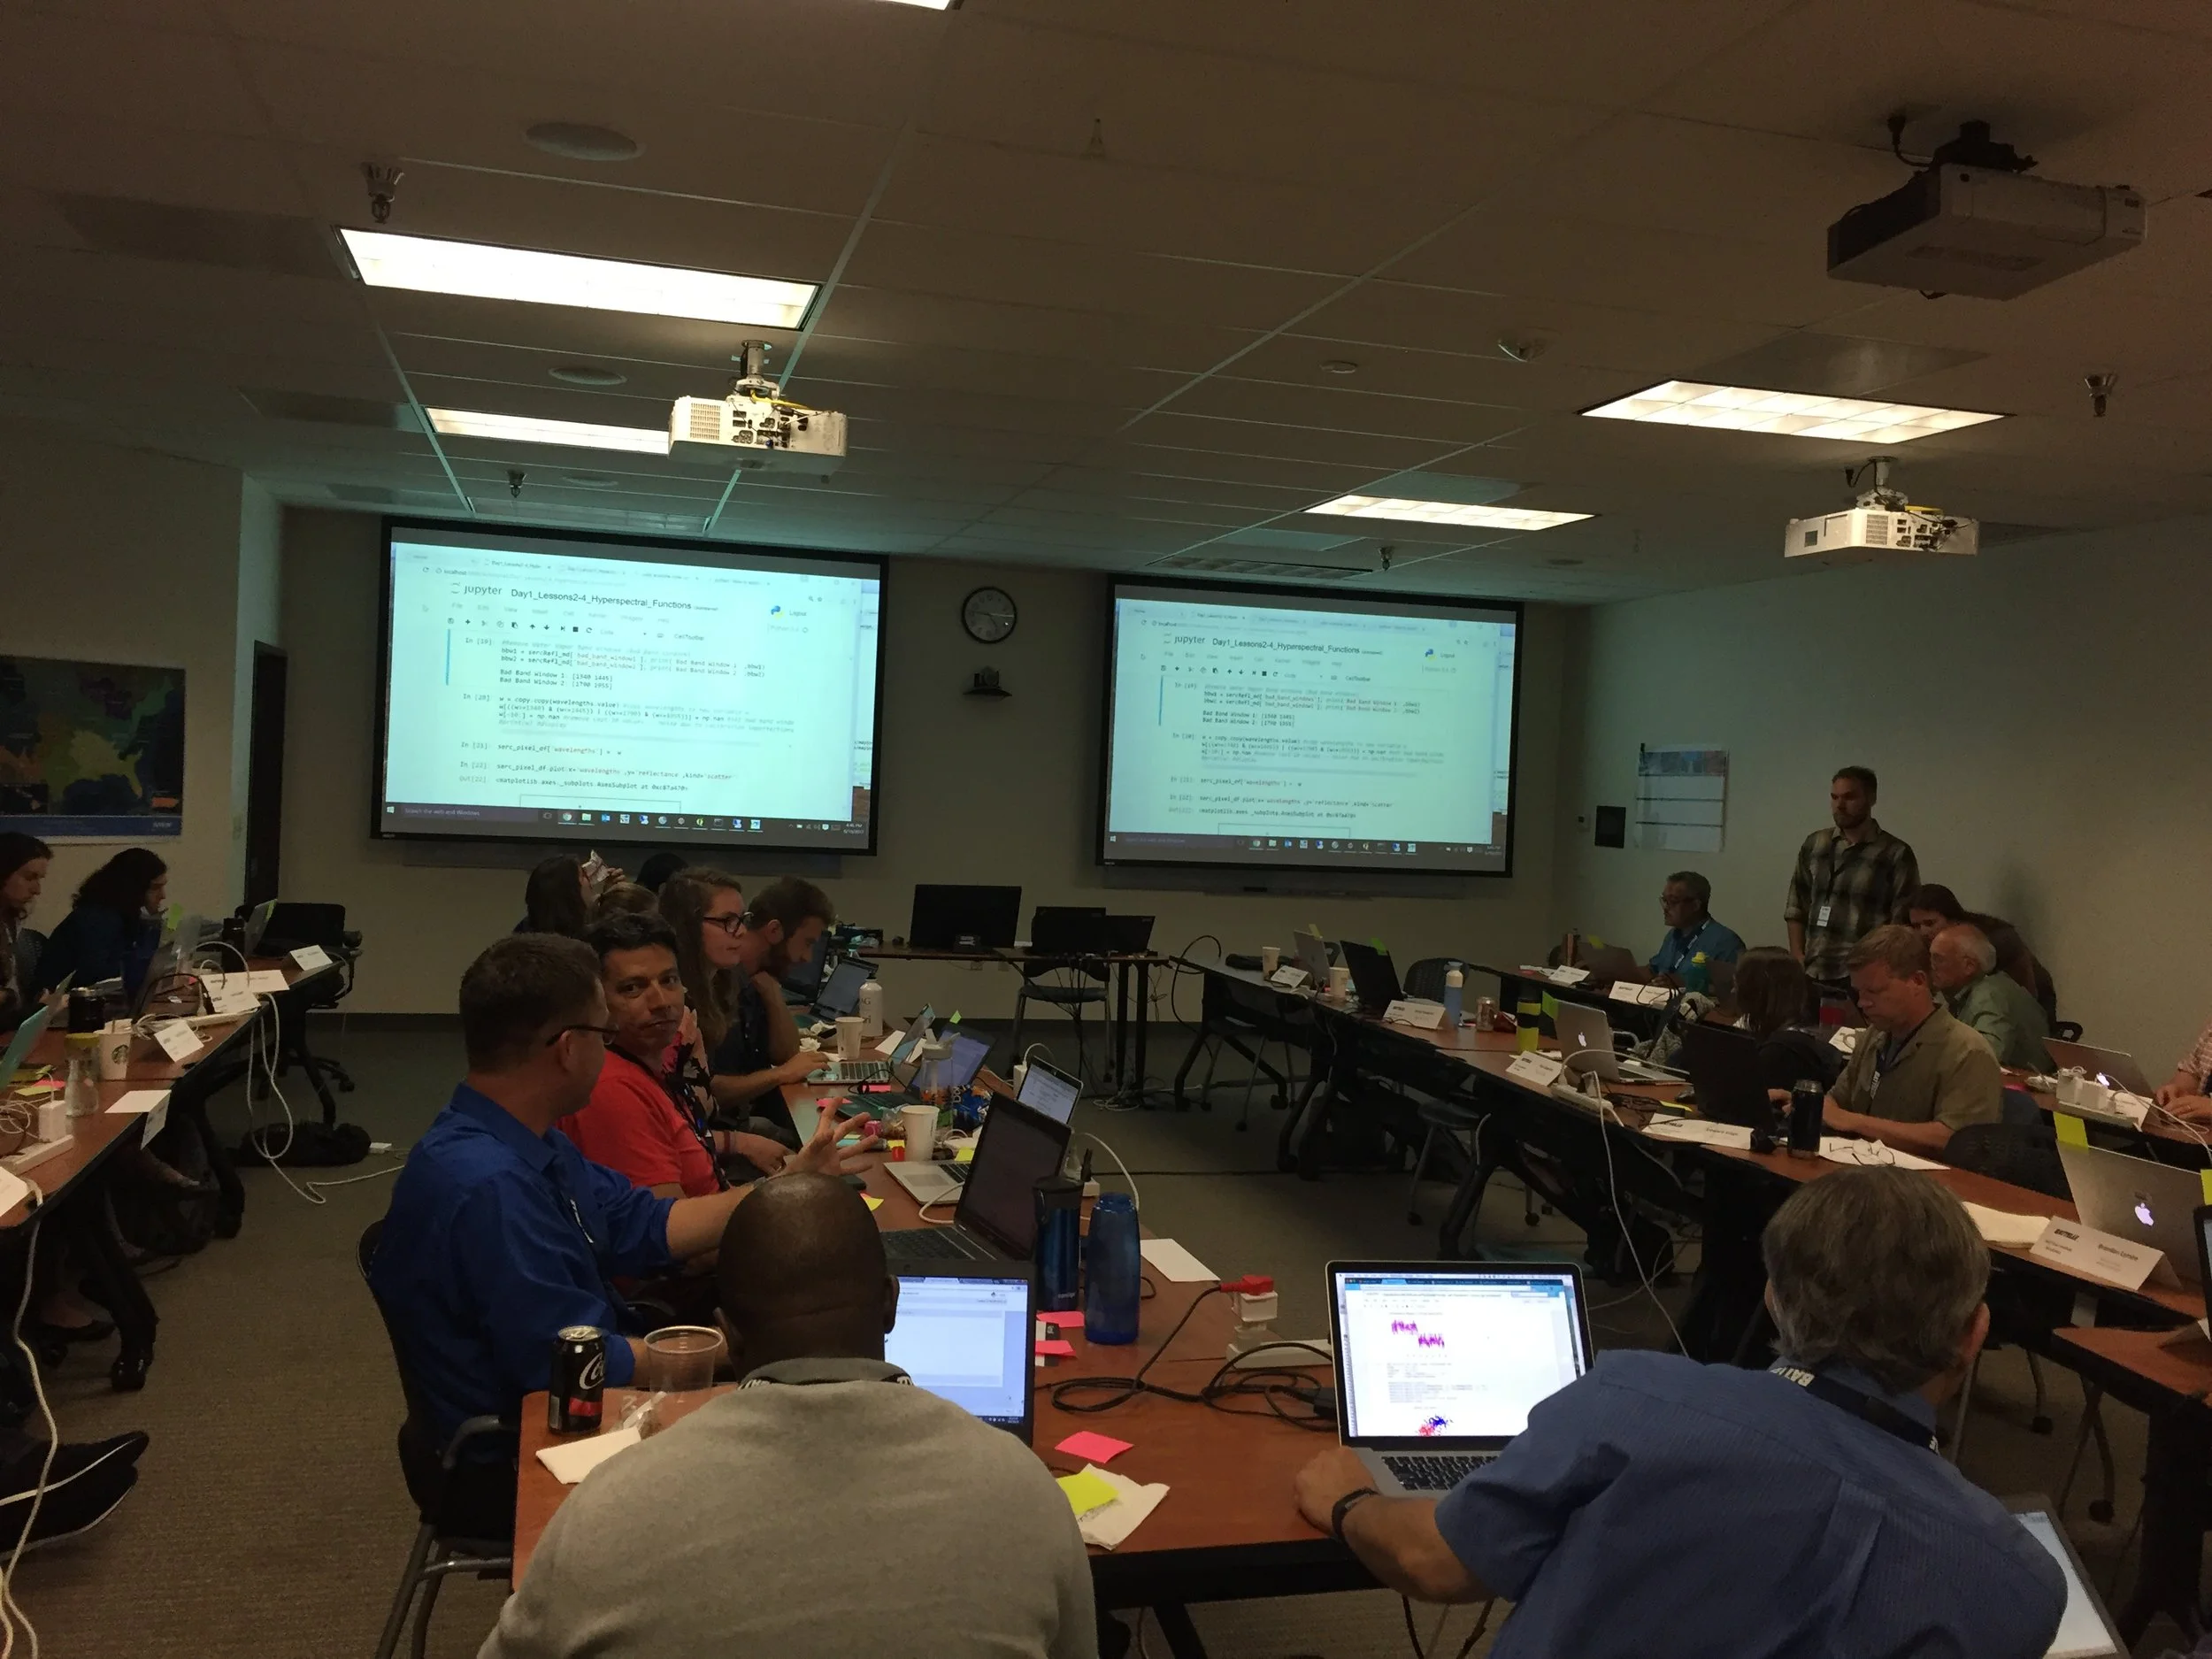
Welcome to Day 2! http://neondataskills.org/data-institute-17/day2/
Our morning session focused on reproducibility and workflows with the great Naupaka Zimmerman. Remember the characteristics of reproducibility - organization, automation, documentation, and dissemination. We focused on organization, and spent an enjoyable hour sorting through an example messy directory of misc data files and code. The directory looked a bit like many of my directories. Lesson learned. We then moved to working with new data and git to reinforce yesterday's lessons. Git was super confusing to me 2 weeks ago, but now I think I love it. We also went back and forth between Jupyter and python stand alone scripts, and abstracted variables, and lo and behold I got my script to run. All the git stuff is from http://swcarpentry.github.io/git-novice/

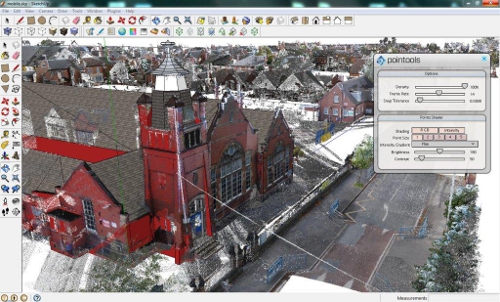
The afternoon focused on Lidar (yay!) and prior to coding we talked about discrete and waveform data and collection, and the opentopography (http://www.opentopography.org/) project with Benjamin Gross. The opentopography talk was really interesting. They are not just a data distributor any more, they also provide a HPC framework (mostly TauDEM for now) on their servers at SDSC (http://www.sdsc.edu/). They are going to roll out a user-initiated HPC functionality soon, so stay tuned for their new "pluggable assets" program. This is well worth checking into. We also spent some time live coding with Python with Bridget Hass working with a CHM from the SERC site in California, and had a nerve-wracking code challenge to wrap up the day.

Fun additional take-home messages/resources:

Thanks to everyone today! Megan Jones (our fearless leader), Naupaka Zimmerman (Reproducibility), Tristan Goulden (Discrete Lidar), Keith Krause (Waveform Lidar), Benjamin Gross (OpenTopography), Bridget Hass (coding lidar products).

Day 1 Wrap Up
Day 2 Wrap Up 
Day 3 Wrap Up
Day 4 Wrap Up

Our home for the week

Our home for the week

Day 1 Wrap Up from the NEON Data Institute 2017

I left Boulder 20 years ago on a wing and a prayer with a PhD in hand, overwhelmed with bittersweet emotions. I was sad to leave such a beautiful city, nervous about what was to come, but excited to start something new in North Carolina. My future was uncertain, and as I took off from DIA that final time I basically had Tom Petty's Free Fallin' and Learning to Fly on repeat on my walkman. Now I am back, and summer in Boulder is just as breathtaking as I remember it: clear blue skies, the stunning flatirons making a play at outshining the snow-dusted Rockies behind them, and crisp fragrant mountain breezes acting as my Madeleine. I'm back to visit the National Ecological Observatory Network (NEON) headquarters and attend their 2017 Data Institute, and re-invest in my skillset for open reproducible workflows in remote sensing. 

Day 1 Wrap Up from the NEON Data Institute 2017
What a day! http://neondataskills.org/data-institute-17/day1/
Attendees (about 30) included graduate students, old dogs (new tricks!) like me, and research scientists interested in developing reproducible workflows into their work. We are a pretty even mix of ages and genders. The morning session focused on learning about the NEON program (http://www.neonscience.org/): its purpose, sites, sensors, data, and protocols. NEON, funded by NSF and managed by Battelle, was conceived in 2004 and will go online for a 30-year mission providing free and open data on the drivers of and responses to ecological change starting in Jan 2018. NEON data comes from IS (instrumented systems), OS (observation systems), and RS (remote sensing). We focused on the Airborne Observation Platform (AOP) which uses 2, soon to be 3 aircraft, each with a payload of a hyperspectral sensor (from JPL, 426, 5nm bands (380-2510 nm), 1 mRad IFOV, 1 m res at 1000m AGL) and lidar (Optech and soon to be Riegl, discrete and waveform) sensors and a RGB camera (PhaseOne D8900). These sensors produce co-registered raw data, are processed at NEON headquarters into various levels of data products. Flights are planned to cover each NEON site once, timed to capture 90% or higher peak greenness, which is pretty complicated when distance and weather are taken into account. Pilots and techs are on the road and in the air from March through October collecting these data. Data is processed at headquarters.

In the afternoon session, we got through a fairly immersive dunk into Jupyter notebooks for exploring hyperspectral imagery in HDF5 format. We did exploration, band stacking, widgets, and vegetation indices. We closed with a fast discussion about TGF (The Git Flow): the way to store, share, control versions of your data and code to ensure reproducibility. We forked, cloned, committed, pushed, and pulled. Not much more to write about, but the whole day was awesome!

Fun additional take-home messages:

Thanks to everyone today, including: Megan Jones (Main leader), Nathan Leisso (AOP), Bill Gallery (RGB camera), Ted Haberman (HDF5 format), David Hulslander (AOP), Claire Lunch (Data), Cove Sturtevant (Towers), Tristan Goulden (Hyperspectral), Bridget Hass (HDF5), Paul Gader, Naupaka Zimmerman (GitHub flow).

Day 1 Wrap Up
Day 2 Wrap Up 
Day 3 Wrap Up
Day 4 Wrap Up

rOpenSci- new R package to search biodiversity data

Awesome new (ish?) R package from the gang over at rOpenSci 

Tired of searching biodiversity occurance data through individual platforms? The "spocc" package comes to your rescue and allows for a streamlined workflow in the collection and mapping of species occurrence data from range of sites including: GBIF, iNaturalist, Ecoengine, AntWeb, eBird, and USGS's BISON.

There is a caveat however, since the sites use alot of the same repositories the authors of the package caution to check for dulicates. Regardless what a great way to simplify your workflow!

Find the package from CRAN: install.packages("spocc") and read more about it here!

Sierra Nevada Decision Support System

Former student and GIS expert Chippie Kislik alerted me to this video. She is working with others at NASA Ames on a Sierra Nevada DSS Ecological Forecasting Project. A video about the project is here.

The Sierra Nevada contains vital ecosystems that are experiencing changes in hydrologic regimes, such as decreases in snowmelt and peak runoff, which affect forest health and water resources. Currently, the U.S. Forest Service Region 5 office is undergoing Forest Plan revisions to integrate climate-change impacts into mitigation and adaptation strategies. However, there are few tools in place to conduct quantitative assessments of forest and surface conditions in relation to mountain hydrology, while easily and effectively delivering that information to forest managers. To assist the Forest Service, this research team created a Decision Support System (DSS) featuring data integration, data viewing, reporting, and forecasting of ecological conditions within all Sierra Nevada intersecting watersheds.

Clark Labs to Create Cloud-based Land Change Modeler for ArcGIS

Clark Labs was awarded a million dollar grant from Esri to create a cloud-based version of their Land Change Modeler for ArcGIS. Land Change Modeler is suite of tools to assess and predict land change and evaluate the impacts of change and includes REDD (Reducing Emissions from Deforestation and Forest Degradation) tools for modeling the impact of land cover change on carbon emissions. Currently Land Change Modeler is only available in IDRISI and as a software extension for ArcGIS (the latest version is compatible with v10.2). This will make this tool more easily assessable to the wider public and scientific community.

From Clark Labs press release:

"Clark Labs was recently awarded a million dollar grant from Esri to create a cloud-based version of their Land Change Modeler for ArcGIS. Currently, Clark Labs’ extension is for the ArcGIS desktop.

Land Change Modeler for ArcGIS, first released in 2007 with Version 2 released this past month, is a software extension for ArcGIS users, offering a suite of tools to assess and predict land change and evaluate the impacts of such change. Clark Labs recent release includes many significant enhancements. The new version is compatible with ArcGIS Version 10.2

The Land Change Modeler offers an extensive suite of tools for land change research in a simple and automated workflow. It provides a variety of tools for land change analysis and prediction, as well as the impacts of those changes.

The new version release of this fall provides significant enhancements, particularly for its utility for REDD (Reducing Emissions from Deforestation and Forest Degradation). Land Change Modeler now includes functionality for modeling the impact of land cover change on carbon emissions. “Our world is changing rapidly, and technology to efficiently model and predict future land change is vital to addressing global challenges,’ said Jack Dangermond, Esri President. “We’re pleased to award this grant to Clark Labs to jumpstart their effort to utilize and provide rich content through ArcGIS Online.”

The new version also provides more capability for estimating land change impacts on habitat and biodiversity. With the grant from Esri, Clark Labs will be creating a cloud-based implementation of Land Change Modeler for their platform.

Clark Labs and Esri have been business partners for nearly ten years, working collaboratively on GIS research."

For the full news release see here.

Hey OakMappers! Updated OakMapper available for iPhones and iPads

The new OakMapper logo

We are excited to announce the new version (2.3) of the OakMapper iPhone/iPad App, available to download now for free at the iTunes App Store [link].

In this version of the OakMapper App, the original browse and search functionalities have been retooled to improve the user interface design and user interaction. A new user can sign up for a new OakMapper account directly using the App. Users who has logged into their account can manage their profile, change their password, and submit a SOD point. The submission process has been re-engineered to achieve a better and more intuitive submission workflow. Users can also take a picture of a suspected SOD infected tree and upload it right from their iOS devices.

To explore all the new features of the OakMapper iPhone/iPad App, please install OakMapper from the iTunes App Store [link] now. Please feel free to share this App with your friends. If you like the OakMapper app, please rate the app and leave your comments in the App store. If you should have any questions, please email us at oakmapper@gmail.com.

Enjoy!

OakMapper
Shufei Lei, Web/Mobile App Developer
Maggi Kelly, Principal Investigator
www.oakmapper.org

Mapping and interactive projections with D3

D3 is a javascript library that brings data to life through an unending array of vizualizations.  Whether you've realized it or not, D3 has been driving many of the most compeling data visualizations that you have likely seen throughout the last year including a popular series of election tracking tools in the New York Times.

You can find a series of examples in D3's gallery that will keep you busy for hours!

In addition to the fantastic charting tools, D3 also enables a growing list of mapping capabilities.  It is really exciting to see where all this is heading.  D3's developers have been spending a lot of time most recently working on projections transformations.  Check out these amazing interactive projection examples:

Projection Transitions

Comparing Map Projections

Adaptive Composite Map Projections (be sure to use chrome for the text to display correctly)

Can't wait to see what the future has in store for bringng custom map projections to life in more web map applications!


ESRI MODIS Toolbox

Cool MODIS NDVI tool pointed out to us from Jenny P.

This toolbox contains scripts that download NASA satellite imagery from MODIS and import it into ArcMap. The four data products currently supported are: evapotranspiration, land surface temperature, normalized difference vegetation index (NDVI), and enhanced vegetation index (EVI).

These products are available for the entire surface of the Earth at 1 km resolution and for any month going back to January 2000, when MODIS first launched aboard the satellite Terra.

http://resources.arcgis.com/gallery/file/geoprocessing/details?entryID=9CC382D2-1422-2418-34F8-DC9F97B24052

CartoDB launches tools for visualizing temporal data

CartoDB, a robust and easy to use web mapping application, today launched "torque" a new feature enabling visualization of temporal data sets. 

From the CartoDB team:

Torque is a library for CartoDB that allows you to create beautiful visualizations with temporal datasets by bundling HTML5 browser rendering technologies with an efficient data transfer format using the CartoDB API. You can see an example of Torque in action on the Guardian's Data Blog, and grab the open source code from here.

Be sure to check out the example based on location data recorded from Captain's logs from the British Royal Navy during the first World War.  Amazing stuff!


New ArcGIS and QGIS desktop versions available

Big updates are now available to both ArcGIS and QGIS bringing more power and functionality to desktop GIS users!

ArcGIS 10.1 is now available with lots of new features.  Learn more from ESRI.com.  The GIF is now testing the updated software and we plan to make it available on lab workstations in the coming weeks.

QGIS 1.8 is also now available, and is free for download.  Visit QGIS.org for download instructions and to learn more about the new features available in this release.

New software to extract geographically representative images from Google Street View

New software developed by Carnegie Mellon University in Pittsburgh and INRIA in Paris mines the geotagged imagery in Google Street View to uncover what architectural features distinguish one city from another across the globe. The software is based upon a discriminative clustering algorithm to distinguish features in one picture from another. This research shows that geographically representative image elements can be discovered automatically from Google Street View imagery in a discriminative manner.

Jacob Aron from the New Scientist reports:

"The researchers selected 12 cities from across the globe and analysed 10,000 Google Street View images from each. Their algorithm searches for visual features that appear often in one location but infrequently elsewhere...It turns out that ornate windows and balconies, along with unique blue-and-green street signs, characterise Paris, while columned doorways, Victorian windows and cast-iron railings mark London out from the rest. In the US, long staircases and bay windows mean San Francisco, and gas-powered street lamps are scattered throughout Boston."

"The discovered visual elements can also support a variety of computational geography tasks, such as mapping architectural correspondences and influences within and across cities, finding representative elements at different geo-spatial scales, and geographically-informed image retrieval."

Read the full story by clicking here.

To read the research paper and view the project website click here.

New OSGeo-Live GIS software collection released

OSGeo-Live is a self-contained bootable DVD, USB flash drive and Virtual Machine based upon Ubuntu Linux that is pre-configured with a wide variety of robust open source geospatial software. The applications can be trialled without installing anything on your computer, simply by booting the computer from the DVD or USB drive. The lightening overview introduces all these applications, and hence provides a comprehensive introduction to the breadth of Geospatial Open Source.

http://live.osgeo.org

Highlights
50 Quality Geospatial Open Source applications installed and pre-configured
Quality free world maps and geodata
One page overviews and quick start guides for all applications
Overviews of key OGC standards
Translations for Greek, German, Polish, Spanish and Japanese

Contents

Browser Clients

  • OpenLayers - Browser GIS Client
  • Geomajas - Browser GIS Client
  • Mapbender - Geoportal Framework
  • MapFish - Web Mapping Framework
  • GeoMoose - Web GIS Portal

Crisis Management

  • Sahana Eden - Disaster management
  • Ushahidi - Mapping and Timeline for events

Databases

  • PostGIS - Spatial Database
  • SpatiaLite - Lightweight Database
  • Rasdaman - Multi-Dimensional Raster Database
  • pgRouting - Routing for PostGIS


Desktop GIS

  • Quantum GIS (QGIS)
  • GRASS GIS
  • gvSIG Desktop
  • User-friendly Desktop Internet GIS (uDig)
  • Kosmo Desktop
  • OpenJUMP GIS
  • SAGA
  • OSSIM - Image Processing
  • Geopublisher - Catalogue
  • AtlasStyler - Style Editor
  • osgEarth - 3D Terrain Rendering
  • MB-System - Sea Floor Mapping

Navigation and Maps

  • GpsDrive - GPS Navigation
  • Marble - Spinning Globe
  • OpenCPN - Marine GPS Chartplotter
  • OpenStreetMap - OpenStreetMap Tools
  • Prune - View, Edit and Convert GPS Tracks
  • Viking - GPS Data Analysis and Viewer
  • zyGrib - Weather Forecast Maps


Spatial Tools

  • GeoKettle - ETL (Extract, Transform and Load) Tool
  • GDAL/OGR - Geospatial Data Translation Tools
  • GMT - Cartographic Rendering
  • Mapnik - Cartographic Rendering
  • MapTiler - Create Map Tiles
  • OTB - Image Processing
  • R Spatial Task View - Statistical Programming


Web Services

  • GeoServer
  • MapServer
  • deegree
  • GeoNetwork - Metadata Catalogue
  • pycsw - Metadata Catalogue
  • MapProxy - Proxy WMS & tile services
  • QGIS Server - Web Map Service
  • 52°North WSS - Web Security Service
  • 52°North WPS - Web Processing Service
  • 52°North SOS - Sensor Observation Service
  • TinyOWS - WFS-T Service
  • ZOO Project - Web Processing Service


Data

  • Natural Earth - Geographic Data Sets
  • OSGeo North Carolina, USA Educational dataset
  • OpenStreetMap - Sample extract from OpenStreetMap


Geospatial Libraries

  • GeoTools - Java GIS Toolkit
  • MetaCRS - Coordinate Reference System Transformations
  • libLAS - LiDAR Data Access


Other software of interest (not available Live)

  • MapWindow GIS - Microsoft Windows based GIS
  • MapGuide Open Source - Web Service

New IDRISI Selva GIS and Image Processing Software Released


From Clark Labs:Image used with permission from Clark Labs

Clark Labs recently released its newest version of its geospatial and image processing software IDRISI called IDRISI Selva. IDRISI Selva is the 17th version of IDRISI which offers brand new features and significant updates to its predecessor IDRISI Taiga. IDRISI offers a suite of tools for basic and advanced spatial analysis, surface and statistical analysis, change and time series analysis, modeling, and decision support and uncertainty. IDRISI also offers a diversity of image processing tools including a variety of hard and soft classifiers, machine learning algorithms, and image segmentation tools. This latest version adds new tools to the Earth Trends Modeler application for the analysis of patterns and trends in earth observation image time series and new REDD-specific tools to the Land Change Modeler application for the modeling, prediction and impact assessment of land cover change. New analytical techniques and greater import/export support have been added, display and map composition elements have been enhanced and expanded and existing modules have been optimized.

More specifically some changes include:

  • Land Change Modeler has been enhanced and new modeling tools have been added such as SimWeight and tools to support modeling and accounting for REDD (Reducing Emissions from Deforestation and Forest Degradation) projects. An integrated interface to the Maxent software for species distribution modeling has also been added.
  • Earth Trends Modeler has been enhanced with new tools for the analysis of coupled systems such as the oceans and atmosphere. These include Extended PCA/EOF, Multi-channel Singular Spectrum Analysis, Extended EOT, Multichannel EOT and Canonical Correlation Analysis.
  • New tools have been added such as Radial Basis Function (RBF) neural network classifier, Chain Clustering, and Durbin-Watson modules.
  • Existing tools such as the distance based modules have been optimized for greater speed and the PCA module has been expanded. In addition, MODIS and Google KML file import and export support has been enhanced.
  • New support for image pyramids and large images up to 2 billion rows by 2 billion columns have been added.

For more on IDRISI Selva and specifics on what is new visit their website here or see the resources below:

IDRISI Selva news release 

IDRISI Selva brochure

IDRISI Selva what’s new brochure

Clark Labs is based within the Graduate School of Geography at Clark University in Worcester, MA. The information and images presented are used with permission from Clark Labs.

IDRISI Land Change Modeler (Image used with permission from Clark Labs)IDRISI Earth Trends Modeler (Image used with permission from Clark Labs)


forests to faucets: cool new tool from the forest service

The US Forest Service has released their "forest to faucet" program last week. It looks at the importance of forests to surface water. Built in ArcGIS server, it quickly maps, by watershed:

  • Surface Drinking Water Importance Index   
  • Index of Forest Importance to Surface Drinking Water   
  • Index of insect and disease threat to forests important to surface drinking water   
  • Index of development threat to forests important to surface drinking water
  • Index of wildland fire threat to forests important to surface drinking water

Check it out: http://www.fs.fed.us/ecosystemservices/FS_Efforts/forests2faucets.shtml

3D Street level mapping with earthmine


earthmine's Anthony Fassero visited yesterday to give a Geolunch presentation and blew us away with the amazing technology that they are employing!  Anthony, and Co-Founder John Ristevski started earthmine just a few years ago after graduating from Cal. 

earthmine has developed the camera system and engineering to take high resolution 3d street level images using only photogrammetric techniques (no lidar), as well as software tools that allow users to work with the data directly in ArcGIS and other geospatial applications. These tools allow you to not only view the data alongside a map, but to actualy make 3d measurements one the fly and edit ancillary data layers from within the phot view.

You have to see it for yourself!  Check out this video to see teh data and tools in action.

MIT releases new Urban Network Analysis Tool for ArcGIS 10

The MIT City Form Research Group recently released a new open-source plugin for ArcGIS 10 to perform advanced spatial analyses on network data such as urban street networks. The tool can give researchers a better understanding of how the spatial layout of cities and their social, economic, and environmental processes affect the way people live in it.

The tool measures reach, gravity, betweenness, closeness, and straightness on spatial networks. This means you can assess the number of services or resources within a certain walking distance and can analyze the volume of traffic along sidewalks and streets. Like other network analysis tools, the tool evaluates network element geometry and distance and distinguishes between shorter and longer links. What is unique about this tool is that it not only operates with node and edge elements like other network analysis tools, but it can also incorporate additional network elements such as buildings. Individual buildings or objects can be characterized within spatial networks and can be weighted to give more or less influence. For example, more populated buildings can be set to have a greater impact on results. The tool can also be used to assess urban growth and change.

Click here for the press release.

New Google SketchUp plug-in integrates 3D laser scan data

Pointools has just announced the availability of a new plug-in for Google SketchUp to be released in a few weeks. This new plug-in will make it easy to visualize and use point cloud data from sources such as mobile ground based scans and aerial lidar for 3D model building in Google SketchUp. The plug-in offers built-in support for Google’s geo-location services to coordinate StreetView textures and aerial imagery alongside point clouds. This new tool allows for a new data source to be used to create photo realistic 3D models of buildings and landscapes.

Click here for the full story and here for a video of the plug-in in action.

Image Source: Pointools Wordpress

corridor analysis tools

Alan shared a link with me for Corridor Design. It includes downloads for various GIS Tools, overviews of corridor concepts, and reports on linkage designs. The stated goal is "to transfer everything we've learned about designing wildlife corridors to the general public to facilitate better conservation, science, and dialogue."  Check out the site's blog for info on their latest projects.