Day 2 Wrap Up from the NEON Data Institute 2017

First of all, Pearl Street Mall is just as lovely as I remember, but OMG it is so crowded, with so many new stores and chains. Still, good food, good views, hot weather, lovely walk.

Welcome to Day 2! http://neondataskills.org/data-institute-17/day2/
Our morning session focused on reproducibility and workflows with the great Naupaka Zimmerman. Remember the characteristics of reproducibility - organization, automation, documentation, and dissemination. We focused on organization, and spent an enjoyable hour sorting through an example messy directory of misc data files and code. The directory looked a bit like many of my directories. Lesson learned. We then moved to working with new data and git to reinforce yesterday's lessons. Git was super confusing to me 2 weeks ago, but now I think I love it. We also went back and forth between Jupyter and python stand alone scripts, and abstracted variables, and lo and behold I got my script to run. All the git stuff is from http://swcarpentry.github.io/git-novice/

The afternoon focused on Lidar (yay!) and prior to coding we talked about discrete and waveform data and collection, and the opentopography (http://www.opentopography.org/) project with Benjamin Gross. The opentopography talk was really interesting. They are not just a data distributor any more, they also provide a HPC framework (mostly TauDEM for now) on their servers at SDSC (http://www.sdsc.edu/). They are going to roll out a user-initiated HPC functionality soon, so stay tuned for their new "pluggable assets" program. This is well worth checking into. We also spent some time live coding with Python with Bridget Hass working with a CHM from the SERC site in California, and had a nerve-wracking code challenge to wrap up the day.

Fun additional take-home messages/resources:

Thanks to everyone today! Megan Jones (our fearless leader), Naupaka Zimmerman (Reproducibility), Tristan Goulden (Discrete Lidar), Keith Krause (Waveform Lidar), Benjamin Gross (OpenTopography), Bridget Hass (coding lidar products).

Day 1 Wrap Up
Day 2 Wrap Up 
Day 3 Wrap Up
Day 4 Wrap Up

Our home for the week

Our home for the week

Day 1 Wrap Up from the NEON Data Institute 2017

I left Boulder 20 years ago on a wing and a prayer with a PhD in hand, overwhelmed with bittersweet emotions. I was sad to leave such a beautiful city, nervous about what was to come, but excited to start something new in North Carolina. My future was uncertain, and as I took off from DIA that final time I basically had Tom Petty's Free Fallin' and Learning to Fly on repeat on my walkman. Now I am back, and summer in Boulder is just as breathtaking as I remember it: clear blue skies, the stunning flatirons making a play at outshining the snow-dusted Rockies behind them, and crisp fragrant mountain breezes acting as my Madeleine. I'm back to visit the National Ecological Observatory Network (NEON) headquarters and attend their 2017 Data Institute, and re-invest in my skillset for open reproducible workflows in remote sensing. 

Day 1 Wrap Up from the NEON Data Institute 2017
What a day! http://neondataskills.org/data-institute-17/day1/
Attendees (about 30) included graduate students, old dogs (new tricks!) like me, and research scientists interested in developing reproducible workflows into their work. We are a pretty even mix of ages and genders. The morning session focused on learning about the NEON program (http://www.neonscience.org/): its purpose, sites, sensors, data, and protocols. NEON, funded by NSF and managed by Battelle, was conceived in 2004 and will go online for a 30-year mission providing free and open data on the drivers of and responses to ecological change starting in Jan 2018. NEON data comes from IS (instrumented systems), OS (observation systems), and RS (remote sensing). We focused on the Airborne Observation Platform (AOP) which uses 2, soon to be 3 aircraft, each with a payload of a hyperspectral sensor (from JPL, 426, 5nm bands (380-2510 nm), 1 mRad IFOV, 1 m res at 1000m AGL) and lidar (Optech and soon to be Riegl, discrete and waveform) sensors and a RGB camera (PhaseOne D8900). These sensors produce co-registered raw data, are processed at NEON headquarters into various levels of data products. Flights are planned to cover each NEON site once, timed to capture 90% or higher peak greenness, which is pretty complicated when distance and weather are taken into account. Pilots and techs are on the road and in the air from March through October collecting these data. Data is processed at headquarters.

In the afternoon session, we got through a fairly immersive dunk into Jupyter notebooks for exploring hyperspectral imagery in HDF5 format. We did exploration, band stacking, widgets, and vegetation indices. We closed with a fast discussion about TGF (The Git Flow): the way to store, share, control versions of your data and code to ensure reproducibility. We forked, cloned, committed, pushed, and pulled. Not much more to write about, but the whole day was awesome!

Fun additional take-home messages:

Thanks to everyone today, including: Megan Jones (Main leader), Nathan Leisso (AOP), Bill Gallery (RGB camera), Ted Haberman (HDF5 format), David Hulslander (AOP), Claire Lunch (Data), Cove Sturtevant (Towers), Tristan Goulden (Hyperspectral), Bridget Hass (HDF5), Paul Gader, Naupaka Zimmerman (GitHub flow).

Day 1 Wrap Up
Day 2 Wrap Up 
Day 3 Wrap Up
Day 4 Wrap Up

Cloud-based raster processors out there

Hi all,

Just trying to get my head around some of the new big raster processors out there, in addition of course to Google Earth Engine. Bear with me while I sort through these. Thanks for raster sleuth Stefania Di Tomasso for helping. 

1. Geotrellis (https://geotrellis.io/)

Geotrellis is a Scala-based raster processing engine, and it is one of the first geospatial libraries on Spark.  Geotrellis is able to process big datasets. Users can interact with geospatial data and see results in real time in an interactive web application (for regional, statewide dataset).  For larger raster datasets (eg. US NED). GeoTrellis performs fast batch processing using Akka clustering to distribute data across the cluster.  GeoTrellis was designed to solve three core problems, with a focus on raster processing:

  • Creating scalable, high performance geoprocessing web services;
  • Creating distributed geoprocessing services that can act on large data sets; and
  • Parallelizing geoprocessing operations to take full advantage of multi-core architecture.

Features:

  • GeoTrellis is designed to help a developer create simple, standard REST services that return the results of geoprocessing models.
  • GeoTrellis will automatically parallelize and optimize your geoprocessing models where possible.
  • In the spirit of the object-functional style of Scala, it is easy to both create new operations and compose new operations with existing operations.

2. GeoPySpark - in synthesis GeoTrellis for Python community

Geopyspark provides python bindings for working with geospatial data on PySpark (PySpark is the Python API for Spark). Spark is open source processing engine originally developed at UC Berkeley in 2009.  GeoPySpark makes Geotrellis (https://geotrellis.io/) accessible to the python community.  Scala is a difficult language so they have created this Python library. 

3. RasterFoundry (https://www.rasterfoundry.com/)

They say: "We help you find, combine and analyze earth imagery at any scale, and share it on the web." And "Whether you’re working with data already accessible through our platform or uploading your own, we do the heavy lifting to make processing your imagery go quickly no matter the scale."

Key RasterFoundry workflow: 

  1. Browse public data
  2. Stitch together imagery
  3. Ingest your own data
  4. Build an analysis pipeline
  5. Edit and iterate quickly
  6. Integrate with their API

4. GeoNotebooks

From the Kitware blog: Kitware has partnered with The NASA Earth Exchange (NEX) to design GeoNotebook, a Jupyter Notebook extension created to solve these problems (i.e. big raster data stacks from imagery). Their shared vision: a flexible, reproducible analysis process that makes data easy to explore with statistical and analytics services, allowing users to focus more on the science by improving their ability to interactively assess data quality at scale at any stage of the processing.

Extending Jupyter Notebooks and Jupyter Hub, this python analysis environment provides the means to easily perform reproducible geospatial analysis tasks that can be saved at any state and easily shared. As the geospatial datasets come in, they are ingested into the system and converted into tiles for visualization, creating a dynamic map that can be managed from the web UI and can communicate back to a server to perform operations like data subsetting and visualization. 

Blog post: https://blog.kitware.com/geonotebook-data-driven-quality-assurance-for-geospatial-data/ 

Spatial Data Science Bootcamp 2016!

Last week we held another bootcamp on Spatial Data Science. We had three packed days learning about the concepts, tools and workflow associated with spatial databases, analysis and visualizations. Our goal was not to teach a specific suite of tools but rather to teach participants how to develop and refine repeatable and testable workflows for spatial data using common standard programming practices.

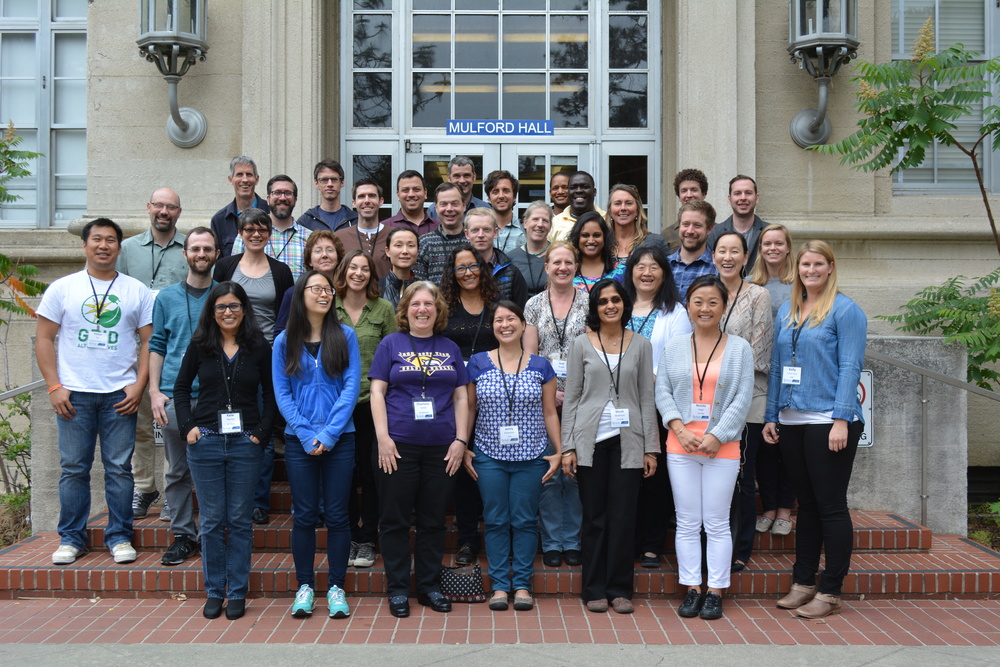
2016 Bootcamp participants

On Day 1 we focused on setting up a collaborative virtual data environment through virtual machines, spatial databases (PostgreSQL/PostGIS) with multi-user editing and versioning (GeoGig). We also talked about open data and open standards, and moderndata formats and tools (GeoJSON, GDAL).  On Day 2 we focused on open analytical tools for spatial data. We focused on Python (i.e. PySAL, NumPy, PyCharm, iPython Notebook), and R tools.  Day 3 was dedicated to the web stack, and visualization via ESRI Online, CartoDB, and Leaflet. Web mapping is great, and as OpenGeo.org says: “Internet maps appear magical: portals into infinitely large, infinitely deep pools of data. But they aren't magical, they are built of a few standard pieces of technology, and the pieces can be re-arranged and sourced from different places.…Anyone can build an internet map."

All-in-all it was a great time spent with a collection of very interesting mapping professionals from around the country. Thanks to everyone!

ESRI @ GIF Open GeoDev Hacker Lab

We had a great day today exploring ESRI open tools in the GIF. ESRI is interested in incorporating more open tools into the GIS workflow. According to www.esri.com/software/open, this means working with:

  1. Open Standards: OGC, etc.

  2. Open Data formats: supporting open data standards, geojson, etc.

  3. Open Systems: open APIs, etc.

We had a full class of 30 participants, and two great ESRI instructors (leaders? evangelists?) John Garvois and Allan Laframboise, and we worked through a range of great online mapping (data, design, analysis, and 3D) examples in the morning, and focused on using ESRI Leaflet API in the afternoon. Here are some of the key resources out there.

Great Stuff! Thanks Allan and John

Spatial Data Science Bootcamp March 2016

Register now for the March 2016 Spatial Data Science Bootcamp at UC Berkeley!

We live in a world where the importance and availability of spatial data are ever increasing. Today’s marketplace needs trained spatial data analysts who can:

  • compile disparate data from multiple sources;
  • use easily available and open technology for robust data analysis, sharing, and publication;
  • apply core spatial analysis methods;
  • and utilize visualization tools to communicate with project managers, the public, and other stakeholders.

To help meet this demand, International and Executive Programs (IEP) and the Geospatial Innovation Facility (GIF) are hosting a 3-day intensive Bootcamp on Spatial Data Science on March 23-25, 2016 at UC Berkeley.

With this Spatial Data Science Bootcamp for professionals, you will learn how to integrate modern Spatial Data Science techniques into your workflow through hands-on exercises that leverage today's latest open source and cloud/web-based technologies. We look forward to seeing you here!

To apply and for more information, please visit the Spatial Data Science Bootcamp website.

Limited space available. Application due on February 19th, 2016.

Spatial Data Science @ Berkeley May 2015

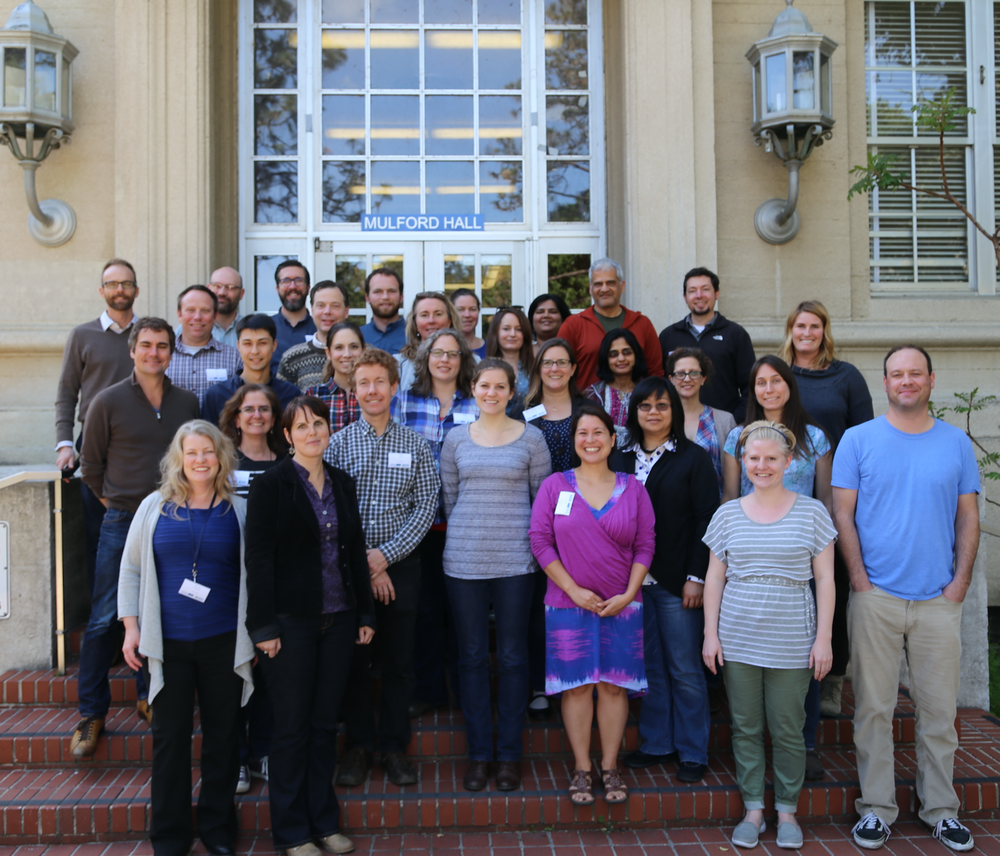
Bootcamp participants outside historic Mulford HallOur bootcamp on Spatial Data Science has concluded. We had three packed days learning about the concepts, tools and workflow associated with spatial databases, analysis and visualizations. 

Our goal was not to teach a specific suite of tools but rather to teach participants how to develop and refine repeatable and testable workflows for spatial data using common standard programming practices.

On Day 1 we focused on setting up a collaborative virtual data environment through virtual machines, spatial databases (PostgreSQL/PostGIS) with multi-user editing and versioning (GeoGig). We also talked about open data and open standards, and modern data formats and tools (GeoJSON, GDAL).

Analyzing spatial data is the best part! On Day 2 we focused on open analytical tools for spatial data. We focused on one particular class of spatial data analysis: pattern analysis, and used Python (i.e. PySAL, NumPy, PyCharm, iPython Notebook), and R Studio (i.e. raster, sp, maptools, rgdal, shiny) to look at spatial autocorrelation and spatial regression. 

Wait, visualizing spatial data is the best part! Day 3 was dedicated to the web stack, and visualization. We started with web mapping (web stack, HTML/CSS, JavaScript, Leaflet), and then focused on web-based visualizations (D3).  Web mapping is great, and as OpenGeo.org says: “Internet maps appear magical: portals into infinitely large, infinitely deep pools of data. But they aren't magical, they are built of a few standard pieces of technology, and the pieces can be re-arranged and sourced from different places.…Anyone can build an internet map."

All-in-all it was a great time spent with a collection of very interesting mapping professionals from around the country (and Haiti!). Thanks to everyone!

Mapsense talk at BIDS for your viewing pleasure

Here is Erez Cohen's excellent talk from the BIDS feed: http://bids.berkeley.edu/resources/videos/big-data-mapping-modern-tools-geographic-analysis-and-visualization

Title: Big Data Mapping: Modern Tools for Geographic Analysis and Visualization

Speaker: Erez Cohen, Co-Founder and CEO of Mapsense

We'll discuss how smart spatial indexes can be used for performant search and filtering for generating interactive and dynamic maps in the browser over massive datasets. We'll go over vector maps, quadtree indices, geographic simplification, density sampling, and real-time ingestion. We'll use example datasets featuring real-time maps of tweets, California condors, and crimes in San Francisco. 

The BIDS Data Science Lecture Series is co-hosted by BIDS and the Data, Science, and Inference Seminar. 

About the Speaker

Erez is co-founder and CEO at Mapsense, which is builds software for the analysis and visualization of massive spatial datasets. Previously Erez was an engineer at Palantir Technologies, where he worked with credit derivatives and mortgage portfolio datasets. Erez holds a BS/MS from UC Berkeley's Industrial Engineer and Operations Research Department. He was a PhD candidate in the same department at Columbia University.

print 'Hello World (from FOSS4G NA 2015)'

FOSS4G NA 2015 is going on this week in the Bay Area, and so far, it has been a great conference.

Monday had a great line-up of tutorials (including mine on PySAL and Rasterio), and yesterday was full of inspiring talks.  Highlights of my day: PostGIS Feature Frenzy, a new geoprocessing Python package called PyGeoprocessing, just released last Thurs(!) from our colleagues down at Stanford who work on the Natural Capital Project, and a very interesting talk about AppGeo's history and future of integrating open source geospatial solutions into their business applications. 

The talk by Michael Terner from AppGeo echoed my own ideas about tool development (one that is also shared by many others including ESRI) that open source, closed source and commercial ventures are not mutually exclusive and can often be leveraged in one project to maximize the benefits that each brings. No one tool will satisfy all needs.

In fact, at the end of my talk yesterday on Spatial Data Analysis in Python, someone had a great comment related to this: "Everytime I start a project, I always wonder if this is going to be the one where I stay in Python all the way through..."  He encouraged me to be honest about that reality and also about how Python is not always the easiest or best option.

Similarly, in his talk about the history and future of PostGIS features, Paul Ramsey from CartoDB also reflected on how PostGIS is really great for geoprocessing because it leverages the benefits of database functionality (SQL, spatial querying, indexing) but that it is not so strong at spatial data analysis that requires mathematical operations like interpolation, spatial auto-correleation, etc. He ended by saying that he is interested in expanding those capabilities but the reality is that there are so many other tools that already do that.  PostGIS may never be as good at mathematical functions as those other options, and why should we expect one tool to be great at everything?  I completely agree.

Questions about the Spatial Data Science Bootcamp? Read on!

In May, the GIF will be hosting a 3-day bootcamp on Spatial Data Science.

What is the significance of Spatial Data Science?

We live in a world where the importance and availability of spatial data is ever increasing, and the value of Spatial Data Science: big data tools, geospatial analytics, and visualization is on the rise. There are many new and distributed tools available to the geospatial professional, and the ability to efficiently evaluate and integrate the wide array of options is a critical skill for the 21st century marketplace.  Spatial Data Science offers a modern workflow that includes the integration of data from multiple sources and scales; with open-source and web-based technology for robust data analysis and publication; with core spatial concepts and application of spatial analysis methods; and allows for the collaborations of people – companies, scientists, policy-makers, and the public.

Why come to the GIF to learn about it?

The Geospatial Innovation Facility (GIF) at UC Berkeley is the premier research and educational facility in the Bay Area that focuses on a broad vision of Spatial Data Science. The GIF has a decade-long history of successful GIS and remote sensing research projects. The GIF has also trained many students, researchers, and community members in geospatial techniques and applications through our popular workshop series and private consultation. With more recent advances in web-based mapping capabilities, the GIF has been at the forefront of complex web-based spatial data informatics (web-based data sharing and visualization), such as the Cal-Adapt  tool, which provides a wealth of data and information about California’s changing climate. Participants will get the benefit of our decade-long focus on Spatial Data Science: collaborative project development, rigorous spatial analysis methods, successful interaction with clients, and delivery of results to project managers, the public, and other stakeholders.

What are the key elements of the Bootcamp?

This Bootcamp is designed to familiarize participants with some of the major advances in geospatial technology today: big data wrangling, open-source tools, and web-based mapping and visualization. You will learn how and when to implement a wide range of modern tools that are currently in use and under development by leading Bay Area mapping and geospatial companies, as well as explore a set of repeatable and testable workflows for spatial data using common standard programming practices. Finally, you will learn other technical options that you can call upon in your day-to-day workflows. This 3-day intensive training will jump start your geospatial analysis and give you the basic tools you need to start using open source and web-based tools for your own spatial data projects.  

Interested in integrating open source and web-based solutions into your GIS toolkit? Come join us at our May 2015 Bootcamp: Spatial Data Science for Professionals. Applications due: 3/16/2015. Sign up here!