Google Earth Engine @ the GIF!

Students, researchers, mappers, and big data enthusiasts took place in an exciting 2 day Google Earth Engine workshop this last week hosted by the GIF and the Google Earth Engine Team. We had an exiting overview of the latest and greatest research adventures from Google by Kelly lab alum Karin Tuxen-Bettman including advances in some of what Google Earth Outreach team is involved in...

As well as new/upcoming ventures

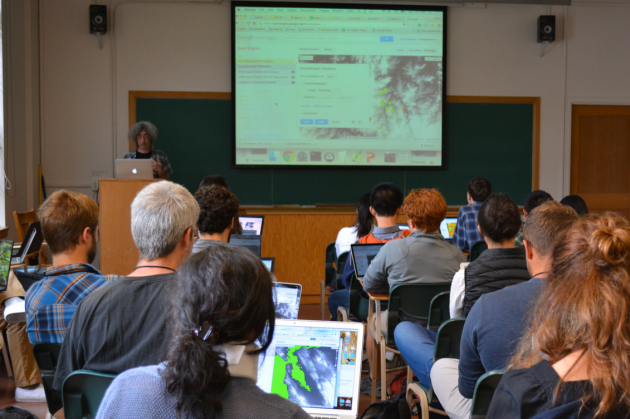
The Earth Engine team led some great tutorials getting people well versed in JavaScript and using the Earth Engine playground, and Earth Engine API. Having beginner and advanced workshop tracks during the two day event allowed for both broad and deep participation from researchers across the Berkeley campus. Take a look at the packed agenda and more

here!

We also had a stellar panel of UC Berkeley professor Jeff Chambers and graduate students Sophie Taddeo, Alexander Bryk, and Lisa Kelley who shared an intimate view of how they were using Earth Engine in their research. The panel shared stories of using Earth Engine to evaluate disturbance in tropical forests, map the movement of wetlands, and meandering rivers, as well as looking at agroforestry systems in Indonesia through a socio-ecological lens.

Thanks to Google and the Earth Engine Team for guiding, the GIF for hosting, and all of the participants for engaging in an action packed two days!

White House Launches new Climate Data Initiative...

We are in the lovely "Indian Treaty" room.And we were there! Kevin and I went to the White House (here is photographic proof) to represent Cal-Adapt.

The President’s Climate Data Initiative was launched March 19th with the tagline: Empowering America’s Communities to Prepare for the Effects of Climate Change. The initiative is a complex partnership of government, industry, academia and local public to get the US ready for climate change. The overall goal of the climate data initiative is "Spark Innovation": release data, articulate challenges, turn data scientists loose. Here is the fact sheet and a blog post from John Podesta and John Holdren.

We saw some very interesting short talks from a range of speakers. Here are some highlights:

Jack Dangermond highlighted the many initiatives that ESRI is pushing to help with climate resilience. Kathyrn Sullivan from NOAA discussed her concept of "Environmental Intelligence", which describes the use of data to create resilience. She says: "NOAA capture 20TB daily, they release 2TB daily. Upon that data stream are built all the climate businesses we have today. What would this industry be like if we release the other 18TB?" Ellen Stofan from NASA talked about new earth observation missions, including satellites for precipitation, soil moisture, CO2, winds, aerosols. She announced another of a series of data driven challenges called "coastal inundation in your community". Rachel Kyte from the World Bank called their multiple initiatives "Open Data for Resilience". She said that climate change may eradicate the mission of the World Bank, because of its disproportionate impact on poorer communities worldwide. Rebecca More from Google gave us a fantastic overview of the Landsat, climate and topography missions that Google Earth Engine is working on. Google is contributing 1PT cloud storage, and 50 million CPU hours of collaboration.

Videos:

All was very inspiring and informative.

Here are some press links about the Initiative:

The evolution of a Digital Earth

In 1998 Al Gore made his now famous speech entitled The Digital Earth: Understanding our planet in the 21st Century. He described the possibilities and need for the development of a new concept in earth science, communication and society. He envisioned technology that would allow us "to capture, store, process and display an unprecedented amount of information about our planet and a wide variety of environmental and cultural phenomena.” From the vantage point of our hyper-geo-emersed lifestyle today his description of this Digital Earth is prescient yet rather cumbersome: 

"Imagine, for example, a young child going to a Digital Earth exhibit at a local museum. After donning a head-mounted display, she sees Earth as it appears from space. Using a data glove, she zooms in, using higher and higher levels of resolution, to see continents, then regions, countries, cities, and finally individual houses, trees, and other natural and man-made objects. Having found an area of the planet she is interested in exploring, she takes the equivalent of a "magic carpet ride" through a 3-D visualization of the terrain.”

He said: "Although this scenario may seem like science fiction, most of the technologies and capabilities that would be required to build a Digital Earth are either here or under development. Of course, the capabilities of a Digital Earth will continue to evolve over time. What we will be able to do in 2005 will look primitive compared to the Digital Earth of the year 2020. In 1998, the necessary technologies were: Computational Science, Mass Storage, Satellite Imagery, Broadband networks, Interoperability, and Metadata. 

He anticipated change: "Of course, further technological progress is needed to realize the full potential of the Digital Earth, especially in areas such as automatic interpretation of imagery, the fusion of data from multiple sources, and intelligent agents that could find and link information on the Web about a particular spot on the planet. But enough of the pieces are in place right now to warrant proceeding with this exciting initiative.” 
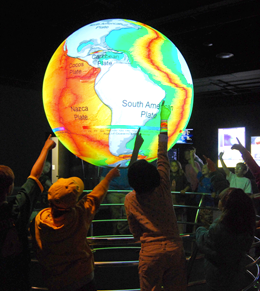
Example from NOAA's Science on a Sphere projectMuch has changed since he gave his talk, obviously. We have numerous examples of Virtual Globes for data exploration - for example, Google Earth, NASA’s WorldWind, ESRI’s ArcGIS Explorer, Bing Maps 3D, TerraExplorer, Marble.  (These virtual examples are made tangible with NOAA's terrific Science on a Sphere project.)

We also have realized a new vision of the Digital Earth that includes much more than immersive viewing of data. Today’s Digital Earth vision(s) include analytics and expertise for solving problems that are often cross-discplinary and large scale. Additionally, we make much more use today than was anticipated in 1998 from sensor networks and the geoweb (e.g. volunteered geographic information and croudsourcing). Examples of this multi-disciplinary Digital Earth concept include Google Earth Engine (and its recent forest loss product), Nasa Earth Exchange, and our own HOLOS.

NSF has adopted this concept for their Earth Cube concept. Last year NSF was looking for transformative concepts and approaches to create integrated data management infrastructures across the Geosciences. They were interested in the multifaceted challenges of modern, data-intensive science and education and envision an environment where low adoption thresholds and new capabilities act together to greatly increase the productivity and capability of researchers and educators working at the frontiers of Earth system science. I am not sure if this will be funded in 2014, but the concept reafirms that the concept of the Digital Earth is widespread and will likely be an important part of academia.
Workshop wrap up: Google Earth Higher Education Summit 2013

For three days in late July 2013 Kevin Koy, Executive Director of the GIF and Maggi spent time at Google with 50+ other academics and staff to learn about Google Earth's mapping and outreach tools that leverage cloud computing. The meeting was called Google Earth for Higher Education Summit, and it was jam packed with great information and hands-on workshops. Former Kellylabber Karin Tuxen-Bettman was at the helm, with other very helpful staff (including David Thau - who gave the keynote at last year's ASPRS conference). Google Earth Outreach has been targeting non-profits and K-12 education, and are now increasingly working with higher education, hence the summit. We learned about a number of valuable tools for use in classrooms and workshops, a short summary is here.  

Google Mapping Tools - the familiar and the new

  • Google Earth Pro. You all know about this tool, increasing ability to plan, measure and visualize a site, and to make movies and maps and export data.
  • Google Maps Engine Lite. This is a free, lite mapping platform to import, style and embed data. Designed to work with small (100 row) spreadsheets.
  • Google Maps Engine Platform. The scaleable and secure mapping platform for geographic data hosting, data sharing and map making. streamlines the import of GIS data: you can import shapefiles and imagery. http://mapsengine.google.com.
  • Google Earth Engine. Data (40 years of global satellite imagery - Landsat, MODIS, etc.) + methods to analyze (Google's and yours, using python and javascript) + the Cloud make for a fast analytical platform to study a changing earth. http://earthengine.google.org/#intro
  • TimeLapse. A new tool showcasing 29 years of Landsat imagery, allows you to script a tour through a part of the earth to highlight change. Features Landsat 4, 5 7 at 30m, with clouds removed, colors normalized with MODIS. http://earthengine.google.org/
  • Field Mobile Data Collection. GME goes mobile, using Open Data Kit (ODK) - a way to capture structured data and locate it and analyze after home.
  • Google Maps APIs. The way to have more hands-on in map styling and publishing. developers.google.com/maps
  • Street View. They have a car in 32 countries, on 7 continents, and are moving into national parks and protected areas. SV is not just for roads anymore. They use trikes, boats, snowmobiles, trolleys; they go underwater and caves, backpacks.

Here are a couple of my first-cuts:

Google Timelapse

Google recently released the Timelapse project, hosted by Time Magazine, which shows Landsat images from 1984 to today in a timelapse video animation for the entire globe. The viewer allows users to navigate to any spot on the globe via place name and visualize changes on the earth’s surface over the time period captured by Landsat. Google highlights specific areas of interest such as Dubai, Las Vegas, and the Amazon.

Click the image below for more info and to access the site:

Screenshot of Google Timelapse on Time.com

A great week for radio

What a great week for radio and matters geospatial+web. On Wednesday last week we finished out our GIS class with a talk about the geoweb and issues of access, bias, motivation, control, and of course privacy. I used alot of William Gibson's previous writings about Google (posted here earlier) in that lecture. Yesterday TTBOOK re-aired a great interview with Gibson, on the topic of writing, but also about the internet. I recommend it. Additionally, last week Talk of the Nation had a interesting interview with Jerry Brotton about his new book "A History of the World in Twelve Maps"; the interview touched on Google Earth and representation, why north is up, and many other fantastic questions raised through the history of cartography. Check them out!

ASPRS 2012 Wrap-up

ASPRS 2012, held in Sacramento California, had about 1,100 participants. I am back to being bullish about our organization, as I now recognize that ASPRS is the only place in geospatial sciences where members of government, industry, and academia can meet, discuss, and network in a meaningful way. I saw a number of great talks, met with some energetic and informative industry reps, and got to catch up with old friends. Some highlights: Wednesday's Keynote speaker was David Thau from Google Earth Engine whose talk "Terapixels for Everyone" was designed to showcase the ways in which the public's awareness of imagery, and their ability to interact with geospatial data, are increasing. He calls this phenomena (and GEE plays a big role here): "geo-literacy for all", and discussed new technologies for data/imagery acquisition, processing, and dissemination to a broad public(s) that can include policy makers, land managers, and scientists. USGS's Ken Hudnut was Thursday's Keynote, and he had a sobering message about California earthquakes, and the need (and use) of geospatial intelligence in disaster preparedness.

Berkeley was well represented: Kevin and Brian from the GIF gave a great workshop on open source web, Kevin presented new developments in cal-adapt, Lisa and Iryna presented chapters from their respective dissertations, both relating to wetlands, and our SNAMP lidar session with Sam, Marek, and Feng (with Wenkai and Jacob from UCMerced) was just great!

So, what is in the future for remote sensing/geospatial analysis as told at ASPRS 2012? Here are some highlights:

  • Cloud computing, massive datasets, data/imagery fusion are everywhere, but principles in basic photogrammetry should still comes into play;
  • We saw neat examples of scientific visualization, including smooth rendering across scales, fast transformations, and immersive web;
  • Evolving, scaleable algorithms for regional or global classification and/or change detection; for real-time results rendering with interactive (on-the-fly) algorithm parameter adjustment; and often involving open source, machine learning;
  • Geospatial data and analysis are heavily, but inconsistently, deployed throughout the US for disaster response;
  • Landsat 8 goes up in January (party anyone?) and USGS/NASA are looking for other novel parterships to extend the Landsat lifespan beyond that;
  • Lidar is still big: with new deployable and cheaper sensors like FLASH lidar on the one hand, and increasing point density on the other;
  • Obia, obia, obia! We organized a nice series of obia talks, and saw some great presentations on accuracy, lidar+optical fusion, object movements; but thorny issues about segmentation accuracy and object ontology remain; 
  • Public interaction with imagery and data are critical. The Public can be a broader scientific community, or a an informed and engaged community who can presumably use these types of data to support public policy engagement, disaster preparedness and response.

mapping gas leaks in Boston

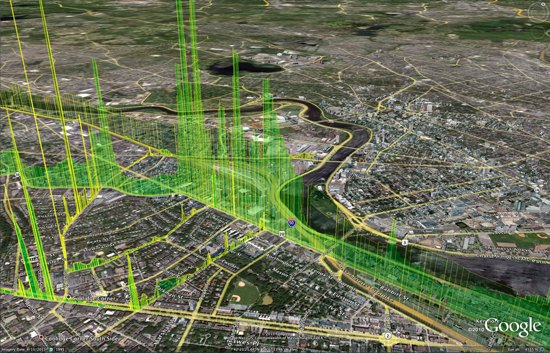
The Google Earth image above shows shafts of bright green indicating natural gas leaking around BU's Charles River Campus. If there are multiple leaks, the display “looks like a stock market index during a busy day,” says Nathan Phillips. Photo courtesy of Nathan Phillips and Picarro, Inc.This is a very interesting report about work at BU Geography and Environment department to map gas leaks across the city. Nathan Phillips, Bob Ackley and Eric Crosson use a Nissan-mounted methane sensor to survey for leaks, and map results on a google earth scene. The accompanying video shows the setup, and discusses some nasty real time implications for trees as gas replaces oxygen in the soil. Also, this is just nuts to think of how much wasted gas is going up in a typical city. Yikes!

GIS and historical analysis: a good mix

In the new NYT artilce "Digital Maps Are Giving Scholars the Historical Lay of the Land," Patricia Cohen discusses the new academic field known as spatial humanities. Historians, literary theorists, archaeologists and others are using Geographic Information Systems to re-examine real and fictional places like the villages around Salem, Mass., at the time of the witch trials; the Dust Bowl region devastated during the Great Depression; and the Eastcheap taverns where Shakespeare’s Falstaff and Prince Hal caroused.

Mapping spatial information reveals part of human history that otherwise we couldn’t possibly know,” said Anne Kelly Knowles, a geographer at Middlebury College in Vermont. “It enables you to see patterns and information that are literally invisible.”

Fun stuff!

Google Earth Engine Debuted at the International Climate Change Conference in Cancun, Mexico

Google.org introduced a new Google Labs product called Google Earth Engine at the International Climate Change Conference in Cancun, Mexico. Google Earth Engine is a new technology platform that puts petabytes of satellite imagery and data from the past 25 years online, many of which have never been seen, much less analyzed. The platform will enable scientists around the world to use Google’s cloud computing infrastructure to implement their applications. For example, creating a detailed forest cover and water map of Mexico, a task that would have taken 3 years on one computer, was accomplished in less than a day.

Google Earth Engine can help scientists track and analyze changes in Earth’s environment  and can be used for a wide range of applications—from mapping and monitoring water resources to ecosystem services to deforestation. The idea is to enable global-scale monitoring and measurement of changes in the earth’s environment by providing scientists a vast new amount of data and powerful computing resources.

Read more at Introducing Google Earth Engine or watch Google Earth Engine Overview videos.