Interesting sources of data for science: commerce and construction for ecological trend analysis
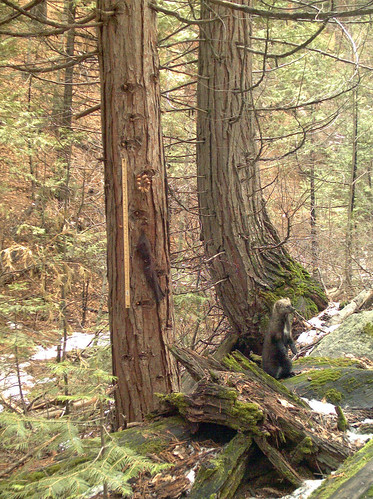
/In the early 1800s, Canadian fur traders began to notice dramatic fluctuations in snowshoe hare (Lepus americanus) and Canadian lynx populations (Lynx canadensis). Almost 100 years later, ecological researchers were able to use pelt sale data generated by the Hudson’s Bay Company to document an interrelated rise and fall in hare and lynx populations. Today, we understand even more about this classic and frequently cited example of predator–prey cycles, and have identified large-scale factors, including climate, as playing an important role in regulating these populations and their interactions. But it was the novel use of commercial records that got scientists started on their work. This piece excerpted from our article on webGIS.
Now, in the same spirit, comes this article in PERS recently, and it prompted me to start collecting studies on interesting and non-traditional sources of data for hinting at or validating ecological trends. Download Full Article (members only)
The article: Wal-Mart from Space: A New Source for Land Cover Change Validation by Potere et al. The authors use the location and opening dates for 3,043 Wal-Mart stores as a means for validating land-cover change-related products at medium (28.5 m) to coarse (250 m to 1 km) resolutions throughout the conterminous United States. Since Wal-Marts are large, nearly everywhere, and have been built throughout the remote sensing record (1962 to 2004), they prove to be good data set for examining land cover change. A very interesting and creative approach.
Add to this list: espionage. Last week, thanks to the U.S. intelligence community, researchers saw pictures that will allow them to model the breakup of sea ice at a level of detail they never imagined. Science article.


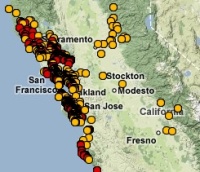
 If you love detailed spatial data and/or the bay area, I HIGHLY recommend downloading and exploring the readily available