Definiens community site launched

At our Definiens workshop today, Juan mentioned that the Definiens community website has been launched in the last month. Definiens is one of the few comprehensive segmentation and classification software solutions targeted for high spatial resolution imagery processing.  I've used the software for mapping tidal wetland sites, and for mapping dead crowns in oak forests.  The community site includes lots of information on shared codes, videos, demos, and discussion.  Since the software is so comprehensive, and has so many possible options, it can be difficult to become an expert. I personally like to know the "choice domain" within which I am working, so learning Definiens places me somewhere on the edge of my comfort zone. But with this, especially the rule set sharing, I think I can get stuck in. Thanks Juan!

The GIF is one of 7 Centers of Excellence for Definiens; other sites include:

Get those roofs fixed: El Nino is coming!

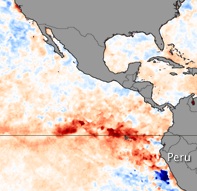
From NASA Image of the Day: In July 2009, the National Oceanic and Atmospheric Administration (NOAA) Climate Prediction Center reported that ocean temperatures in the central and eastern Pacific had shifted into El Niño—anomalously warm—conditions. El Niño conditions are evident in this sea surface temperature anomaly image based on data from the Advanced Microwave Scanning Radiometer for EOS (AMSR-E) on NASA’s Aqua satellite on July 26. THe current data are compared to long-term average temperatures (1985-1997) measured by the Advanced Very High Resolution Radiometers that have flown on several NOAA missions.

In this map, places where temperatures were near normal are cream-colored, places where temperatures were warmer than normal are red, and places where temperatures were cooler than normal are blue. An area of dark red occupies the eastern Pacific off the coast of Peru and Ecaudor (north of Peru), indicating temperatures were much warmer than average. Meanwhile, across the Pacific, ocean temperatures around Indonesia were slightly cooler (light blue) than usual.

Interesting sources of data for science: commerce and construction for ecological trend analysis

In the early 1800s, Canadian fur traders began to notice dramatic fluctuations in snowshoe hare (Lepus americanus) and Canadian lynx populations (Lynx canadensis). Almost 100 years later, ecological researchers were able to use pelt sale data generated by the Hudson’s Bay Company to document an interrelated rise and fall in hare and lynx populations. Today, we understand even more about this classic and frequently cited example of predator–prey cycles, and have identified large-scale factors, including climate, as playing an important role in regulating these populations and their interactions. But it was the novel use of commercial records that got scientists started on their work. This piece excerpted from our article on webGIS.

Now, in the same spirit, comes this article in PERS recently, and it prompted me to start collecting studies on interesting and non-traditional sources of data for hinting at or validating ecological trends. Download Full Article (members only)

The article: Wal-Mart from Space: A New Source for Land Cover Change Validation by Potere et al. The authors use the location and opening dates for 3,043 Wal-Mart stores as a means for validating land-cover change-related products at medium (28.5 m) to coarse (250 m to 1 km) resolutions throughout the conterminous United States. Since Wal-Marts are large, nearly everywhere, and have been built throughout the remote sensing record (1962 to 2004), they prove to be good data set for examining land cover change. A very interesting and creative approach.

Mapping virtual trees and buildings

From a series of news releases (all text, no pics, alas): UK aerial survey specialist Bluesky has launched a brand new digital map layer accurately modelling the location and extent of trees and their proximity to buildings. Designed as a tool to aid insurance assessors, property developers and Local Authority Planners, ProximiTREE details the exact spatial location and height of individual trees together with the circumference of its canopy. From this information a determination can be made of the root extent and the potential impact on either existing or proposed properties.

They plug this product for its use in avoiding building subsidence, but in fire-prone Cali, we could use it to look at defensible space and risk.

They also provide a range of good downloads, including sample data and software for your enjoyment.

New Remote Sensing Journal

I just received an announcement about a new journal for RS folks, succinctly named Remote Sensing. It is a new open access journal of the remote sensing process, from instrument design and signal processing to the retrieval of geophysical parameters and their application in geosciences. Remote Sensing is published under the leadership of Prof. Dr. Wolfgang Wagner from the Institute of Photogrammetry and Remote Sensing (I.P.F.), Vienna University of Technology (TU Wien), Vienna, Austria. Check it out.

Lidar web resources

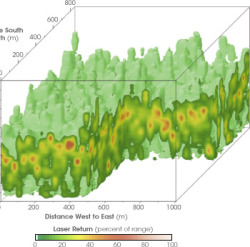
As a lead-up to this week's SNAMP Spatial Team Workshops on our LiDAR data, I am collecting the great web resources for LiDAR here.

NASA celebrates 50 years of earth observation

NASA has a nice site, and some resources, highlighting 50 years in earth observation. Over the past 50 years, thousands of satellites have been sent into space on missions to collect data about the Earth. Today, the ability to forecast weather, climate, and natural hazards depends critically on these satellite-based observations.

At the request of the National Aeronautics and Space Administration, the National Academies published the report Earth Observations from Space: The First 50 Years of Scientific Achievements (2008) to describe how the ability to view the entire globe at once, uniquely available from satellite observations, has revolutionized Earth studies and ushered in a new era of multidisciplinary Earth sciences.


Check it: mapping streambed from a kayak

You've got to watch this video. I love these dudes. Originally from the Map Room.

The project uses an innovative underwater video system that takes Global Positioning System (GPS) digital data and stores it continuously on the audio track of the DVD as the kayak floats down river.
Simultaneously, the river’s surface features are recorded using a similar geo-referenced video camera. Images from both video cameras are downloaded into a Geographic Information System (GIS) to produce digital maps that depict the stream in minute detail, above and below the surface.

NASA Orbiting Carbon Observatory Goes for a Swim

The NASA Orbiting Carbon Observatory was intended to monitor carbon dioxide in order to help assess global warming.

Now it's hanging out with Landsat 6.

The rocket that the satellite was traveling on failed to separate from its payload fairing. The extra weight prevented the rocket from reaching orbit and the satellite plunged into the Ocean near Antartica. That's a $278 million swim.

Really though, it's all about Google Ocean now, so OCO probably just wanted a piece of the spotlight.

Rad! Mapping Manhattan Project

Manhattan in 1609 Eric Sanderson is visiting CNR next week: Chris G pointed me to his work. Imagining Manhattan before European contact through visualization. Gorgeous work, and appealing on many levels for geographers everywhere.  Project site, and highlights from the New Yorker.  The image here shows an aerial view of Manhattan as it might have looked in 1609, juxtaposed with the outline of Manhattan today.