Mapping and interactive projections with D3

D3 is a javascript library that brings data to life through an unending array of vizualizations.  Whether you've realized it or not, D3 has been driving many of the most compeling data visualizations that you have likely seen throughout the last year including a popular series of election tracking tools in the New York Times.

You can find a series of examples in D3's gallery that will keep you busy for hours!

In addition to the fantastic charting tools, D3 also enables a growing list of mapping capabilities.  It is really exciting to see where all this is heading.  D3's developers have been spending a lot of time most recently working on projections transformations.  Check out these amazing interactive projection examples:

Projection Transitions

Comparing Map Projections

Adaptive Composite Map Projections (be sure to use chrome for the text to display correctly)

Can't wait to see what the future has in store for bringng custom map projections to life in more web map applications!

 

New Landsat Satellite set to launch Feb 11th

NASA's Landsat Data Continuity Mission (LDCM) is scheduled to launch Feb. 11 from Vandenberg Air Force Base in California. A joint NASA and U.S. Geological Survey (USGS) mission, LDCM will add to the longest continuous data record of Earth's surface as viewed from space.

LDCM is the eighth satellite in the Landsat series, which began in 1972. The mission will extend more than 40 years of global land observations that are critical in many areas, such as energy and water management, forest monitoring, human and environmental health, urban planning, disaster recovery and agriculture. NASA and the USGS jointly manage the Landsat Program. Check out more info.

Lisa Schile is off to Abu Dhabi

Dr. Lisa Schile is off to Abu Dhabi for a postdoctoral research position with the Smithsonian Institution. She'll be working on a project monitoring carbon sequestration in wetlands. We checked out some of the available Abu Dhabi imagery on-line. The country has a long and interesting coastline, with many mangroves and wetlands, and of course the ever increasing coastal development. Here is a snapshot from NASA of coastal development. Lisa has started a blog, and taking lots of pics for us to see.

VTM wrap-up: check out some neat photos and videos...

The VTM collection is a great resource from the 1920s and 1930s that we are woking with as part of our Keck project. David Ackerly, Patrick McIntyre, Jim Thorne and I are working with four different parts of the collection:

  • 17,860 plots with digitized vegetation and locality data (UC Berkeley, Geospatial Innovation Facility);
  • ~195,000 square kilometers of digitized and georeferenced vegetation maps, covering 45% of the total area of California (UC Davis Information Center for the Environment);
  • 20,791 herbarium specimens with locality and collection information (UC Berkeley & Jepson Herbaria); and
  • ~ 3,100 digitized photographs (UC Berkeley Marion Koshland Bioscience and Natural Resources Library).

Pretty cool stuff! Some related cool VTM-related work out there:

First, Jim Thorne's fabulous movie about using VTM data to look at change in vegetation: http://vimeo.com/41524838.

Also, a nice photo re-shoot project from Elsmere Canyon that Patrick McIntyre pointed out...

And one of his own before and after photos.

The original VTM version...

Patrick's retake, 2012

Launch of Sonoma County Veg Mapping Program

The Sonoma County Agricultural Preservation and Open Space District has begun a 3-5 year program to map Sonoma County’s diverse plant communities.

An accurate, up-to-date map of vegetation and habitat type is key to ensuring good planning and management for watershed protection, flood control, fire and fuels management, and wildlife habitat conservation. A vegetation map is also critical to assessing climate benefits provided by the landscape, such as the amount of carbon being absorbed from the atmosphere or the degree to which the landscape is buffering extreme weather events.

These folks are using 3-6-inch CIR imagery and obia to map vegetation across Sonoma County. GIF is serving up the imagery! Check it out!

Report from the Lidar and NCALM workshop

December 2 2012 the GIF and UC Merced scientists hosted a workshop on lidar for CZO support. This is an annual workshop organized by Dr. Qinghua Guo.

Qinghua presented an overview of his lidar work, which is pretty extensive, and Juan Carlos Fernandez Diaz from NCALM presented an overview of the NCALM program. He talked about the NCALM workflow and their instruments, including their new bathymetric lidar instrument (that can get bathy and terrestrial simultanously for coastal studies), their waveform lidar instrument, and their new balloon-based lidar instrument (cool!) They can run a suite of instruments at the same time: waveform and camera, etc. One of the great things he brought up is the support for graduate students:

The National Center for Airborne Laser Mapping surveys up to ten projects (each generally covering no more than 40 square kilometers) each year for graduate student PIs who need Airborne Laser Swath Mapping data. Beginning in 2012, graduate student PIs can specify either near infrared (Optech Gemini, 1064 nm) or green (Optech Aquarius, 532 nm) bathymetric ALSM data (only one wavelength can be selected), as well as optionally request high resolution aerial photography in conjunction with the ALSM collection. Graduate student proposals must define a basic research question in the geosciences (broadly defined). Check it out!

The 21st century map: it involves citizens and the web

Check out this neat article about how research will likely increasingly use the web, mobile apps and the citizens who love them, in gathering data and in sharing information.

Rawiya Kameir says, in the article entitled "Researchers must harness powers of web and citizen science, experts say": As the web and web-based apps become more and more sophisticated, the role played by citizen science is growing in scope and size. And as the scientific process evolves, citizen involvement - especially in scientific endeavors that require large data sets - will become a cornerstone of research.

As the web and web-based apps become more and more sophisticated, the role played by citizen science is growing in scope and size. And as the scientific process slowly evolves, citizen involvement - especially in scientific endeavours that require large data sets - will become a cornerstone of research

Read more: http://www.itproportal.com/2012/11/10/researchers-must-harness-powers-of-web-and-citizen-science-experts-say/#ixzz2DRtd9Mvy
Researchers must harness powers of web and citizen science, experts say

Read more: http://www.itproportal.com/2012/11/10/researchers-must-harness-powers-of-web-and-citizen-science-experts-say/#ixzz2DRtQgyqP

http://www.itproportal.com/2012/11/10/researchers-must-harness-powers-of-web-and-citizen-science-experts-say/#ixzz2ChoOfadS

A great week for radio

What a great week for radio and matters geospatial+web. On Wednesday last week we finished out our GIS class with a talk about the geoweb and issues of access, bias, motivation, control, and of course privacy. I used alot of William Gibson's previous writings about Google (posted here earlier) in that lecture. Yesterday TTBOOK re-aired a great interview with Gibson, on the topic of writing, but also about the internet. I recommend it. Additionally, last week Talk of the Nation had a interesting interview with Jerry Brotton about his new book "A History of the World in Twelve Maps"; the interview touched on Google Earth and representation, why north is up, and many other fantastic questions raised through the history of cartography. Check them out!

Happy Thanksgiving everyone!

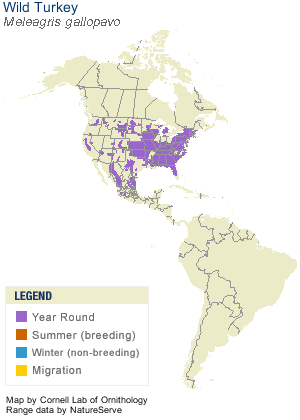
Range map of our friend Meleagris gallopovaThe ancestor all present-day gobblers—Meleagris gallopova - ranged from southeastern Canada to Mexico. 

Our present-day wild turkey has a loud call, with descending gobbles, and a variety of clucking notes. He struts through open woodlands, oaks, edges, and the occasional suburb.

The Wild Turkey’s popularity at the table led to a drastic decline in numbers, but they have recovered and now occur in every state except Alaska.

I think Ben Franklin said it best, in comparing the turkey to the eagle:

For in Truth the Turk'y is in comparison a much more respectable bird, and withal a true original native of America.... He is, (though a little vain and silly, it is true, but not the worse emblem for that,) a Bird of Courage, and would not hesitate to attack a grenadier of the British Guards, who should presume to invade his Farm Yard with a red Coat on.

Happy Thanksgiving Everyone!

Information from A Short History of the Turkey by the Collonial Williamsburg Newsletter, and BirdFellow.com.

Introduction to the Web-enabled Landsat Data (WELD) products using open source software

Introduction to the Web-enabled Landsat Data (WELD) products using open source software

At American Geophysical Union Fall 2012 Meeting, San Francisco December 6, 2012
______________________________

The NASA funded Web-enabled Landsat Data (WELD) project is providing near-continental scale 30m Landsat time series products (http://weld.cr.usgs.gov).

This 4.5 hour training workshop will provide student and expert users with tips and techniques to handle the WELD products.

Participants will bring their own laptops and a Linux-like Virtual Machine will be installed with remote sensing and GIS open source software, sample WELD products, scripts, and example exercises that illustrate a variety of WELD environmental monitoring and assessment applications. Participants will be assisted through the example exercises and all training material will be available for their later consultation. New WELD product versions will be available and participant feedback and suggestions to evolve the WELD processing
algorithms, product contents and format will be sought.
More information at http://globalmonitoring.sdstate.edu/projects/weld/weldtraining.html

Cost: Free (No AGU Registration Fee Needed)
Date: December 6, 2012
Time: 6:00pm - 10:30pm
Location: San Francisco Marriott
Room: Sierra A

Interested in the Intergovernmental Panel on Climate Change? New Workshop at Berkeley

Interested in the Intergovernmental Panel on Climate Change?  Come hear Berkeley-based authors of the IPCC's upcoming Fifth Assessment Report discuss their contributions and take your questions!

Date/Time: Wed, Nov 28th 3:30-4:30pm (followed by coffee and cookies until 5pm)
Location: LeConte Bldg, Lecture Room 3.

Panelists Include:

  • Max Auffhammer, Department of Agricultural and Resource Economics
  • Daithi Stone, Lawrence Berkeley National Laboratory
  • Michael Wehner, Lawrence Berkeley National Laboratory
  • Bill Collins, Lawrence Berkeley National Laboratory
  • Jim McMahon, Lawrence Berkeley National Laboratory Kirk Smith, School of Public Health

Please see the attached flyer for more details!


On the eve on GIS Day, the word of 2012: GIF!

Today the Huffington Post announced that the Word of the Year in 2012, according to the Oxford American Dictionaries, is GIF. Alas, they aren't talking about our GIF, fantastic resource for all things geospatial on the Berkeley campus, provider of innovative web mapping projects, source of useful training, meeting place for like-minded spatial aware professionals, and host of tomorrow's GIS Day, but about the humble Graphics Interchange Format, "relic of the 80s" and slave to internet kitties everywhere, which turned 25 this year. Still, this semantic confusion is likely to drive up our search results! Go GIF!

Urgent Request - GISCorps is looking for remote sensing specialists for Mega Storm Sandy

GISCorps is looking for remote sensing specialists for Mega Storm Sandy

The project is in collaboration with the International Charter "Space and Major Disasters" (http://www.disasterscharter.org/). The assistance of Remote Sensing Specialists is needed for analyzing imagery in various regions affected by the recent mega storm in the east coast of the United States.

The desired volunteer(s) must have considerable expertise in working with TerraSAR-X (Synthetic Aperture Radar data in the X-band) imagery and conducting analysis related to TerraSAR-X. Some of the desired analysis includes measuring the extent of the flood (pooling of water), depth of water, and conducting change detection from TerraSAR-X taken at various stages of the storm and producing shape files from areas of change. The image datasets will be provided to volunteer(s) by the Charter and from their FTP site.
 
Duration: This project is urgent and work can start immediately; the approximate duration is 1-2 weeks and 3-5 hours a day.
 
Type of mission: this mission does NOT require traveling and is conducted remotely. The volunteer will be using their own hardware and software and will be working closely with Charter's contact person throughout the project via emails, phone, VoIP, IRC and FTP sites.

If interested in applying, please send an email to recruit@giscorps.org along with your latest resume by midnight of November 7th, 2012 (or as soon as possible).  Please reply ONLY if you have TerraSAR-X imagery experience.


Thank you in advance,

GISCorps Recruitment Team

GIS Day 2012! November 14th, Mulford Hall

Please join us for GIS Day 2012, November 14, 5:00 pm to 8:15 pm.
UC Berkeley, Mulford Hall
http://gif.berkeley.edu/gisday.html

A list of speakers and topics are available on the event site.

GIS Day is free, but we encourage you to register, so that we know how many people to expect.  We still have room for posters, if you’d like to display a poster (project, map, imagery) just sign up online.

This year's event is co-hosted by the Bay Area Automated Mapping Association (BAAMA) and Geospatial Innovation Facility (GIF), with support from the Northern California Region of the American Society for Photogrammetry and Remote Sensing (ASPRS).

New ANR Statewide Program on GIS announced

We are pleased to announce the development of a new statewide program called the ANR Informatics and Geographic Information Systems Statewide Program (IGIS). IGIS will organize, digitize and make Web-accessible some of California’s longest continuous data pertaining to agriculture and natural ecosystems, including weather and productivity related to management inputs — concrete data for modeling responses to change across the state.

IGIS will be supported and directed by a leadership team including Maggi Kelly (director), Lisa Fischer, Karl Krist and Joni Rippee, with key staff Shane Feirer, Kris Lynn-Patterson and Todd Perez. The responsibilities of the leadership team are to maintain IGIS direction, explore collaborations and maintain connection between ANR and UC campuses.  The team will work with an advisory board that will assist the leadership team on all components of IGIS from data standardization and acquisition to data access and specific project selection and feedback from potential users.

Our vision is that over the next five years IGIS will provide a home for ANR’s rich and diverse collection of data, information and resources for academics and members of the public who rely on geospatial and informatics data, analysis and display.

In service of the ANR continuum, University of California researchers, academics from other institutions and the public, IGIS will provide the ability to connect with rich and diverse ANR resources, datasets and information through an online web accessible portal. IGIS will assist in applied research and extension activities that rely on geospatial data, analysis and display. IGIS will offer networking and collaboration and, when possible, provide training and research support on important agricultural and natural resource issues.

Specifically, IGIS will become the umbrella for ANR-wide GIS and informatics activities in order to

Provide coordination for research and extension activities that require GIS and/or geospatial analysis
Provide acquisition, storage and dissemination of large data sets from ANR Research and Extension Centers for researchers, managers and the public via Web-access (REC RAC, REC Web, Cal-EON)
Create a virtual GIS and Informatics service center to provide for project level work that has Division-wide application (GIS Service Center)
For more information, please see our developing website http://ucanr.edu/sites/IGIS.

Barbara Allen-Diaz
Vice President, Agriculture and Natural Resources

Aerial photography highlighted on new US Forever Stamps

Check out some of the gorgeous imagery that will be featured on a new series of US stamps. NASA imagery is highlighted, and the South Bay Salt ponds are featured on one stamp (see below). From the US Postal Service:

"Depicting America’s diverse landscapes on photos taken from ultra lights to satellites, the Earthscapes stamps provide a view of the nation’s diverse landscapes in a whole new way — from heights ranging from several hundred feet above the earth to several hundred miles in space.

south bay salt pondsThe stamps provide an opportunity to see the world in a new way by presenting examples of three categories of earthscapes: natural, agricultural, and urban. The photographs were all taken high above the planet’s surface, either snapped by satellites orbiting the Earth or carefully composed by photographers in aircraft. Howard E. Paine of Delaplane, VA, was the art director."


Hey Sandi Toksvig! Denmark is releasing data...

From the LASTools list. Recently, the Danish government released this announcement of free access to public sector data. Among other things, it means that Danish mapping and elevation data will become free (apparenty "free" as in speech as well as in beer).

Apparently, the intention is that the data should be accessible from the beginning of next year. Ole Sohn, Danish Minister for Business and Growth said:

“When the data has been released it can be used to develop completely new types of digital products, solutions, and services, which will benefit our companies as well as society at large. It is a vital part of Denmark's digital raw material that we are now releasing, which will create growth and jobs in Denmark”.

ESRI MODIS Toolbox

Cool MODIS NDVI tool pointed out to us from Jenny P.

This toolbox contains scripts that download NASA satellite imagery from MODIS and import it into ArcMap. The four data products currently supported are: evapotranspiration, land surface temperature, normalized difference vegetation index (NDVI), and enhanced vegetation index (EVI).

These products are available for the entire surface of the Earth at 1 km resolution and for any month going back to January 2000, when MODIS first launched aboard the satellite Terra.

http://resources.arcgis.com/gallery/file/geoprocessing/details?entryID=9CC382D2-1422-2418-34F8-DC9F97B24052

Food: An Atlas by Guerrilla Cartographers is ready for your support!

An atlas of food: a cooperatively-created, crowd-sourced and crowd-funded project of guerrilla cartography and publishing. Check it out! Food: An Atlas is ready to roll. Check out the promo at kickstarter and consider supporting the project.

5 months
+ 80 collaborating cartographers and researchers
+ 8 volunteer editors
+ An abundance of volunteer campaign wranglers, academics, designers, and artists
+ You
= Food: An Atlas