Welcome to Fall 2013!

Fall semester is here! Summer was a great adventure, with a terrific Intro to GIS workshop at the Forest Camp (see Sam's photo below), and a just fantastic workshop down at Google where we learned about some really cool new Google tools with former Kellylabber Karin Tuxen and the rest of the Google crew.

Teaching GIS at the terrific Zivnuska HallThis summer we said goodbye to a few Kellylabbers - Sarah Lewis graduated (update here), and Jessica O'Connell is moving back to the southeast for research. New lab members include undergraduate student Tiffany Yu and graduate student Lauren Haumann, who are working on the OurSpace project. New postdocs and visitors include Alice Kelly, ESPM PhD (from S&E division), who will be working on her NSF postdoc project "Sustainability and Safety in the Pacific West's National Parks," and Paulina Wong, who comes from Hong Kong on a Fulbright Scholarship and whose background is in the use of three-dimensional (3D) spatial analytical tools to simulate visualize urban environments, she'll be working on the OurSpace project.

Also, check out the individual project pages at the right for news about what we are working on: SNAMP, VTM, Keck, Wetlands, OakMapper, OurSpace, and Oak encroachment, among other things.  Welcome back to Berkeley!
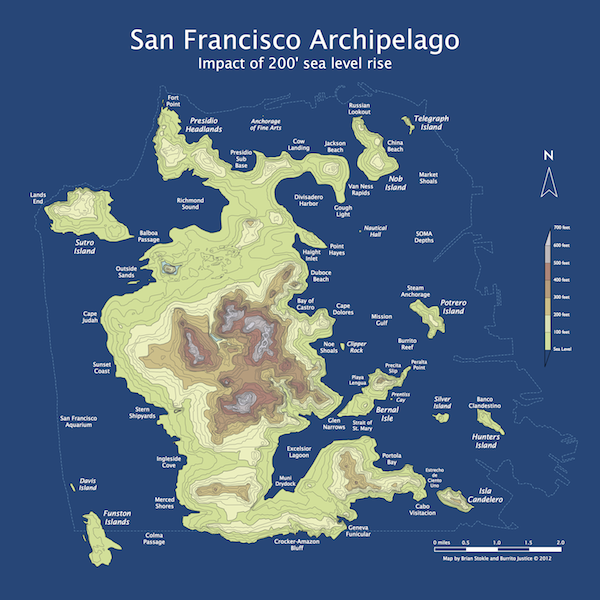
San Francisco circa 2072

SF archipelago, c. 2072

Some fun before the semester starts! Like something out of a great scifi novel: from Burrito Justice (and via Mark O.) "March 20th, 2072 (AP), Northern California Association of City States: With the surprising acceleration of sea level rise due to the melting of both the Greenland and Antarctic ice sheets over the past decade, the San Francisco canal system was officially abandoned this week. Additional ferry service has been announced between the new major islands of the San Franciscan Archipelago while the boring machines make progress under the Van Ness Passage and Richmond Pass for new transit tunnels." This rad poster is available for sale!

Update on the American fire and SNAMP

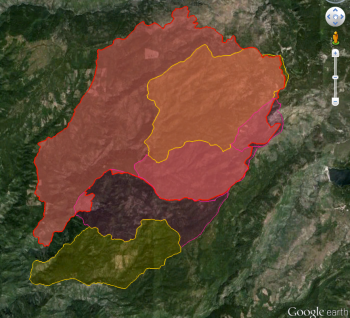
American fire as of 8-26-13The American fire is burning into our SNAMP study areas. It looks like our northern treatment and control sites have been burned through. Here is a snapshot of our study site and the fire perimeter (red) as of 8-26-13. SNAMP control (yellow) and treatment (purple) watersheds are shown.

American Fire Status from Incident Report as of 8-26-13: Fire Status: The south, west and north perimeters of the fire remainin patrol status. Some pockets of heat were found interior to the westside containment line and extinguished last night. Crews have completed burning operations adjacent to the Mosquito Ridge Road, along the eastern perimeter. These burning operations have consisted of fire fighters lighting low intensity (“cool”) fire with the intent of reducing ground fuels between the fire perimeter and the main fire. This tactic was highly successful as it reduced the potential of themain fire escaping containment lines. Crews continue to transition into detecting and extinguishing any remaining hot spots. With increased containment of the fire, crews have begun work repairing areas affected by fire fighting activities. This has included chipping material piled next to roads during fire line construction as well as identifying needs to construct water control devices along fire lines throughout the fire area. Forest visitors are asked to adhere to area and road closures. These closures are in place to protect visitors and fire fighters. The roads and areas that have been closed are unsafe due to fire-weakened, burned trees that pose a risk of falling, as well as frequently heavy smoke making visibility extremely poor. These areas and roads will be re-opened as soon as possible.

Summary Stats:

  • Total acres burned: 24,935 acres
  • Containment: 88%
  • Containment expected: Thursday August 29th, 2013 approx. 12:00 AM

Some resources:

We will keep you posted.

For more on the SNAMP project see: http://snamp.cnr.berkeley.edu/

This was originally posted on /.


American fire burns into SNAMP sites

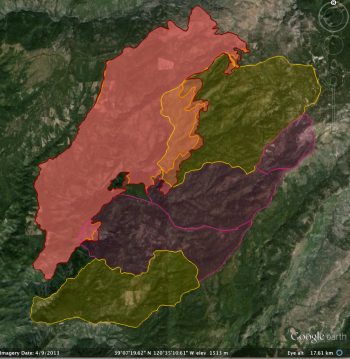
American fire perimeter (red) as of 8-20-13The American fire is burning into our SNAMP study areas as of yesterday. Here is a snapshot of our study site and the fire perimeter (red) as of today (8-19-13 perimeter in orange). SNAMP control (yellow) and treatment (purple) watersheds are shown.

All SNAMP field crews are safely evacuated, with almost all field work completed for the year.

From the Incident Report: "The American Fire burning in heavy fuels on extreme slopes about 10 air miles northeast of the community of Foresthill, California, and eight air miles south of Interstate 80 has grown to 14,765 acres. While the fire is predominantly SimTable animation of American fire spread - modeled thru 8-14 I am guessingburning on the Tahoe National Forest within the North Fork of the Middle Fork American River drainage, there is a potential, given changes in weather or fire behavior, for the fire to threaten areas near Foresthill.

Active fire behavior continues on the eastern and southern flanks of the fire. Overnight, crews continued to build hand and dozer line to contain the active fire while evaluating future containment options. Firefighters will mop up and patrol containment line along Deadwood Road and Foresthill Divide Road south to the dozer line. Indirect line construction and mop up will continue down Deadwood Ridge. On the east side near Antoine, Manila and Screwauger Canyons, American fire as of 8-20-13 from ESRI onlinedirect and indirect line construction will continue, with support of retardant drops.

Active fire behavior and roll out of burning material continue to be of concern, and will be closely monitored. Strong, erratic outflow winds and lightning may occur today, as the National Weather Service’s Red Flag Warning remains in effect until 11 p.m. Wednesday.

Active fire behavior in very steep, inaccessible terrain makes preparation of contingency lines critical. Indirect attack is the safest way to manage fire in areas of steep and difficult terrain."

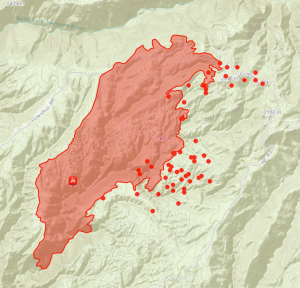
In the images to the left, both from ESRI online, there are a number of thermal hotposts in SNAMP territory American fire as of 8-21-13 from ESRI online(the red dots outside of the fire boundary) that were detected as of 10:30am 8-20-13 (upper image). As of 8-21-13 the MODIS hotspots indicate possible fire movement along Foresthill Rd to the east, and into the SNAMP control study area.


  Some resources:

We will keep you posted.

For more on the SNAMP project see: http://snamp.cnr.berkeley.edu/

This was originally posted on /.

Fall 2013 GIF Workshops Scheduled

The Fall 2013 schedule of workshops has been posted! Check them out at: http://gif.berkeley.edu/support/workshops.html.

Workshops include:

  • Intro to Geographic Information Systems (GIS): Environmental Science Focus
  • Intro to Geographic Information Systems (GIS): Social Science Focus
  • Intro to Global Positioning Systems (GPS): Working with Garmin receivers
  • Intro to Remote Sensing: Understanding digital imagery
  • Intro to Remote Sensing: Pixel-based analysis
  • Intro to Remote Sensing: Land cover change analysis
  • Intro to Remote Sensing: Object-based image analysis (OBIA)
  • Intro to Open Source GIS: Working with Quantum GIS (QGIS)
  • Intro to species distribution modeling
  • Creating your own web maps

ANR members are invited to attend. GIF workshops offer hands-on applications oriented training in a variety of geospatial topics. Workshop fees are available at a subsidized rate of $84 for all UC students (graduate and undergraduate), faculty, and staff. Workshop fees are $224 for all non-UC affiliates.

IGIS Retreat 2013

We just concluded our first IGIS Program all-hands-on-deck retreat. We evaluated our program components and made huge progress on planning for the future.  Key in our discussion was GIS Training for ANR, and linkages with the ANR Research and Extension Centers (RECs). The IGIS Program components include:

  • GIS Services Center: If you are in ANR and need help with your GIS Project, check out the ANR Services Center!
  • Training: We are developing a curriculum of GIS training.  Stay tuned! The first session ("Intro to WebGIS for ANR" involving Google and ESRI products) will be scheduled by the end of 2013.
  • ANR InfoBase: We are developing a database of REC related data and research project information.  These data will be made available through an online webGIS portal that is linked to other similar and complementary efforts statewide (including HOLOS).  
  • ANR EON: Eddy covariance towers and climate sensors will be placed at each ANR RECs. All sensor data will be available to ANR and other researchers. Check out Todd's post on setting up one of these towers.

Workshop wrap up: Google Earth Higher Education Summit 2013

For three days in late July 2013 Kevin Koy, Executive Director of the GIF and Maggi spent time at Google with 50+ other academics and staff to learn about Google Earth's mapping and outreach tools that leverage cloud computing. The meeting was called Google Earth for Higher Education Summit, and it was jam packed with great information and hands-on workshops. Former Kellylabber Karin Tuxen-Bettman was at the helm, with other very helpful staff (including David Thau - who gave the keynote at last year's ASPRS conference). Google Earth Outreach has been targeting non-profits and K-12 education, and are now increasingly working with higher education, hence the summit. We learned about a number of valuable tools for use in classrooms and workshops, a short summary is here.  

Google Mapping Tools - the familiar and the new

  • Google Earth Pro. You all know about this tool, increasing ability to plan, measure and visualize a site, and to make movies and maps and export data.
  • Google Maps Engine Lite. This is a free, lite mapping platform to import, style and embed data. Designed to work with small (100 row) spreadsheets.
  • Google Maps Engine Platform. The scaleable and secure mapping platform for geographic data hosting, data sharing and map making. streamlines the import of GIS data: you can import shapefiles and imagery. http://mapsengine.google.com.
  • Google Earth Engine. Data (40 years of global satellite imagery - Landsat, MODIS, etc.) + methods to analyze (Google's and yours, using python and javascript) + the Cloud make for a fast analytical platform to study a changing earth. http://earthengine.google.org/#intro
  • TimeLapse. A new tool showcasing 29 years of Landsat imagery, allows you to script a tour through a part of the earth to highlight change. Features Landsat 4, 5 7 at 30m, with clouds removed, colors normalized with MODIS. http://earthengine.google.org/
  • Field Mobile Data Collection. GME goes mobile, using Open Data Kit (ODK) - a way to capture structured data and locate it and analyze after home.
  • Google Maps APIs. The way to have more hands-on in map styling and publishing. developers.google.com/maps
  • Street View. They have a car in 32 countries, on 7 continents, and are moving into national parks and protected areas. SV is not just for roads anymore. They use trikes, boats, snowmobiles, trolleys; they go underwater and caves, backpacks.

Here are a couple of my first-cuts:

New Google Earth Engine Timelapse tool! Very cool

Check out this new tool from Google:

This wicked cool tool is called Earth Engine Timelapse. check it out at http://bit.ly/timelapseearth

Explore a global timelapse of our planet, constructed from Landsat satellite imagery. Watch as mines spread across the surface of Wyoming. Each frame of the timelapse map is constructed from a year of Landsat satellite data, constituting an annual 1.7-terapixel snapshot of the Earth at 30-meter resolution. The Landsat program, managed by the USGS, has been acquiring images of the Earth's surface since 1972. Landsat provides critical scientific information about our changing planet.

Here is my first attempt showing some forest changes in the Sierra Nevada

Study Finds Spatial Skill Is Early Sign of Creativity

From the NYTimes: http://www.nytimes.com/2013/07/16/us/study-finds-early-signs-of-creativity-in-adults.html

A gift for spatial reasoning — the kind that may inspire an imaginative child to dismantle a clock or the family refrigerator — may be a greater predictor of future creativity or innovation than math or verbal skills, particularly in math, science and related fields, according to a study published Monday in the journal Psychological Science.

Go GIS!

Proba-V, SPOT replacement is cranking

An update from Mark about the Proba satellite: http://www.wired.com/wiredscience/2013/07/new-global-vegetation-map/.

Proba-V is a Belgian-built satellite - the latest in the European Space Agency’s PROBA series of small satellites and will take over vegetation monitoring duties from the Spot-4 and Spot-5 satellites, which are at the end of a 15-year mission. The Proba-V satellite is barely bigger than a washing machine. It was launched just two months ago has already made a wall-to-wall map of the world’s vegetation.

It orbits the Earth 14 times a day, covering the entire globe every two days with 100m resolution imager. Every 10 days, a new 200,000 megapixel image of the world’s vegetation is produced.

Background: the current Vegetation-1 and Vegetation-2 instruments onboard the SPOT 4 and SPOT 5 satellites will only be available till May 2014. For almost 15 years now, these instruments have daily monitored and mapped the worldwide vegetation, thus providing essential information on crop yields, droughts, desertification, changes in the type of vegetation, deforestation, etc. to an ever extending user community.

Go Proba-V!

Hey OakMappers! Updated OakMapper available for iPhones and iPads

The new OakMapper logo

We are excited to announce the new version (2.3) of the OakMapper iPhone/iPad App, available to download now for free at the iTunes App Store [link].

In this version of the OakMapper App, the original browse and search functionalities have been retooled to improve the user interface design and user interaction. A new user can sign up for a new OakMapper account directly using the App. Users who has logged into their account can manage their profile, change their password, and submit a SOD point. The submission process has been re-engineered to achieve a better and more intuitive submission workflow. Users can also take a picture of a suspected SOD infected tree and upload it right from their iOS devices.

To explore all the new features of the OakMapper iPhone/iPad App, please install OakMapper from the iTunes App Store [link] now. Please feel free to share this App with your friends. If you like the OakMapper app, please rate the app and leave your comments in the App store. If you should have any questions, please email us at oakmapper@gmail.com.

Enjoy!

OakMapper
Shufei Lei, Web/Mobile App Developer
Maggi Kelly, Principal Investigator
www.oakmapper.org

SFEI releases new websites to support wetland management and protection

SFEI, on behalf of the Wetland Monitoring Workgroup is releasing a series of technology tools to help with aquatic resource protection and management. “These new online tools will empower Californians to access information about the value and health of their wetlands," said U.S. Environmental Protection Agency Regional Administrator Jared Blumenfeld.

EcoAtlas

EcoAtlas is designed to support management decisions about wetlands. By compiling state and federal maps and data about wetlands, EcoAtlas gives site visitors access to salient information about the condition and extent of streams, wetlands, lakes, and their surrounding riparian areas. www.ecoatlas.org

Wetlands Portal

The Wetlands Portal is the latest in the series of My Water Quality Portals (www.MyWaterQuality.ca.gov) designed to help the general public find answers to fundamental questions related to water quality both in their communities and across the state as a whole.

CRAM

The California Rapid Assessment Method is a cost-effective and scientifically sound method for monitoring wetland condition. http://www.cramwetlands.org/

CARI

The California Aquatic Resource Inventory is a standardized statewide map of wetlands, streams, and riparian areas. http://www.sfei.org/it/gis/cari

Berkeley privacy expert and linguist analyze implications of NSA surveillance

Stolen from Berkeley Online (where we read about the bold choice of U.S. Department of Homeland Security Secretary Janet Napolitano as the 20th president of the UC), but worth the echo. The massive scale of domestic surveillance conducted by the National Security Administration has stunned many Americans. But Berkeley Law’s Chris Hoofnagle saw it coming. Nearly a decade ago, the lecturer in residence warned of increasingly broad and unchecked monitoring. Meanwhile, Geoffrey Nunberg, linguistics researcher and faculty member at Berkeley’s School of Information, discussed NSA surveillance of Americans’ phone records and Internet activity on National Public Radio’s “Fresh Air with Terry Gross.”

BAAMA Summer Happy Hour - July 17 2013 - Free!

BAAMA Summer Happy Hour!!!

Free for everyone!

Who: Bay Area GEOSPATIAL Community

All are welcome! If you are OR are not a BAAMA member, love our group, or have never been to an event but want to check out our organization, this is a great gathering for you.  Come and hang out with your fellow spatial sleuths and map lovers.

What:

  • Hot dogs, and potato and cole slaw (supplied by Bay Area-vendor Top Dog)
  • A large keg of beer and other non-alc beverages (we won't run out this time)
  • Cookies
  • The outdoors (maybe a little late-afternoon sun)
  • Hang out with people you only read about on LinkedIn and Twitter…..
  • Offer up your great ideas in the BAAMA Board

When: Wednesday July 17, 2012

6:00 pm – 8:00 pm
Hot dogs served from 6:00 pm - 7:30 pm

Where: UC Berkeley, Courtyard behind Mulford Hall

37.87315 -122.26471

Landsat 8 imagery available

From Kelly:

Data collected by the Operational Land Imager (OLI) and the Thermal Infrared Sensor (TIRS) onboard the Landsat 8 satellite are available to download at no charge from GloVis, EarthExplorer, or via the LandsatLook Viewer

Orbiting the Earth every 99 minutes, Landsat 8 images the entire Earth every 16 days in the same orbit previously used by Landsat 5. Data products are available within 24 hours of reception. Check it.

Past fire visualization: SandTable to SimTable

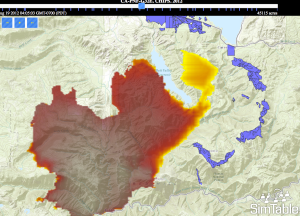
Chips fire via SimTableWhile up at Forestry Camp, Mike DeLasaux turned us on to this site: SimTable. Apparently in the early days (and still today) sandtables were used to practice for wildland fire management. A few pictures are shown here. A nice tool developed to update the sandtable idea using digital data and fire modeling is SimTable. Their website also has some great visualizations of past fires with real fire perimeter data.

For example, check out the spread of the Chips fire using their website (image at right). The fire was first sighted on July 29, 2012, burning about 20 miles (32 km) west of Quincy, California. It burned through the begining of September 2012, eventually burning about 75,000 acres in Plumas and Lassen national forests. In late August, a series of backfires along the eastern flank of the fire were lit (check out the forest treatments in purple on the map) to slow the spread. News article about the backfire here. The site is: http://apps.simtable.com/fireProgression/tests/chips/simpleOverlay.html.

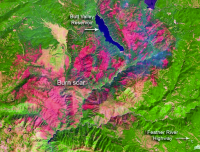
Here is the Chips burn scar from NASA.

Conference wrap up: DataEdge 2013

The 2nd DataEdge Conference, organized by UC Berkeley’s I School, has wrapped, and it was a doozy. The GIF was a sponsor, and Kevin Koy from the Geospatial Innovation Facility gave a workshop Understanding the Natural World Through Spatial Data. Here are some of my highlights from what was a solid and fascinating 1.5 days. (All presentations are now available online.)

Michael Manoochehri, from Google, gave the workshop Data Just Right: A Practical Introduction to Data Science Skills. This was a terrific and useful interactive talk discussing/asking: who/what is a data scientist? One early definition he offered was a person with 3 groups of skills: statistics, coding or an engineering approach to solving a problem, and communication. He further refined this definition with a list of practical skills for the modern data scientist:

  • Short-term skills: Have a working knowledge of R; be proficient in python and JavaScript, for analysis and web interaction; understand SQL; know your way around a unix shell; be familiar with distributed data platforms like Hadoop; understand the Data Pipeline: collection, processing, analysis, visualization, communication.
  • Long-term skills: Statistics: understand what k-means clustering is, multiple regression, Baysien inference; and Visualization: both the technical and communication aspects of good viz.
  • Finally: Dive into a real data set; and focus on real use cases.

Many other great points were brought up in the discussion: the data storage conundrum in science was one. We are required to make our public data available: where will we store datasets, how will we share them and pay for access of public scientific data in the future?

Kate Crawford, Principal Researcher, Microsoft Research New England gave the keynote address entitled The Raw and the Cooked: The Mythologies of Big Data. She wove together an extremely thoughtful and informative talk about some of our misconceptions about Big Data: the “myths” of her title. She framed the talk by introducing Claude Levi-Strauss’ influential anthropological work “The Raw and the Cooked” - a study of Amerindian mythology that presents myths as a type of speech through which a language and culture could be discovered and learned. You know you are in for a provocative talk in a Big Data conference when the keynote leads with CLS. She then presented a series of 6 myths about Big Data, illustrated simply with a few slides each. Here is a quick summary of the myths:

  1. Big Data is new: the term was first used in 1997, but the “pre-history” of Big Data originates much earlier, in 1950s climate science for example, or even earlier. What we have is new tools driving new foci.
  2. Big Data is objective: she used the example of post-Sandy tweets, and makes the point that while widespread, these data are a subset of a subset. Muki Haklay makes the same point with his cautionary: “you are mining the outliers” comment (see previous post). She also pointed out that 2013 marks the point in the history of the internet when 51% of web traffic is non-human. Who are you listening to?
  3. Big Data won't discriminate: does BD avoid group level prejudice? We all know this, people not only have different access to the internet, but given that your user experience has been framed by your previous use and interaction with the web, the rich and the poor see different internets.
  4. Big Data makes cities smart: there are numerous terrific examples of smart cities (even many in the recent news) but resource allocation is not even. When smart phones are used for example to map potholes needing repair, repairs are concentrated in areas where cell phone use is higher: the device becomes a proxy for the need.
  5. Big Data is anonymous: Big Data has a Big Privacy problem. We all know this, especially in the health fields. I learned the new term “Health Surrogate Data” which is information about your health that results from your interaction with the Internet. Great stuff for Google Flu Tracker for example, but still worrying. The standard law for protection in the public health field, HIPAA, is similar to “bringing a knife to a gunfight” as she quoted Nicholas Terry.
  6. You can opt out: there are currently no clear ways to opt out. She asks: how much would you pay for privacy? And if the technological means to do so were created and made widespread, we would likely see the development of privacy as a luxury good, further differentiating internet experience based on income.

The panel discussion Digital Afterlife: What Happens to Your Data When You Die? moderated by Jess Hemerly from Google, and including Jed Brubaker from UC Irvine and Stephen Wu, a technology and intellectual property attorney was eye-opening and engaging. Each speaker gave a presentation from their expertise: Stephen Wu gave us a primer on digital identity estate planning and Jed Brubaker shared his research on the spaces left in social media when someone dies. Both talks were utterly fascinating, thought provoking and unique.

And finally, Jeffrey Heer from Stanford University gave a stunning and fun talk entitled Visualization and Interactive Data Analysis showcased his Viz work, and introduced to many of us Data Wrangler, which is awesome.

Great conference!