Berkeley Food Institute's new grants announced

The new Berkeley Food Institute has released its crop of funded projects from its first seed grant program. Our project Making the Road by Mapping: Informing Food System Transformation through Participatory Mapmaking was selected for seed funding. This project, led by Kathryn DeMaster includes graduate students Adam Calo (ESPM) and Sarah Van Wart (Information), Darin Jensen (Geography), Tapan Parikh (Information), Kaley Grimland-Mendoza (Agriculture and Land-Based Training Association), Amber Sciligo (Post-doc, ESPM), Christy Getz (ESPM), and Jennifer Sowerwine (Jepson Herbaria). We look forward to digging in.

Our participatory mapping research project has four primary purposes: First, we explore participatory mapping as a way to collaboratively generate new food system knowledge with scholars, practitioners, and producers. Second, through a process we term “communitysourcing,” we aim to illuminate overlooked caches of community-based knowledge and engage community members, agricultural producers and scholars in collaborative efforts to map a particular food system supply chain (small-scale organic strawberry production in the Salinas Valley). Third, we aim to integrate the interdisciplinary community-based participatory research with specific understandings of the way that certain agricultural policies either facilitate or restrict sustainable small-scale organic strawberry production in the Salinas Valley (with a particular focus on water quality and food safety policy/regulations). Fourth, we will present our findings in novel, innovative, and visually captivating ways that will: (a) Inform specific policies/regulations and; (b) Provide small-scale producers with easily accessible caches of community generated knowledge to inform their practices.

http://berkeleyfoodinstitute.org/current-research/

Happy Valentine's Day Landsat 8!

It's meta-gorgeous, and better than spy vs spy: Landsat 8 catches a glimpse of its older, retired uncle Landsat 5. From NASA:

Feb 14, 2014 • Eight months ago, on June 5, 2013, the U.S. Geological Survey decommissioned the venerable Landsat 5 satellite. That day, the USGS Landsat Flight Operations Team transmitted the last command to Landsat 5, effectively terminating the mission and leaving it in a disposal orbit.

This week, Landsat 8 overflew the defunct Landsat 5, and thanks to some clever work by Mike Gartley, a Research Scientist with the Digital Imaging and Remote Sensing group at Rochester Institute of Technology (RIT)—a group that has long participated in Landsat calibration and validation—Landsat 5 was seen in an image taken by Landsat 8.

In these images, the satellite is seen as a streak of pixels (dark or light depending on the spectral band). There is one image from each of Landsat 8′s OLI bands, except for Band 7, or SWIR-2, where she blended into the clouds and was impossible to distinguish. In these images Landsat 5 is much closer to Landsat 8 than she is to the Earth. More here.

Clark Labs to Create Cloud-based Land Change Modeler for ArcGIS

Clark Labs was awarded a million dollar grant from Esri to create a cloud-based version of their Land Change Modeler for ArcGIS. Land Change Modeler is suite of tools to assess and predict land change and evaluate the impacts of change and includes REDD (Reducing Emissions from Deforestation and Forest Degradation) tools for modeling the impact of land cover change on carbon emissions. Currently Land Change Modeler is only available in IDRISI and as a software extension for ArcGIS (the latest version is compatible with v10.2). This will make this tool more easily assessable to the wider public and scientific community.

From Clark Labs press release:

"Clark Labs was recently awarded a million dollar grant from Esri to create a cloud-based version of their Land Change Modeler for ArcGIS. Currently, Clark Labs’ extension is for the ArcGIS desktop.

Land Change Modeler for ArcGIS, first released in 2007 with Version 2 released this past month, is a software extension for ArcGIS users, offering a suite of tools to assess and predict land change and evaluate the impacts of such change. Clark Labs recent release includes many significant enhancements. The new version is compatible with ArcGIS Version 10.2

The Land Change Modeler offers an extensive suite of tools for land change research in a simple and automated workflow. It provides a variety of tools for land change analysis and prediction, as well as the impacts of those changes.

The new version release of this fall provides significant enhancements, particularly for its utility for REDD (Reducing Emissions from Deforestation and Forest Degradation). Land Change Modeler now includes functionality for modeling the impact of land cover change on carbon emissions. “Our world is changing rapidly, and technology to efficiently model and predict future land change is vital to addressing global challenges,’ said Jack Dangermond, Esri President. “We’re pleased to award this grant to Clark Labs to jumpstart their effort to utilize and provide rich content through ArcGIS Online.”

The new version also provides more capability for estimating land change impacts on habitat and biodiversity. With the grant from Esri, Clark Labs will be creating a cloud-based implementation of Land Change Modeler for their platform.

Clark Labs and Esri have been business partners for nearly ten years, working collaboratively on GIS research."

For the full news release see here.

Musings about Robert N. Colwell

I am working on a retrospective of remote sensing of forests in California for the centennial. I am trying to highlight some of the pioneering work done by remote sensors that focused on Californian forests from the 1960s through the use of lidar today.

Oblique aerial view of Berkeley Campus of University of California taken with Camouflage Detection film. Robert N. Colwell

Of course with this topic you must begin with Robert N. Colwell. Dr. Colwell was an internationally renowned remote sensing scientist; he was former associate director of the Space Sciences Laboratory at the UC Berkeley, and he was the instructor of remote sensing in our own Mulford Hall from 1947 until his retirement in 1983. He was NASA co-investigator for Apollo IX, and his research in the 1960s on reflectance and multispectral reconnaissance were the primary basis for selecting the type of sensors and the spectral bands implemented in Landsat. Neat guy, and we all benefit from his intellectual legacy.

Anyway, for this paper, I am going through some of his work as he transitioned from aerial photography to digital imaging, and I came across this picture. Mulford is just off the scene in the upper left corner, and Hearst Gym pool is visible in lower part. In his caption he says:

"Oblique aerial view of Berkeley Campus of University of California taken with Camouflage Detection film." (That is what they used to call color infrared.) "Such photography is superior to any other for certain photo interpretation purposes as indicated by some of the preceding examples. Note in this photo how color values for each species of tree tend to remain uniform from foreground to background because of the superior haze penetration offered by this film. The relatively long wavelengths to which this infrared-sensitive film reacts are scattered but very little by atmospheric haze particles, thus accounting for the uniform color values and for excellent image sharpness." I dig this part: "The original color transparencies have the same color values as seen here and consequently make very attractive panels for lamp shades, although certain of their colors fade upon prolonged exposure to light."

The trend for using map products as kitchy home decorations PRE-DATES 1970! Take that hipsters!

Article source: Colwell, R.N. 1964. Aerial photography - A valuable sensor for the scientist. American Scientist, Vol. 52, No. 1 (MARCH 1964), pp. 16-49

Some more about him here: http://senate.universityofcalifornia.edu/inmemoriam/robertcolwell.htm

Predatory open access journal wrap-up spring 2014

There has been a trend toward open access publishing that has been strengthened recently with a number of coincident efforts, for example Randy Scheckman's Nobel Prize talk, and the UC's Open Access policy for example. Some journals are opening up an open access component to their publishing - Remote Sensing of Environment for example now has an open access model as well as subscription model, and some new completely open access journals are coming on line. The open access model means the author pays the publisher for the costs of putting out an article, instead of the publisher charging universities subscription fees to allow access to the journal.

Open access publishing is a great idea, whose time is ripe: publically funded research should be easily assessed by the public; in general the cost of publishing an open access journal is less than that of a regular article. But the rush to open has opened the window to fraudulent enterprises out to make a fast buck. Thus the landscape of open access publishing is often confusing, and there have been a number of great discussion about how to navigate the stormy waters of open access. Here is my wrap up of some of the informative posts out there:

Other notes pointed out in the Nature article:

  • PLOS ONE, which charges a fee of $1,350 for authors in middle- and high-income countries (UC Berkeley gets a slight price cut), has seen the number of articles it publishes leap from 138 in 2006 to 23,464 last year, making it the world's largest scientific journal.
  • In the past year, the UK and US governments, as well as the European Commission, have thrown their weight behind some form of open-access publishing.

2014 Western Section of the Wildlife Society Meeting wrap-up

I recently attended the 2014 annual meeting of the Western Section of the Wildlife Society in Reno CA. The focus of the conference was on harnessing citizen science toward greater conservation.

I saw some interesting talks in my session (I was clearly the odd-talk-out in a session dominated by animal tracking (I spoke about our SNAMP website evaluation)). For example:

  • Peter Bloom discussed red-tailed hawk movements from banded bird recovery. The birds are banded as juveniles and observed by citizens and scientists. In this way their movements can be mapped: across southern California, across the Pacific flyway, and across the US.
  • Joe Burnett presented on the use of GSM transmitters to track California condor (the largest flying bird in north America) movement patterns. He caught us up on condor recovery and current threats (lead poisoning from foraging on wild game) to condors. He showed some very nice visualizations of wild condor flights between Ventana and the Pinnacles (including some stops for water and dead animal chomping) from the GSM transmitters and Google Earth. 
  • Shannon Rich looked at migration patterns of flammulated owls using light-level geolocators. "What is a flammulated owl”? you say: I will tell you. They are super cute tiny owls, with neat flame-like markings on their face and body. Geolocators are small (~1g) that record ambient light levels during the day, and from timing of sunrise and sunset, you can get latitude and longitude. These are not sending out signals, and you need to recapture the owl to download data. As always, I am stunned by the dedication and time it takes for wildlife biologists to gather their careful data on animal movement.
  • Russ Bryant talked about native honeybee habitat in North Dakota. He talked about the important services that bees give us: 95 agricultural plants benefit from pollination services (estimated at $15b). I did not know that ND is the top honey producer in the US. Colony collapse across the US has been profound. They used INVEST to explore the role of land cover and bee pollination to produce a pollinator habitat index, and a habitat connectivity for areas where bees had been captured. 

In the climate change session, I heard from a range of speakers on practical adaptation strategies, curriculum for climate change education (Whitney Albright), new tools and reports for grassland bird species conservation (Ryan Diguadio), landscape-scale conservation planning for bobcats in the San Diego area (Megan Jennings), and some neat genetics of the SF Bay’s salt marsh harvest mouse (Mark Statham). Also, Curtis Alling talked about local, regional and state climate preparedness planning, and dedicated a slide to cal-adapt.org. Nice!

I also got to catch up briefly with ESPM grads Sarah Sawyer who is now at the Forest Service and Tim Bean, who is thriving at HSU. Alice, he suggested a trip up to Redwood State Park to check out the dark figure of crime in the tall trees. 

Cal Forestry turns 100 this year!

Forestry education at UC Berkeley began in 1914 with the “Division of Forestry” in the Department of Agriculture. The Department of Forestry was established in 1939 and the School of Forestry in 1946. Forest Summer Camp, the hallmark of the undergraduate program, began at Quincy, California, in 1915 and moved to Meadow Valley in 1917.

Today, alumni of Cal’s forestry program hold critical positions for the management of 95% of the industrial forestlands in California. The research of our alumni and faculty has grown knowledge in the areas of fire, remote sensing and GIS, ecology, climate change, forest economics, the social sciences, and numerous others.

Over the past 100 years, the Cal Forestry program has had an impact on every dimension of the field, and has produced the profession’s most influential thinkers and doers.

For more information, please see: http://nature.berkeley.edu/forestry100/about-us

Using Social Media to Discover Public Values, Interests, and Perceptions about Cattle Grazing on Park Lands

“Moment of Truth—and she was face to faces with this small herd…” Photo and comment by Flickr™ user, Doug GreenbergIn a recent open access journal article published in Envrionmental Management, colleague Sheila Barry explored the use of personal photography in social media to gain insight into public perceptions of livestock grazing in public spaces. In this innovative paper, Sheila examined views, interests, and concerns about cows and grazing on the photo-sharing website, FlickrTM. The data were developed from photos and associated comments posted on Flickr™ from February 2002 to October 2009 from San Francisco Bay Area parks, derived from searching photo titles, tags, and comments for location terms, such as park names, and subject terms, such as cow(s) and grazing. She found perceptions about cattle grazing that seldom show up at a public meeting or in surveys. Results suggest that social media analysis can help develop a more nuanced understanding of public viewpoints useful in making decisions and creating outreach and education programs for public grazing lands. This study demonstrates that using such media can be useful in gaining an understanding of public concerns about natural resource management. Very cool stuff!

Open Access Link: http://link.springer.com/article/10.1007/s00267-013-0216-4/fulltext.html?wt_mc=alerts:TOCjournals

Barbara Laraia talks about links between stress, food and obesity

Our colleague Barbara Laraia was recently interviewed by PBS newshour on her work linking stress and obesity in children. Barbara is the lead on our OurSpace project, in which Sam and Paulina and others are examining the interaction between food availability, walkability and health outcomes.

A very interesting interview: http://www.pbs.org/newshour/rundown/2014/01/why-stress-and-money-woes-may-lead-to-weight-gain.html

Job Opening: Informatics and Geographic Information Systems Program Coordinator

The University of California Agriculture and Natural Resources, a statewide program with local development and delivery, is seeking an Academic Coordinator to provide IGIS analysis, coordination and support to the Informatics and Geographic Information Systems (IGIS) team to the meet the IGIS mission.  IGIS is established to assist and advance research and extension activities by coordinating the development of Informatics and GIS tools and applications and make them available through an online web‐accessible portal.

The IGIS program coordinator will coordinate with the IGIS leadership team to advance ANR’s Strategic Vision of close partnerships between researchers, Cooperative Extension specialists and advisors, and the people of California by providing geospatial and informatics tools, data, training, consultation, and map products to the Division of Agriculture and Natural Resources. The program coordinator will support IGIS interests and projects across ANR, encouraging collaboration across ANR operational units, and develop contacts within the University’s geospatial community.

Location headquarters: Davis or Berkeley, Calif.

Position description: http://ucanr.edu/Work_in_Progress/Jobs_990/?jobnum=556

IGIS website: http://igis.ucanr.edu/

ANR website:  http://ucanr.edu/jobs/

UCOP web site:  http://jobs.universityofcalifornia.edu/

California Water Blog talks about our future

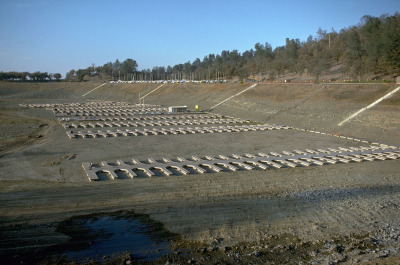
Boat slips in Folsom Lake in a drought (1976). The reservoir was at 18 percent of capacity on Tuesday (Jan. 7, 2013). Source: California Department of Water ResourcesAs a follow-up to this disasterous news about California's water situation, here is a very thought provoking blog about California's water future. They list their 10 predictions for our changed future, including:

  • Parts of the Sacramento-San Joaquin Delta will permanently flood.
  • The Tulare Basin and San Joaquin River regions will have less irrigated agriculture.
  • Urban areas will use less water per capita, reuse more wastewater and capture more stormwater.

Check out the California Water Blog - Resistance is futile: Inevitable changes to water management in California.

http://californiawaterblog.com/2014/01/07/resistance-is-futile-inevitable-changes-to-water-management-in-california/.

NASA Shows Just How Bad The California Drought Is and Jerry Brown declares a state of emergency in California

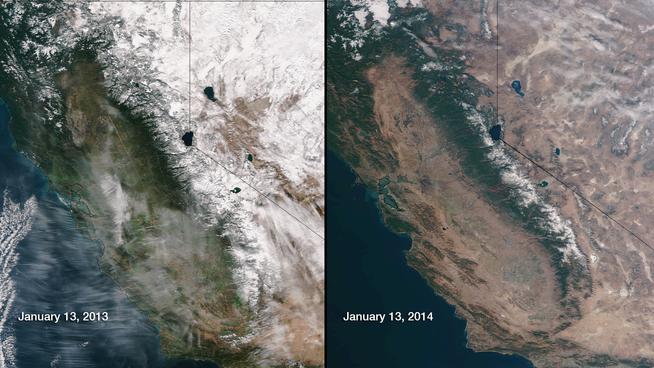
One image from NASA shows just how severe the California drought is click here for more about this image

Governor Jerry Brown officially declared a drought emergency in California, asking residents to voluntarily reduce their water use by 20 percent and committing to bolster the state's dwindling water supplies with better management and federal assistance. Read more here

Spring 2014 GIF workshop schedule

UC Berkeley's Geospatial Innovation Facility (GIF) is offering 10 training workshops this semester that use a hands-on approach to help you get started using spatial analysis to enhance your research.  

GIF workshops are available at a subsidized rate of $84 each for all UC students, faculty, and staff, and $224 each for all non-UC affiliates.  View the GIF website to learn more about the following workshops and to register.

  • 1/31, 12-4 pm. Intro to Geographic Information Systems (GIS): Environmental Science Focus
  • 2/7,  12-4 pm. Intro to Geographic Information Systems (GIS): Social Science Focus
  • 2/21, 12-4 pm. Intro to Global Positioning Systems (GPS): Working with Garmin receivers=
  • 3/7, 12-4 pm. Intro to Remote Sensing: Understanding digital imagery
  • 3/14, 12-4 pm. Intro to Remote Sensing:Pixel-based analysis
  • 3/21, 12-4 pm. Intro to Remote Sensing: Land cover change analysis
  • 4/11, 12-4 pm. Intro to Remote Sensing: Object-based image analysis (OBIA)
  • 4/18, 12-4 pm. Intro to Open Source GIS: Working with Quantum GIS (QGIS)
  • 4/25, 12-4 pm. Creating your own web maps
  • 5/2, 12-4 pm. Intro to species distribution modeling

Summary of IGIS Survey (from 2013)

In 2013, the IGIS team developed the Survey of Informatics and GIS Needs, Knowledge and Data Availability that ran from January 14 – March 15. It was a short and comprehensive survey that helped us to evaluate the level of Informatics and GIS expertise and use of geospatial tools and data in ANR. The results are assisting the IGIS team to design and provide tools, analysis, and training to ANR personnel.

Our conclusion from the survey is that IGIS can play a large and new role in training, analytical support, and databasing across ANR. We can fill a need with IGIS: 79% of respondents are not getting assistance from ANR, yet across the board, ANR personnel need Informatics and GIS assistance - over 70% of respondents need GIS work or analytical support on their projects. While 81% have not taken ANR provided GIS training, 80% would take ANR provided GIS training. Also, despite the ability for ANR personnel to use the UC Davis site license, nearly half of respondents do not think they have access to GIS software.

We received 112 unique responses from across ANR. Respondants came from across ANR, and included:

  • Academic Administrators    2
  • Academic Coordinators   2
  • Administrators    4
  • AES Faculty    6
  • Lab Staff    3
  • Office Staff    5
  • Other    10
  • REC Directors    2
  • UC Researchers    3
  • UCCE Advisors    32
  • UCCE Specialists    15
  • UCCE Statewide Program Staff    2

We are looking at doing another survey in 2014, to continue to understand GIS needs in ANR.

Conference at UCB on Digital Privacy and Surveillance - March 6

Pan-Optics: Perspectives on Digital Privacy and Surveillance

March 6, 10:30 a.m.-4 p.m. 310 Sutardja Dai Hall, Banatao Auditorium

bit.ly/pan-optics2014

Featured Speakers: Rebecca MacKinnon, Senior Research Fellow, New America Foundation; Trevor Paglen, Artist, Social Scientist, and Author

Advances in drone aircraft, networked cameras, and recent disclosures about the NSA’s international and domestic surveillance activities have stimulated public protests, outrage from activists, and new policy discussions among elected leaders. This symposium will highlight emerging perspectives on visual privacy and consider the state of the art from a variety of disciplines and professions, including technology, journalism, filmmaking and the arts.

Though traditionally considered separate domains, visual and digital surveillance practices are being combined as machine vision, facial recognition and other technologies become more sophisticated and interoperable. Institutional surveillance by semi-autonomous drones and remote cameras, citizen video monitoring, and incessant photo-sharing and tagging on social networks enable perpetual documentation. The same tools can be used for both transparency and repression.

This symposium will bring together scholars and practitioners from a range of disciplines to discuss privacy protections, surveillance methods, and modes of resistance in a digital age. The program will feature two keynote addresses and two panel discussions that will explore emerging surveillance technologies and applications across a range of contexts, and then turn to resistant strategies employed by individuals and organizations in response.

Registration required: $20 General Admission,  $10 Faculty or Staff,  $5 Students

Citizen science: key questions explored in a new report

In a recent article published in the Guardian, Michelle Kilfoyle and Hayley Birch discuss the widespread use of citizen science initiatives. They recently produced a report (pdf) for the Science for Environment Policy news service, in which the authors review a number of citizen science case studies, and explore the potential benefits of citizen science for both science and society, especially given the advent of new mobile technologies that enable remote participation. They also ask interesting questions about who really benefits the most from these developments: the amateurs or the professionals?

Key questions addressed and highlighted in this report include:
  1. How could new and developing technologies help citizen science projects feed into environmental policy processes?
  2. Is environmental data produced by citizen scientists as accurate as environmental data produced by professional scientists?
  3. How can citizen science benefit environmental monitoring and policymaking?

Big Data for sustainability: an uneven track record with great potential

An interesting position piece on the appropriate uses of big data for climate resilience. The author, Amy Luers, points out three opportunities and three risks.

She sums up:

"The big data revolution is upon us. How this will contribute to the resilience of human and natural systems remains to be seen. Ultimately, it will depend on what trade-offs we are willing to make. For example, are we willing to compromise some individual privacy for increased community resilience, or the ecological systems on which they depend?—If so, how much, and under what circumstances?"

Read more from this interesting article here.

Dense cities contribute less GHG

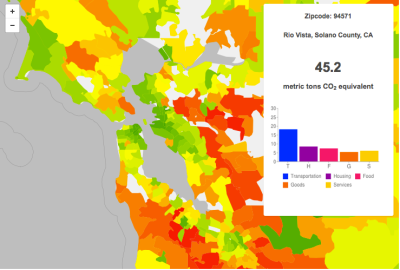
A CoolClimate Map of the SF Bay Area's carbon footprint by zipcode tabulation area shows a pattern typical of large metropolitan areas: a small footprint (green) in the urban core but a large footprint (orange and red) in surrounding suburbs.According to a new study by Dan Kammen and graduate student Christopher Jones at UC Berkeley, population-dense cities contribute less greenhouse-gas emissions per person than other areas of the country, but these cities’ extensive suburbs essentially wipe out the climate benefits.

Dominated by emissions from cars, trucks and other forms of transportation, suburbs account for about 50 percent of all household emissions – largely carbon dioxide – in the United States.

The study uses local census, weather and other data – 37 variables in total – to approximate greenhouse gas emissions resulting from the energy, transportation, food, goods and services consumed by U.S. households, so-called household carbon footprints.

A key finding of the UC Berkeley study is that suburbs account for half of all household greenhouse gas emissions, even though they account for less than half the U.S. population. The average carbon footprint of households living in the center of large, population-dense urban cities is about 50 percent below average, while households in distant suburbs are up to twice the average.

Interactive carbon footprint maps for more than 31,000 U.S. zip codes in all 50 states are available online at http://coolclimate.berkeley.edu/maps.

A link to their paper in Environmental Science & Technology is here: Spatial distribution of U.S. household carbon footprints reveals suburbanization undermines greenhouse gas benefits of urban population density (ES&T, 2014)

From: http://newscenter.berkeley.edu/2014/01/06/suburban-sprawl-cancels-carbon-footprint-savings-of-dense-urban-cores/

Graduate 
Certificate
 in 
GIS approved for UC Berkeley

 Great news! 

The UC Berkeley Graduate 
Certificate 
in
 Geographic 
Information 
Science 
and
 Technology
 (GIST)
 has been approved. This certificate will provide
 an 
academic
 structure 
for 
an 
interdisciplinary 
exchange 
of
 ideas 
around
 geospatial
 information 
and 
analysis. 

 Certificate
 students 
will
 not 
only
 participate 
in
 a 
cutting‐edge 
program 
and
 receive
 explicit
 recognition
 of 
specialization 
in
 GIST
 by 
virtue 
of
 the
 Graduate
 Certificate 
but
 will 
be
 well
 positioned
 to
compete
 for 
the
 most
 desirable 
jobs 
in 
geospatial
 technology,
 both 
in
 academia
 and 
in 
industry.

Requirements include at
 least 
three 
courses, 
or 
a
 total
 of
 90 
hours
 of
 instruction, 
and
 earn 
a
 minimum 
grade
 of
, and participate in a GIST Roundtable (such as the geolunch series from the GIF). More details to be posted in the spring at GIS@Berkeley.edu.

Help to Validate Global Land Cover with GeoWiki and Cropland Capture

Courtesy of the International Institute for Applied Systems Analysis

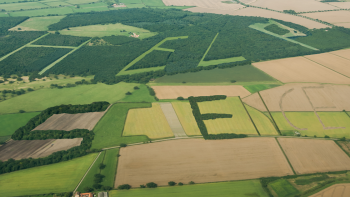
This creative project from GeoWiki seeks to get croudsourced feedback on crop types from participants around the world. They say: 

By 2050 we will need to feed more than 2 billion additional people on the Earth. By playing Cropland Capture, you will help us to improve basic information about where cropland is located on the Earth's surface. Using this information, we will be better equipped at tackling problems of future food security and the effects of climate change on future food supply. Get involved and contribute to a good cause! Help us to identify cropland area!

Oh yeah, and there are prizes!

Each week (starting Nov. 15th) the top three players with the highest score at the end of each week will be added to our weekly winners list. After 25 weeks, three people will be drawn randomly from this list to become our overall winners. Prizes will include an Amazon Kindle, a brand new smartphone and a tablet.