Upcoming Events of Interest at Stanford
/Bay Area Geo-Educators Summit on Oct 2nd
Women in Data Science Conference on Nov 2nd
mapping for a changing california
Welcome to the Kellylab blog! We post fun facts and things that catch our eye. Occasionally I wax lyrically about a topic of interest.
Bay Area Geo-Educators Summit on Oct 2nd
Women in Data Science Conference on Nov 2nd
Did you know that it is International Map Year? 2015-2016.
The International Map Year (IMY) is a worldwide celebration of maps and their unique role in our world. Supported by the United Nations, IMY provides opportunities to demonstrate, follow, and get involved in the art, science and technology of making and using maps and geographic information.
http://mapyear.org/about-international-map-year/
Think about ways in which maps can be integrated into your work!
Great commentary from Martin Isenburgon of LASTools fame on releasing data with false precision. This deals with the new open data release by the Environment Agency in England. So far LiDAR-derived DTM and DSM rasters have been released for 72% of the entire English territory at horizontal resolutions of 50 cm, 1 m, and 2 m. They can be downloaded here. The rasters are distributed as zipped archives of tiles in textual ASC format (*.asc).
Martin gives us a cautionary tale on how not to release national data. It is not the ASC format that he has problems with, but the vertical precision. He says:
"The vertical resolution ranges from femtometers to attometers. This means that the ASCII numbers that specify the elevation for each grid cell are written down with 15 to 17 digits after the decimal point."
Example heights might be something like: 79.9499969482421875 or 80.23999786376953125. These data should be resolved to about the cm, not attometer, whatever that is. Crazy man!
Read the full post: http://rapidlasso.com/2015/09/02/england-releases-national-lidar-dem-with-insane-vertical-resolution/
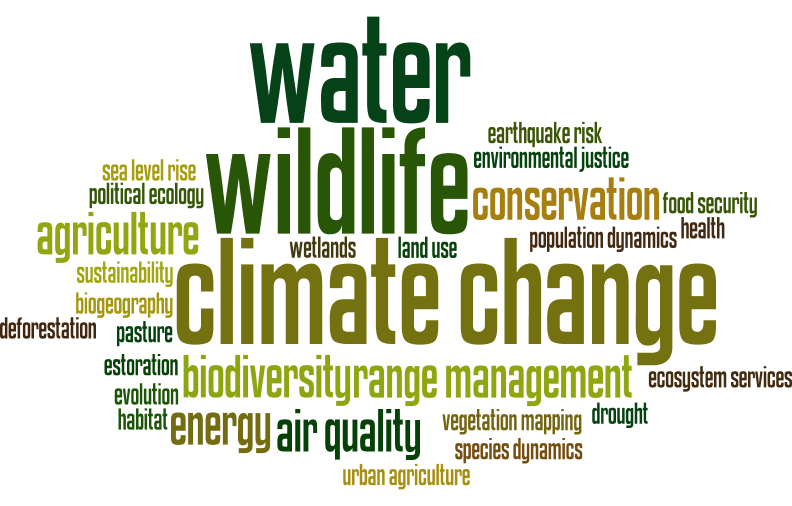
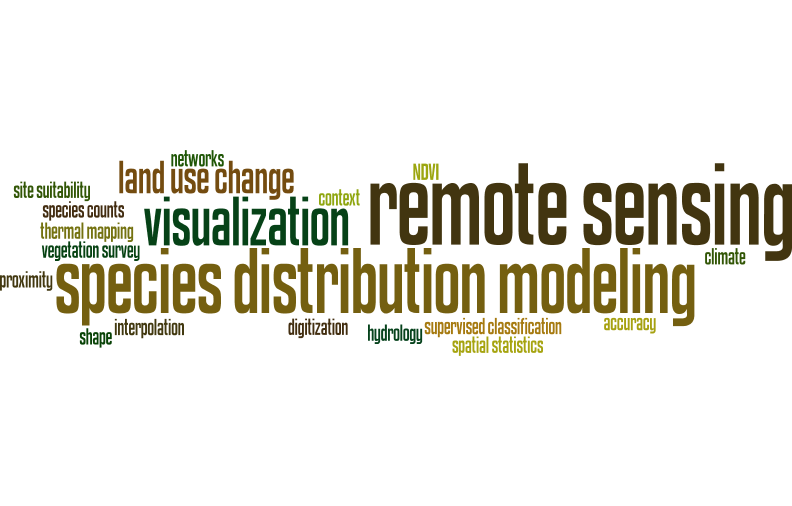
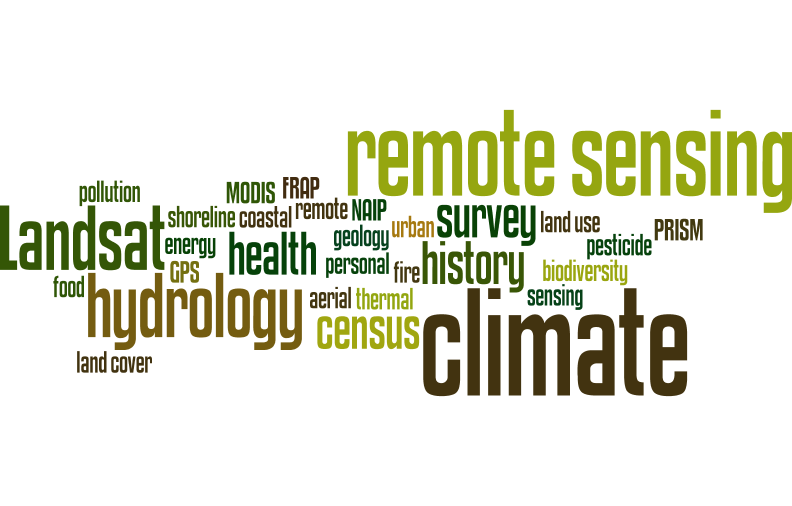
Here are the tag clouds from this year's GIS class: the why, how and what of our upcoming semester's projects. Word clouds from Wordle.
The Why: what are the key problems class members want to focus on...
 The How: possible methods we will use...
 The What: some of the datasets that might be used...
Here in the Kelly Lab we talk a lot about effective ways to visualize data. How do we show the true weight and impact of those data we work with? How do we communicate uncertainty? I think this fellow Neil Halloran did a pretty great job with WWII. This short video is a combination of visualization and narration. While effective visualization on its own is ideal, I think the narration offers different avenues of talking about uncertainty in the data. Check out his video HERE.
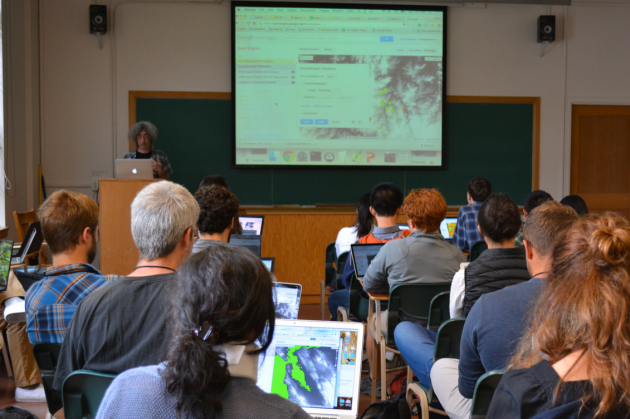
Students, researchers, mappers, and big data enthusiasts took place in an exciting 2 day Google Earth Engine workshop this last week hosted by the GIF and the Google Earth Engine Team. We had an exiting overview of the latest and greatest research adventures from Google by Kelly lab alum Karin Tuxen-Bettman including advances in some of what Google Earth Outreach team is involved in...
As well as new/upcoming ventures
The Earth Engine team led some great tutorials getting people well versed in JavaScript and using the Earth Engine playground, and Earth Engine API. Having beginner and advanced workshop tracks during the two day event allowed for both broad and deep participation from researchers across the Berkeley campus. Take a look at the packed agenda and more
We also had a stellar panel of UC Berkeley professor Jeff Chambers and graduate students Sophie Taddeo, Alexander Bryk, and Lisa Kelley who shared an intimate view of how they were using Earth Engine in their research. The panel shared stories of using Earth Engine to evaluate disturbance in tropical forests, map the movement of wetlands, and meandering rivers, as well as looking at agroforestry systems in Indonesia through a socio-ecological lens.
Thanks to Google and the Earth Engine Team for guiding, the GIF for hosting, and all of the participants for engaging in an action packed two days!
August 20 & 21, 2015
Geospatial Innovation Facility @ Mulford Hall, UC Berkeley
What will you learn?
Led by instructors from Google Earth Outreach and Google Earth Engine, this workshop will teach highly practical tools which can be used to collect, host, analyze, visualize, and publish map data using the power of the cloud. Sessions will include hands-on experience at both beginner and advanced levels using Google Earth Engine, which brings together the world's satellite imagery — trillions of scientific measurements dating back almost 40 years — and makes it available online with tools for scientists, independent researchers, and nations to mine this massive warehouse of data to detect changes, map trends and quantify differences on the Earth's surface. Applications include: detecting deforestation, classifying land cover, estimating forest biomass and carbon, and mapping the world’s roadless areas. Learn more aat http://earthengine.google.org/.
Who should attend?
Researchers and educators at UC Berkeley and UC affiliates who meet one or more of the following should attend!
Cost & Registration
Attendance is free, but registration is required since space is limited. http://ucberkeley2015.earthoutreach.org/home
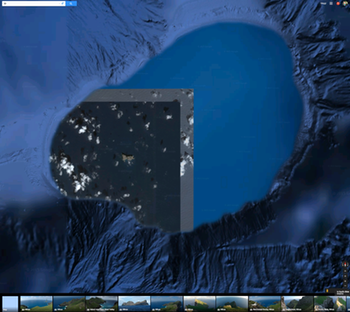 This is the island of Nihoa, northwest of Kauai, viewed in Google Maps. Hawaii on my mind. Anyway, it is a funny shot with mixed resolutions, bathymetry and optical imagery, and what looks to be a bordered image without its adjacent partner images. Web link: https://www.google.com/maps/@23.0606579,-161.8639537,39656m/data=!3m1!1e3
Check out the webinar: DRONES FOR THE EARTH SCIENCES: APPLICATIONS AND IMPLICATIONS, provided by the Board on Earth Science and Resources.
There are also links to the webinar UNEARTHING CITIZEN SCIENCE with Muki Hacklay.
Remote Sensing in Ecology and Conservation is a new, fully open access journal from Wiley and the Zoological Society of London. The journal will provide a forum for the rapid publication of peer-reviewed, multidisciplinary research from the interface between remote sensing science and ecology and conservation. The journal defines remote sensing in its broadest sense, including data acquisition by hand-held and fixed ground-based sensors, such as camera traps and acoustic recorders, and sensors on airplanes and satellites. The journal's intended audience includes ecologists, conservation scientists, policy makers, managers of terrestrial and aquatic systems, remote sensing scientists, and students.
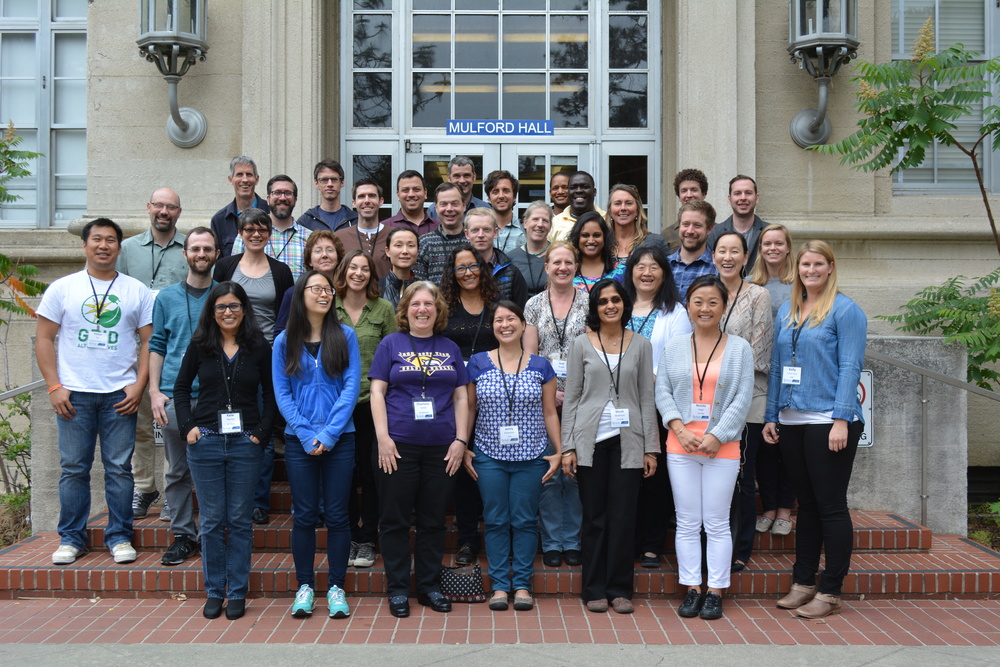 Bootcamp participants outside historic Mulford HallOur bootcamp on Spatial Data Science has concluded. We had three packed days learning about the concepts, tools and workflow associated with spatial databases, analysis and visualizations.
Our goal was not to teach a specific suite of tools but rather to teach participants how to develop and refine repeatable and testable workflows for spatial data using common standard programming practices.
On Day 1 we focused on setting up a collaborative virtual data environment through virtual machines, spatial databases (PostgreSQL/PostGIS) with multi-user editing and versioning (GeoGig). We also talked about open data and open standards, and modern data formats and tools (GeoJSON, GDAL).
Analyzing spatial data is the best part! On Day 2 we focused on open analytical tools for spatial data. We focused on one particular class of spatial data analysis: pattern analysis, and used Python (i.e. PySAL, NumPy, PyCharm, iPython Notebook), and R Studio (i.e. raster, sp, maptools, rgdal, shiny) to look at spatial autocorrelation and spatial regression.
Wait, visualizing spatial data is the best part! Day 3 was dedicated to the web stack, and visualization. We started with web mapping (web stack, HTML/CSS, JavaScript, Leaflet), and then focused on web-based visualizations (D3). Web mapping is great, and as OpenGeo.org says: “Internet maps appear magical: portals into infinitely large, infinitely deep pools of data. But they aren't magical, they are built of a few standard pieces of technology, and the pieces can be re-arranged and sourced from different places.…Anyone can build an internet map."
All-in-all it was a great time spent with a collection of very interesting mapping professionals from around the country (and Haiti!). Thanks to everyone!
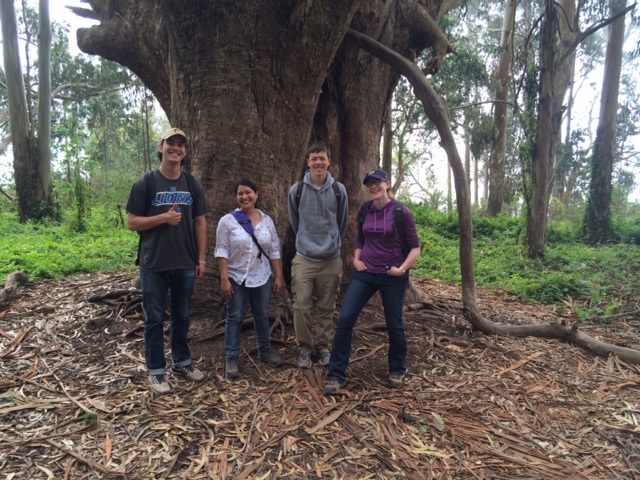
 Sean, Kelly, Alice and Maggi at Forestry CampOnce again members of the Kelly lab trooped into the forest to present GIS and web mapping workshops. We've been doing this since 2012 with Mike Delasaux's great organizational help. This year the workshops were coordinated between IGIS and the GIF, and we had help from Kelly Easterday, Alice Kelly, and Sean Hogan. The Berkeley Forestry Camp is 100 years old, and what fun it is to be in those woods sharing memories of Berkeley Forestry and talking about mapping. Here we are in front of the venerable Baker Forest sign. We of course missed Sam and Stefania!
Here is my first webmap I made a camp! This represents Berkeley's population from 2007.
Several UC Cooperative Extension and UC scientists have been awarded the Western Extension Directors Association Award of Excellence for work to address the outbreak of sudden oak death in California. Led by Yana Valachovic, the group developed extension programming that achieved outstanding accomplishments, results and impacts in addressing this important issue. We were recognized for:
The people involved in the group award are: Yana Valachovic, Steve Swain, Matteo Garbelotto, Janice Alexander, Lisa Bell, Bendan Twieg, Dave Rizzo, Steve Tjosvold, David Lewis, Doug McCreary, Katie Palmieri, Kerri Frangioso, Jim MacDonald, Ellie Rilla, Maggi Kelly, Rick Standiford, Chris Lee, Doug Schmidt, Brice McPherson, and Richard Dodd.
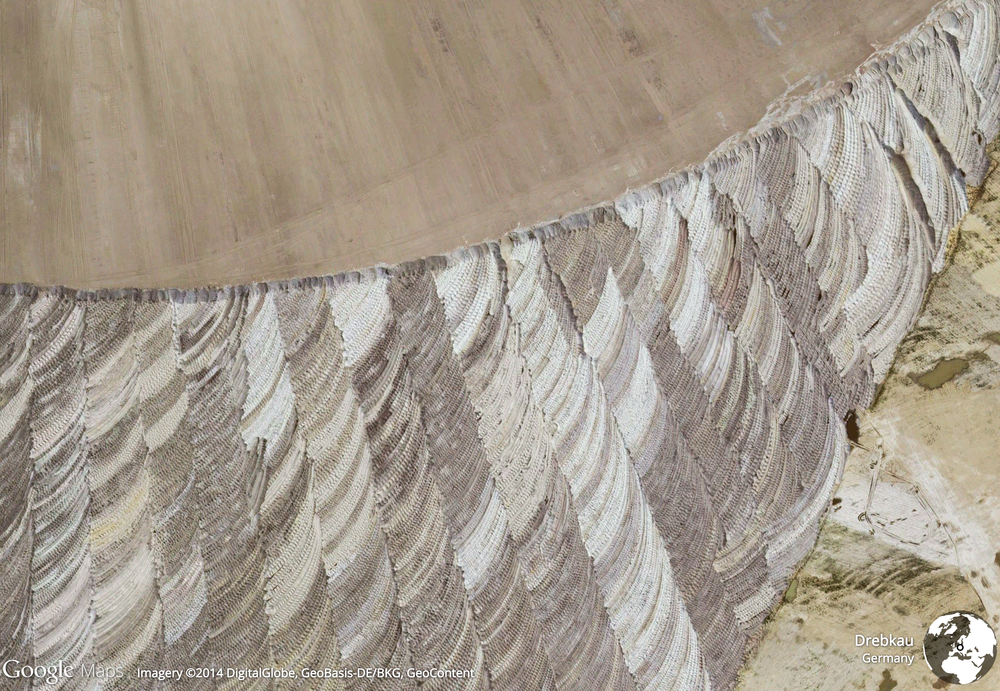
Kelly turned us on to this plugin from Google. Each time you get a new tab on your browser, you get treated to a new picture of the earth! But, check this one out:

From Drebkau, Germany. I have no idea what this is an image of - could it be grain fields of some kind, or is it just someone at Google's garage sale carpet? Any thoughts?
Here is another view of the same area:
From Bruce Riordan, at the Climate Readiness Institute.
Bay Area Climate Stakeholders: Governor Brown's new Executive Order, issued today is a banner day for our climate change efforts.
1. The Executive Order sets a new interim goal for GHG reduction—40% below 1990 levels by 2030.
2. The Executive Order, for the first time, outlines a series of steps the State will take to address climate adaptation and resilience.
See the press release, reaction from world leaders, and the full Executive Order at: http://gov.ca.gov/home.php
 Kelly Lab SPUR Students Drew Adamski and Ryan Avery have been participating in lab research all semester. In particular they have been helping classify trails within the Pacific West's National Parks. This month we were lucky enough to travel out with them to Point Reyes National Seashore to see some of those trails in person. We were also lucky enough to spend the day with Chief Ranger Schifsky who was kind enough to talk to us about what issues different trails in the park were facing and which trails seemed to be changing most rapidly. Chief Schifsky was also kind enough to show us some of the points in the park where the landscape had changed dramatically over time due to fire, restoration projects, or differing management strategies. Overall it was a really inspiring and informative trip!
 Photo of Chicago from Frank Kehren, Flickr Creative Commons LicenseI focused on a series of CyberGIS sessions at AAG this year. This was partly to better situate our spatial data science ideas within the terminology and discipline of Geography, and partly to focus on a new topic for me in AAG conferences. There were a number of organized sessions over three days, including a plenary by Timothy Nyerges from UW. Talks ranged in topic: online collaboration, participatory analytics, open tool development such as python-based tools for parallelization of GIS operations, case studies of large area computation, introduction to languages that might be less familiar to geographers (e.g., Julia, R).
There was a session that focused on education in which ideas about challenging in teaching “cyberGIS” to undergraduate students, among other things. Additionally, Tim Nyerges gave the CyberGIS plenary: "Computing Complex Sustainable Systems Resilience" in which he made the case that CyberGIS is a framework for studying socio-economic systems, resilience, and system feedbacks.
About the term Cyber. I am not alone in my dislike of the term "CyberGIS" (Matrix 4, anyone?), but it seems to have stuck here at AAG. In many of the talks “cyber” meant “bigger". There were mentions of the “cyber thing”, which I took to be a placeholder for cluster computing. However, there are many other terms that are being used by the speakers. For example, I saw talks that focused on participatory, structured, analytic-deliberation from UW, or high performance geocomputation from ORNL; the latter term I think better captures what earth system science people might recognize. Many talks used as their entry point to Cyber the proliferation of data that characterizes modern geography and life.
These sessions were organized through an NSF-funded center: The CyberGIS Center for Advanced Digital and Spatial Studies http://cybergis.illinois.edu/. Their formal definition of CyberGIS is: “geographic information science and systems (GIS) based on advanced infrastructure of computing, information, and communication technologies (aka cyberinfrastructure)". They say it "has emerged over the past several years as a vibrant interdisciplinary field and played essential roles in enabling computing-, data- and collaboration-intensive geospatial research and education across a number of domains with significant societal impact."
And of course, we had excellent talks by the Kellys: Kelly presented on our VTM work: "Quantifying diversity and conservation status of California's Oak trees using the historic Vegetation Type Mapping (VTM) dataset” as part of an organized Historical Ecology session. Alice presented her paper: "Policing Paradise: The Evolution of Law Enforcement in US National Parks" as part of the session on Green Violence 2: Interrogating New Conflicts over Nature and Conservation.
Goodbye Chicago! You provided a wonderful venue, despite the cold!