Spatial Data Science @ Berkeley May 2015

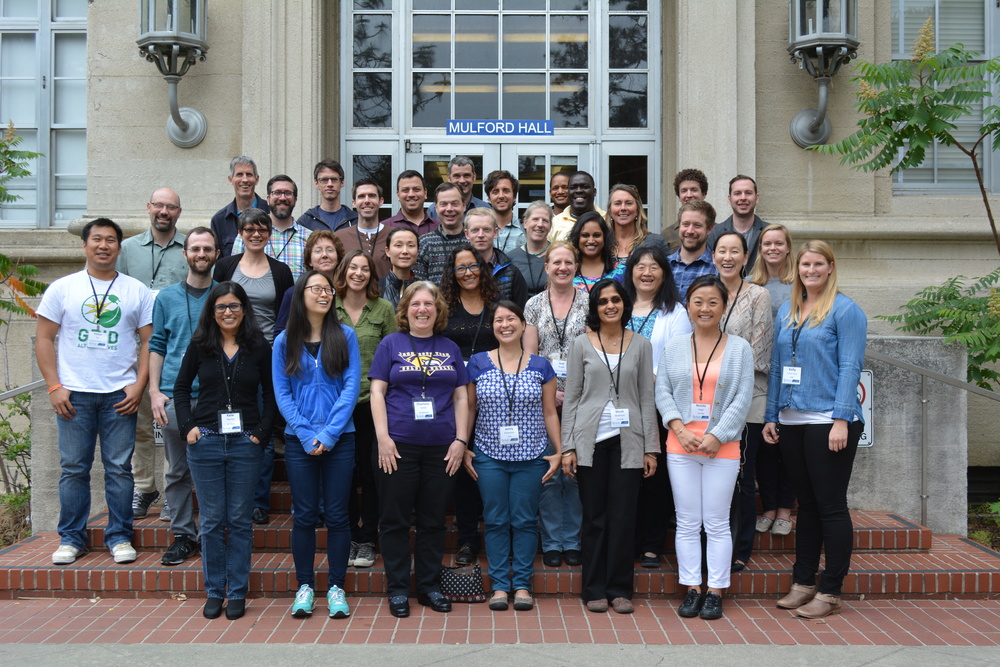
Bootcamp participants outside historic Mulford HallOur bootcamp on Spatial Data Science has concluded. We had three packed days learning about the concepts, tools and workflow associated with spatial databases, analysis and visualizations. 

Our goal was not to teach a specific suite of tools but rather to teach participants how to develop and refine repeatable and testable workflows for spatial data using common standard programming practices.

On Day 1 we focused on setting up a collaborative virtual data environment through virtual machines, spatial databases (PostgreSQL/PostGIS) with multi-user editing and versioning (GeoGig). We also talked about open data and open standards, and modern data formats and tools (GeoJSON, GDAL).

Analyzing spatial data is the best part! On Day 2 we focused on open analytical tools for spatial data. We focused on one particular class of spatial data analysis: pattern analysis, and used Python (i.e. PySAL, NumPy, PyCharm, iPython Notebook), and R Studio (i.e. raster, sp, maptools, rgdal, shiny) to look at spatial autocorrelation and spatial regression. 

Wait, visualizing spatial data is the best part! Day 3 was dedicated to the web stack, and visualization. We started with web mapping (web stack, HTML/CSS, JavaScript, Leaflet), and then focused on web-based visualizations (D3).  Web mapping is great, and as OpenGeo.org says: “Internet maps appear magical: portals into infinitely large, infinitely deep pools of data. But they aren't magical, they are built of a few standard pieces of technology, and the pieces can be re-arranged and sourced from different places.…Anyone can build an internet map."

All-in-all it was a great time spent with a collection of very interesting mapping professionals from around the country (and Haiti!). Thanks to everyone!

GIS in the Forest - 2015

Sean, Kelly, Alice and Maggi at Forestry CampOnce again members of the Kelly lab trooped into the forest to present GIS and web mapping workshops. We've been doing this since 2012 with Mike Delasaux's great organizational help. This year the workshops were coordinated between IGIS and the GIF, and we had help from Kelly Easterday, Alice Kelly, and Sean Hogan. The Berkeley Forestry Camp is 100 years old, and what fun it is to be in those woods sharing memories of Berkeley Forestry and talking about mapping. Here we are in front of the venerable Baker Forest sign. We of course missed Sam and Stefania!

Information on the GIST Minor and Graduate Certificate

Hi all,

Our gis.berkeley.edu website had to be taken down. Information on the GIST Minor and Graduate Certificate can be found here:

 Thanks!

GIS related classes Spring 2015

Hello World!

There are several GIS classes to chose from in the spring. So far we have: 

Lower division:

  • Butsic, V  ESPM 72 Geographic Information Systems

Upper division:

  • Chambers, J    GEOG 185    Earth System Remote Sensing   

Graduate:

  • Biging, G & Radke, J   ESPM 210    Spatial Data Analysis for Natural Resources   
  • deValpine, P   ESPM 215    Hierarchical Statistical Modeling in Environmental Science (some spatial data analysis)
  • Radke, J    LDARC 221    Quantitative Methods in Environmental Planning
  • O'Sullivan   GEOG 228    Spatial Simulation Modeling 
  • Dronova, I    LDARC 254    Applied Remote Sensing
  • Wang, I   ESPM 290 Special Topics in Environmental Science: Spatial Ecology
  • Song, J     PH2728 GIS and Public Health

Email me with others.
Thanks!

ASPRS scholarship application deadline Oct 31

ASPRS SCHOLARSHIPS APPLICATION DEADLINE FOR THE 2015 AWARDS YEAR IS OCTOBER 31, 2014

New for 2015, the DigitalGlobe Foundation Award for the Application of High-Resolution Digital Satellite Imagery will make available one new collection of imagery in addition to the archive imagery previously available.  Applicants may apply for one new collection from any of DigitalGlobe’s five satellites (IKONOS, QuickBird, GeoEye-1, WorldView-1, and WorldView-2), not exceeding 500 square kilometres. Grant of a new collection may not compete with areas experiencing high demand for satellite resources or with DigitalGlobe Regional Affiliates (Contact the DigitalGlobe Foundation for details). This is limited to one new collection that will be granted within one calendar year, conditioned upon satellite availability and a strong application.
 
The SAIC/Estes Memorial Teaching Award will now be supported by Leidos whose mission ‘…is built on a commitment to do the right thing for our customers, our people, and our community.”  The Award will be known as the Leidos/Estes Memorial Teaching Award.
 
FOR SCHOLARSHIP DETAILS, GO TO: http://www.asprs.org/ASPRS-Awards-and-Scholarships.html

Graduate Certificate in GIST up and running

The UC Berkeley Graduate 
Certificate 
in
 Geographic 
Information 
Science 
and
 Technology
 (GIST)
 has been approved, and is up and running. This certificate will provide
 an 
academic
 structure 
for 
an 
interdisciplinary 
exchange 
of
 ideas 
around
 geospatial
 information 
and 
analysis.

Certificate
 students 
will
 not 
only
 participate 
in
 a 
cutting‐edge 
program 
and
 receive
 explicit
 recognition
 of 
specialization 
in
 GIST
 by 
virtue 
of
 the
 Graduate
 Certificate 
but
 will 
be
 well
 positioned
 to
compete
 for
the
 most
 desirable 
jobs 
in 
geospatial
t echnology,
 both 
in
 academia
 and 
in 
industry.

Requirements include at
 least 
three 
courses, 
or 
a
 total
 of
 90 
hours
 of
 instruction, 
and
 earn 
a
 minimum 
grade
 of
 B, and participate in a GIST Roundtable (such as the geolunch series from the GIF). The full proposal detailing requirements can be found below. Please note that acceptable courses will be updated as new courses are offered. 

For more information, please click here.

NOTE: THIS CERTIFICATE IS FOR CURRENTLY ENROLLED GRADUATE STUDENTS AT UC BERKELEY. It is not a professional GIS certificate for non-students.

Google Geo for Higher Education Summit 2014


Just got back from an amazing workshop with the Google Earth Outreach Geo Team and 50+ geospatial educators, researchers, and lab managers! 

In between stealing off on the colorful google bikes  and spending time wandering the amazing Google campus, we engaged each other in discussions of integrating Google tools into higher education and learning and attended workshops introducing the plethora of Google mapping tools.

We had a warm welcome from Brian McClendon (VP of Engineering, Geo at Google, mastermind behind Google Earth, and creator of KML) who gave a great history of the program and the creation of Google Geo and gave an exciting announcement that Google; with the acquisition of Skybox is now taking to the sky with their own satellites in hand (contrary to popular belief, Google has not to this point owned any Satellites).  With this acquisition, near-real live time imagery on Google platforms seems to be closer than ever before.

Rebecca Moore (Engineering Manager, Google Earth Outreach and Earth Engine) also gave a great history of the importance of Google Earth and its transformation over the years highlighting a number of exiting things to come and products not yet released to the public including

1. A new MODIS time-lapse!

From Maggi’s blog post last year on timelapse created from LANDSAT imagery we saw the amazing capabilities to see transformations over time with the click of a button. Now Google will soon release MODIS time-lapse which having a quicker repeat interval will be able to show seasonal changes .

Check out this example here showing fires across the world, and more targeted video here! Awesome!

2. Also great news for those of you tired of the coarse resolution SRTM 90 DEM, Google is currently working to produce a much higher resolution global DEM product…stay tuned!

Throughout the 3 days, I had the opportunity to attend a variety of different workshops and came away absolutely jazzed! See below for a summary of the latest and greatest from the Google Geo team with links attached if you’re interested and want more information….. Also stay tuned for some of my renderings and products from the training!

Google’s “Ecosystem” of Technologies

Mapping:

Google Maps Engine (GME): hosting data and publishing maps online, and ability to build applications and connect Google’s data with your own.

GME Pro&Lite: simple map making in the cloud, visualize, draw, import a csv, and style your maps

Maps Gallery: A new way for organizations and public institutions to publish and share their maps online through the Google maps Engine

Google Crisis Map: a map interface initially used for emergency alerts, however it’s not entirely dedicated to crisis as you can easily integrate and create your own map mashup and community awareness map here

Maps Engine API (application program interface): to access Maps Engine data, create a new applications utilizing the data, stylize and create beautiful maps

Analysis

Google Earth Engine: (EE), Google’s geospatial analysis platform. Earth Engine brings together the world's satellite imagery — trillions of scientific measurements dating back almost 40 years — and makes it available online with tools for scientists, independent researchers, and nations to mine this massive warehouse of data to detect changes, map trends and quantify differences on the Earth's surface.

Earth Engine API (application programming interface) provides the ability to create your own algorithms to process raster and vector imagery.

Timelapse builds on Earth Engine to show decades of planetary change, both man-made and natural

Data Collection

Streetview: in Google Maps and Earth provides over five millions miles of interactive 360-degree panoramas across all seven continents; it’s the closest thing to teleportation, allowing teachers and students to virtually walk almost anywhere they dream of going. Street View began on the roads, but new technologies like theTrekker backpack or an underwater rig can take you almost everywhere.

                -Treks: Street view special collections (museums, up a mountain,etc..)

                -Views: streetview imagery crowd-sourced from user generated 360 degree photospheres. You can now connect your photospheres to create your own street view using constellations

Mobile Data Collection using Open Data Kit allows you to collect field data, such as text, photos/videos, and GPS location from an Android device where there's no internet connection and then publish that data to the web when you're back online. You can then export your data into Google Earth Engine for mapping and Google Fusion Tables for graphing, mapping and visualization. 

Visualization/ Story Telling

Tour Builder: Tour Builder is a new way to show people the places you've visited and the experiences you had along the way using Google Earth. It lets you pick the locations right on the map, add in photos, text, and video, and then share your creation. The new geo-enabled Powerpoint!


Thanks to Maggi for the opportunity to attend and the talented, enthusiastic Google Geo staff (including: Karin Tuxen-Bettman, John Bailey, David Thau, Christiaan Adams, and all the other workshop leads and those behind the scenes!) for developing such an action packed workshop!
Sierra Nevada Decision Support System

Former student and GIS expert Chippie Kislik alerted me to this video. She is working with others at NASA Ames on a Sierra Nevada DSS Ecological Forecasting Project. A video about the project is here.

The Sierra Nevada contains vital ecosystems that are experiencing changes in hydrologic regimes, such as decreases in snowmelt and peak runoff, which affect forest health and water resources. Currently, the U.S. Forest Service Region 5 office is undergoing Forest Plan revisions to integrate climate-change impacts into mitigation and adaptation strategies. However, there are few tools in place to conduct quantitative assessments of forest and surface conditions in relation to mountain hydrology, while easily and effectively delivering that information to forest managers. To assist the Forest Service, this research team created a Decision Support System (DSS) featuring data integration, data viewing, reporting, and forecasting of ecological conditions within all Sierra Nevada intersecting watersheds.

Graduate 
Certificate
 in 
GIS approved for UC Berkeley

 Great news! 

The UC Berkeley Graduate 
Certificate 
in
 Geographic 
Information 
Science 
and
 Technology
 (GIST)
 has been approved. This certificate will provide
 an 
academic
 structure 
for 
an 
interdisciplinary 
exchange 
of
 ideas 
around
 geospatial
 information 
and 
analysis. 

 Certificate
 students 
will
 not 
only
 participate 
in
 a 
cutting‐edge 
program 
and
 receive
 explicit
 recognition
 of 
specialization 
in
 GIST
 by 
virtue 
of
 the
 Graduate
 Certificate 
but
 will 
be
 well
 positioned
 to
compete
 for 
the
 most
 desirable 
jobs 
in 
geospatial
 technology,
 both 
in
 academia
 and 
in 
industry.

Requirements include at
 least 
three 
courses, 
or 
a
 total
 of
 90 
hours
 of
 instruction, 
and
 earn 
a
 minimum 
grade
 of
, and participate in a GIST Roundtable (such as the geolunch series from the GIF). More details to be posted in the spring at GIS@Berkeley.edu.

Those crowded skies: Flight maps and delays

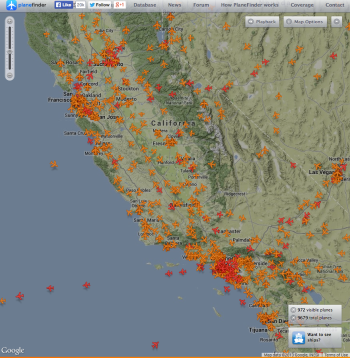
real time map of flights from planefinder.netYou've probably seen the frequently-cited "Misery Map" (D3 behind the scenes) showing how the Thanksgiving storm has blown many a tight travel plan off schedule.

Here is another cool one: real-time map of all the flights in the air. It looks crowded!

How it works.


Happy and safe travels everyone.

FlightAware.com has created the Misery Map, a real-time weather and flight data visualization tool that overlays Nexrad radar imagery on a map of the country, with red-green graphs showing the pain at major airports.
Read more at http://www.flyingmag.com/technique/flight-planning/flightaware-misery-map-tracks-travel-delays#tXwGX8OjSo5QhDUk.99

Berkeley privacy expert and linguist analyze implications of NSA surveillance

Stolen from Berkeley Online (where we read about the bold choice of U.S. Department of Homeland Security Secretary Janet Napolitano as the 20th president of the UC), but worth the echo. The massive scale of domestic surveillance conducted by the National Security Administration has stunned many Americans. But Berkeley Law’s Chris Hoofnagle saw it coming. Nearly a decade ago, the lecturer in residence warned of increasingly broad and unchecked monitoring. Meanwhile, Geoffrey Nunberg, linguistics researcher and faculty member at Berkeley’s School of Information, discussed NSA surveillance of Americans’ phone records and Internet activity on National Public Radio’s “Fresh Air with Terry Gross.”

The 21st century map: it involves citizens and the web

Check out this neat article about how research will likely increasingly use the web, mobile apps and the citizens who love them, in gathering data and in sharing information.

Rawiya Kameir says, in the article entitled "Researchers must harness powers of web and citizen science, experts say": As the web and web-based apps become more and more sophisticated, the role played by citizen science is growing in scope and size. And as the scientific process evolves, citizen involvement - especially in scientific endeavors that require large data sets - will become a cornerstone of research.

As the web and web-based apps become more and more sophisticated, the role played by citizen science is growing in scope and size. And as the scientific process slowly evolves, citizen involvement - especially in scientific endeavours that require large data sets - will become a cornerstone of research

Read more: http://www.itproportal.com/2012/11/10/researchers-must-harness-powers-of-web-and-citizen-science-experts-say/#ixzz2DRtd9Mvy
Researchers must harness powers of web and citizen science, experts say

Read more: http://www.itproportal.com/2012/11/10/researchers-must-harness-powers-of-web-and-citizen-science-experts-say/#ixzz2DRtQgyqP

http://www.itproportal.com/2012/11/10/researchers-must-harness-powers-of-web-and-citizen-science-experts-say/#ixzz2ChoOfadS

Happy Thanksgiving everyone!

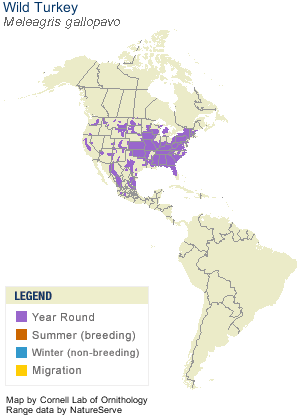
Range map of our friend Meleagris gallopovaThe ancestor all present-day gobblers—Meleagris gallopova - ranged from southeastern Canada to Mexico. 

Our present-day wild turkey has a loud call, with descending gobbles, and a variety of clucking notes. He struts through open woodlands, oaks, edges, and the occasional suburb.

The Wild Turkey’s popularity at the table led to a drastic decline in numbers, but they have recovered and now occur in every state except Alaska.

I think Ben Franklin said it best, in comparing the turkey to the eagle:

For in Truth the Turk'y is in comparison a much more respectable bird, and withal a true original native of America.... He is, (though a little vain and silly, it is true, but not the worse emblem for that,) a Bird of Courage, and would not hesitate to attack a grenadier of the British Guards, who should presume to invade his Farm Yard with a red Coat on.

Happy Thanksgiving Everyone!

Information from A Short History of the Turkey by the Collonial Williamsburg Newsletter, and BirdFellow.com.

Introduction to the Web-enabled Landsat Data (WELD) products using open source software

Introduction to the Web-enabled Landsat Data (WELD) products using open source software

At American Geophysical Union Fall 2012 Meeting, San Francisco December 6, 2012
______________________________

The NASA funded Web-enabled Landsat Data (WELD) project is providing near-continental scale 30m Landsat time series products (http://weld.cr.usgs.gov).

This 4.5 hour training workshop will provide student and expert users with tips and techniques to handle the WELD products.

Participants will bring their own laptops and a Linux-like Virtual Machine will be installed with remote sensing and GIS open source software, sample WELD products, scripts, and example exercises that illustrate a variety of WELD environmental monitoring and assessment applications. Participants will be assisted through the example exercises and all training material will be available for their later consultation. New WELD product versions will be available and participant feedback and suggestions to evolve the WELD processing
algorithms, product contents and format will be sought.
More information at http://globalmonitoring.sdstate.edu/projects/weld/weldtraining.html

Cost: Free (No AGU Registration Fee Needed)
Date: December 6, 2012
Time: 6:00pm - 10:30pm
Location: San Francisco Marriott
Room: Sierra A

New study on diabetes risk and neighborhood walkability

The reading for this week's GIS class on vector analysis discussed network buffer measures of neighborhood walkability, and the class came up with numerous components of the built and social environment that the authors didn't include in their land-use based walkability measure that also likely influence people's walking behaviors (e.g. destinations to walk to, crime/safety, trees and greenness, sidewealk quality and ramps, traffic, disincentives from parking costs, etc.). It was a great discussion! I just came acrosos this write-up about a recent article in the journal Diabetes Care that finds a strong relationship between neighborhood walkability and diabetes risk, especially for low-income immigrants. The UC Library doesn't have online access to the most recent one month of articles for this journal, so I haven't been able to look at the full methodolgy for their walkabilty measure. But, I wanted to note it here and will follow-up later with details. Or, if anyone finds access to the full article, please let me know!