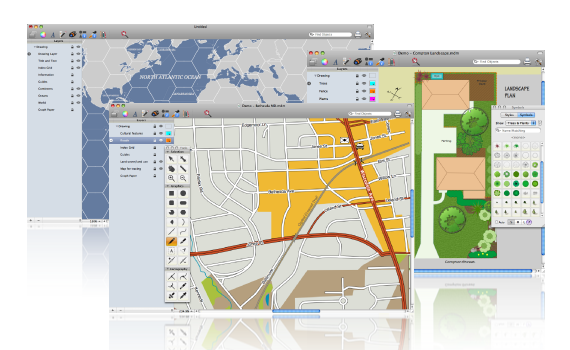
Mapdiva, LLC has just resleased its map illustration software OrteliusTM for Mac computers. It's only 30Mb to download a free 31-day trial version, and for now they're offering an 'Introductory Price' of $79 (versus $99) until the end of September. An Education Edition is also available only $39 (after Sept. 30 willl be $49) for currently enrolled students with a valid .edu address.
Note that the company states, "Ortelius is designed for cartographic output as the end product, intentionally not a GIS system, though the Professional Edition with add more GIS-type operations to the currently available tools. On a general note the Standard Edition is likely to fall short in some aspects for hardcore geographers and GIS users; the Professional Edition is intended to provide many more GIS features." So some users may want to wait for the Pro Edition for increased functionality.
From The Map Room
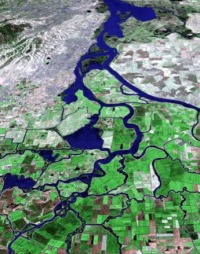 William Bowen has produced some new lovely high res aerial flyovers (some with what he describes as "choppy and unscripted" - but very informative - narration). At left, one of his great images of the Delta from the California Atlas of Panoramic Images.


 Eric Sanderson is visiting CNR next week: Chris G pointed me to his work. Imagining Manhattan before European contact through visualization. Gorgeous work, and appealing on many levels for geographers everywhere.