Clark Labs teams up with Google.org to develop web based land-cover analysis and REDD tools

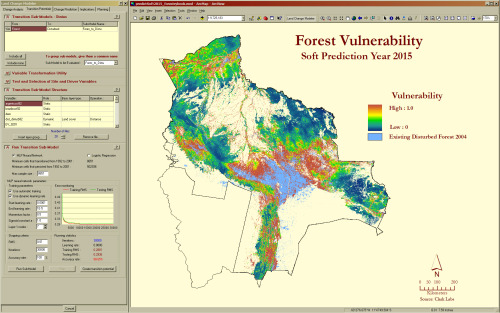
Land Change Modeler for ArcGIS (Image used with permission from Clark Labs)

From Clark Labs news:

Clark Labs recently received a $451,000 grant from the Gordon and Betty Moore Foundation to support the development of land-cover analysis and REDD tools for use on Google's Earth Engine. REDD, Reducing Emissions from Deforestation and Forest Degradation, is a climate change mitigation strategy that offers developing countries incentives to reduce forest carbon emissions. The complex implementation of REDD relies on substantial computing and data resources, and requires significant effort and investment. It is hoped that providing accessible modeling tools with Google’s cloud computing resources and wealth of geospatial data will encourage broader adoption of REDD.

The grant supports the development of a prototype of the land change analysis and prediction tools for Google.org’s Earth Engine platform, a technology in development that enables global-scale monitoring and measurement of changes in the Earth’s forests. It is planned that Google will host the required geospatial data layers to implement a REDD project, including maps of those factors identified as critical causes of deforestation, such as proximity to roads, slopes or distance from existing deforestation.

The new tools in development will guide the user through the steps of baseline development--land change analysis of the reference, project and leakage areas of a project, the identification of the carbon pools and input of carbon density values, and the estimation of emissions for projected dates. This new functionality will also directly produce the multitude of tables and graphics for the carbon accounting reporting requirement of REDD. The preparation costs of REDD will be significantly reduced by the automation provided by these tools.

Clark Labs is based within the Graduate School of Geography at Clark University in Worcester, MA and is the developer of the IDRISI Taiga GIS and Image Processing software and the Land Change Modeler software extension to ArcGIS. To view the full news release click here.

ArcGIS.com online mapping now available

ESRI has just launched a public beta version of their online mapping service on arcgis.com

At the ArcGIS.com site, you can browse featured ArcGIS Online content such as maps and applications published by ESRI and the ArcGIS community, and add comments and ratings. You can upload and share your own items, either with specific groups that you created or are a member of, or you can share your items publicly. Use the newly designed Web Mapping application to quickly create online mashups that you can also share with others.

The design and interface is nicely done, and includes easy access to many of ESRI's online basemaps.  This site launch coencides with a greatly updated version of ArcGIS Explorer which provides a much improved free GIS viewer, tightly integrated with ArcGIS desktop layers and outputs.


Transit & Trails: Go hiking without a car in the Bay Area

Ryan Branciforte at the Bay Area Open Space Council reports on their new web tool: Transit and Trails. The new interactive website identifies more than 500 trailheads and 150 campgrounds in our region’s 1.2 million acres of preserved lands. Just enter your starting location at Transit and Trails’ Google Maps-powered site, and select the radius. Once you’ve picked your ideal trail from the results, Transit and Trails will open a new link in 511 Transit Trip Planner, where you’ll find a detailed trip itinerary, complete with a map, transit times, fares, and walking directions to and from the transit stop. Very cool.

Related news: from the SF Chron, SF Hostels, mother nature network, & triple pundit.

Offset points in ArcMap

Working with GIS, everyone encounters those problems that he knows there is a solution to, but he has no idea how to fix. Dealing with overlapping points has been a persistent example of such a problem for me. The other day, I was working with a file that contained several points with identical locations. In this case, the precise location of the points was less important than depicting the number of occurrences in the general region. I still wanted to show points on the map and did not want to show the number of occurrences in an enclosing polygon. Therefore, I needed a way to spread my points out.

After briefly scouring the ESRI site I found this guide for separating points based on labels. Essentially, this documents gives instructions to remove the symbols for the points in question and to enable the labels, but replacing the label text with symbols. Now symbols for the points show up where the labels would normally appear. I used this in conjunction with the labeling tools in the Maplex extension in ArcMap to gain a little more control over how the labels would be dispersed and to provide more offset.

This solution is only appropriate in certain scenarios, but it is a quick fix to a problem that I frequently encounter.

Does anyone else use a different solution to this problem?

iPhone apps for environmental science

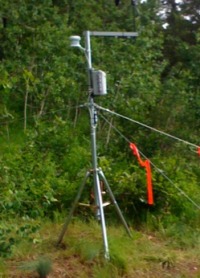
Having just set up a HOBO weather station over the weekend (ain't she pretty?), and being dismayed at having to use my windows computer to control it, I wondered about other ways to monitor the environment.  Amazingly, but perhaps not surprisingly, there are many new iPhone apps out there for us to investigate. 

For example: the recent NPR study about soil moisture monitoring via the iPhone is interesting. The sensors themselves are very expensive, but are monitored via an iPhone app.

Also: this new Wind Meter app, which I am going to test at lunch today. Seems fun, but a far cry from a real anemometer.

And of course: we will soon be releasing our OakMapper iPhone app.

GIS article database

I just came across a helpful bibliography of GIS literature created and maintained by ESRI. It indexes journals, conference proceedings, books, and reports fro the origins of GIS to the present. There are currently 78,400 entries. You can't download all articles directly from the site, but the keyword search is really helpful to get a list of articles on a particular topic that would be good to look into.

Democratizing Data

The Federal CIO Coucil has just launched Data.gov, a site that brings all federal data into one searchable place. You can directly download xml, csv, kml/kmz, and shp files and find links to tools for finding other data.

Here are some more details from the White House press release:

"Created as part of the President's commitment to open government and democratizing information, Data.gov will open up the workings of government by making economic, healthcare, environmental, and other government information available on a single website, allowing the public to access raw data and transform it in innovative ways.

Such data are currently fragmented across multiple sites and formats—making them hard to use and even harder to access in the first place. Data.gov will change this, by creating a one-stop shop for free access to data generated across all federal agencies. The Data.gov catalog will allow the American people to find, use, and repackage data held and generated by the government, which we hope will result in citizen feedback and new ideas.

Data.gov will also help government agencies—so that taxpayer dollars get spent more wisely and efficiently. Through live data feeds, agencies will have the ability to easily access data both internally and externally from other agencies, which will allow them to maintain higher levels of performance. In the months and years ahead, our goal is to continuously improve and update Data.gov with a wide variety of available datasets and easy-to-use tools based on public feedback and as we modernize legacy systems over time.

Democratizing government data will help change how government operates—and give citizens the ability to participate in making government services more effective, accessible, and transparent."


helpful new features from ESRI

here are some gems I learned about at CalGIS:

1. Go to ArcGIS Online Resources to quickly, easily, and freely add in terrific basemap data and high res imagery to any .mxd. If you are logged in you will have access to a lot more options.

2. Arc 9.3.1 (to be released any day now) will include a "layer packages" feature. So, if you want to send someone your file exactly as you are looking at it, you can right click on the layer and select "save as layer package", and it will zip the .shp + .lyr into a .lpk to share more easily. Also, there will be free access to Microsoft Virtual Earth within your Arc desktop.

OakMapper 2.0 released

Hi y'all. The new OakMapper 2.0 is up and running, and we'd like your help in mapping areas of oak mortality around the state. Version 2.0 improves upon the website's prior version with increased functionality and additional tools within an easily navigated interface.  Launched by the UC Berkeley Kelly lab in October, OakMapper 2.0 makes it easier for users to explore data, download maps, look at images of oak mortality, and submit suspected locations of oak mortality that may be associated with SOD.  The new interface utilizes the familiar background layers and navigation tools from Google Maps.  Users are able to draw points and polygons directly on the map as well as attach photos to specific points.  The Kelly lab encourages the public to use this site to map suspected cases of SOD and to track their submission by signing up for an account with OakMapper.  Registered users of the site can update their information and make comments on other users' points.  Official confirmations of P. ramorum are clearly separated from community-submitted points and either set of points can be filtered out.The new OakMapper is found at oakmapper.org.  Please consider signing up to be an OakMapper user! The OakMapper was recently featured in the recent journal of the Bay Area Automated Mapping Association

.

After Google (Maps), What?

"After Google, What?" was the name of a course at the iSchool, but Paul Smith of EveryBlock has asked the same of Google Maps. His answer? An open source web mapping stack. Check out his cool article on A List Apart, "Take Control of Your Maps". If you haven't checked out EveryBlock, do so. Their maps are beautiful. We use a lot of these technologies in the lab and in the GIIF, with the exception of Mapnik, which, to my shame, I've tried and failed to install. Update Some responses: a thread on geowanking including a response from Google evangelist Pam Fox, and discussion and response from the author on ALA (for some reason the post isn't on Technorati yet...).