Launch of Sonoma County Veg Mapping Program

The Sonoma County Agricultural Preservation and Open Space District has begun a 3-5 year program to map Sonoma County’s diverse plant communities.

An accurate, up-to-date map of vegetation and habitat type is key to ensuring good planning and management for watershed protection, flood control, fire and fuels management, and wildlife habitat conservation. A vegetation map is also critical to assessing climate benefits provided by the landscape, such as the amount of carbon being absorbed from the atmosphere or the degree to which the landscape is buffering extreme weather events.

These folks are using 3-6-inch CIR imagery and obia to map vegetation across Sonoma County. GIF is serving up the imagery! Check it out!

Pre-development Delta report from SFEI

The San Francisco Estuary Institute-Aquatic Science Center is pleased to announce the publication of its latest report, Sacramento-San Joaquin Delta Historical Ecology Investigation: Exploring Pattern and Process. The report is the culmination of several years of research synthesizing thousands of pieces of historical evidence with contemporary scientific understanding. The report provides new information about how the Delta functioned to provide habitat for native species and includes dozens of rarely seen historical accounts, maps, and photographs. For more information, please see today's press release.

The report and Geographic Information System (GIS) data are available for download here. Printed copies of the report will be available in several weeks, at a cost of $75 each (plus tax/shipping).

Media Contacts:
Robin Grossinger, Senior Scientist, San Francisco Estuary Institute-Aquatic Science Center, (510) 746-7380 (office), 510 326 3732 (cell), or robin@sfei.org

Carl Wilcox, Policy Advisor to the Director for the Bay-Delta, California Department of Fish and Game, (707) 738-4134, or cwilcox@dfg.ca.gov

New blue marble: history of its development on video

Recently, NASA released a new Blue Marble graphic, from sensors aboard TERRA. The Talk of the Nation Science Friday video of the week tells the story of these NASA's Blue Marble maps.  From the Apollo 8 crew's image from 1968, to the Apollo 17 mission of 1972, through the Voyager image, through modern remote sensing techniques, to 2002's original Blue Marble image (now used as the default background on the iphone), to this new release. They highlight the work of Rob Simmon and Gene Feldman, who discuss the composition of the product, highlighting the art that goes into the scientific product. Very cool! More discussion here.

Wetland restoration reduces sea level rise impacts over next 100 years in the SF Bay

sun setting on bay marshA new study led by Diana Stralberg at PRBO Conservation Science and including work done by our own Lisa Schile, projects a bleak future for San Francisco Bay’s tidal marshes under high-end sea-level rise scenarios that are increasingly likely. PRBO and colleagues found that in the worst case scenario 93% of San Francisco Bay's tidal marsh could be lost in the next 50-100 years (with 5.4 feet or 1.65 meters of sea-level rise, low sediment availability and no significant restoration). Not all marshes will be lost and restoration currently underway can keep more marshes intact as sea levels rise.

"Tidal marshes are incredibly resilient to changes in sea level, depending on how fast seas rise and how much sediment is available.  Unfortunately, marshes cannot keep up with the high-end sea-level rise predictions on their own.  They will need our help.” said Diana Stralberg, the study lead author of PRBO and the University of Alberta.

Our study was published this week in the high-impact journal PLoS ONE. To view maps of where the marshes will be under various scenarios over the next 100 years, visit www.prbo.org/sfbayslr. News coverage from SF Chronicle here. CNR coverage here.

Animal tracking with "Smart Collars"

There is an interesting arcticle in today's New York Times about the use of a new breed of animal tracking collars that use on board computers to track valuable information about an animal, beyond location alone.  The new "smart collars" can be used to track when an animal is sleeping, when it is feeding, and lots of other metrics.  The additional data being gathered gives biologists more information to work with while trying to understand the animals habits and needs, in order to provide informed wildlife management decisons.

Tracking apex marine predator movements in a dynamic ocean

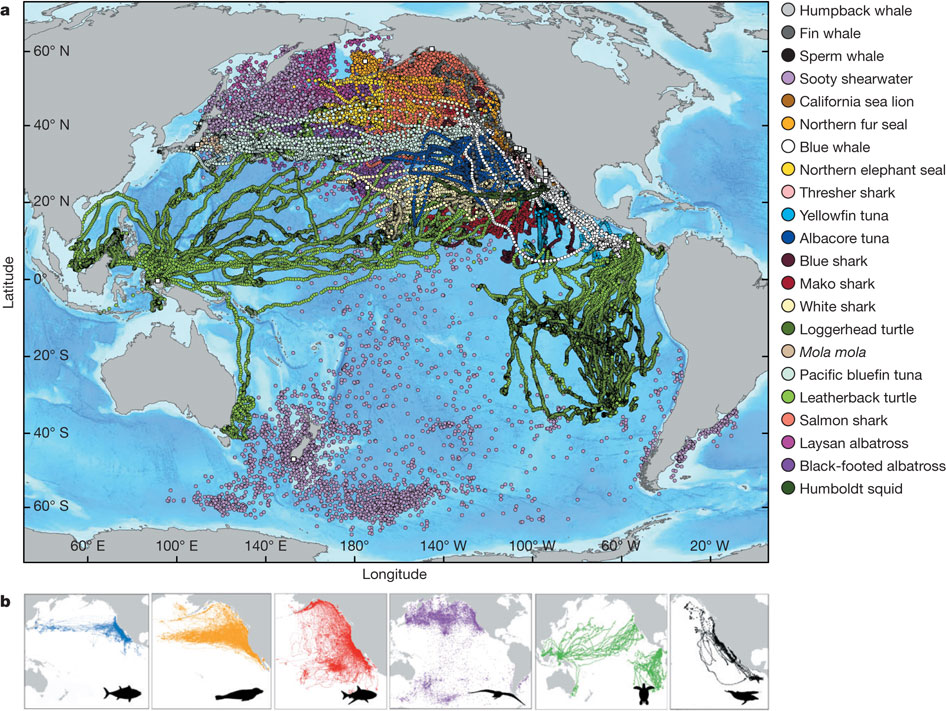
From a new Nature article focusing on the tracking of marin predators in the Pacific. What a cool graphic!

a, Daily mean position estimates (circles) and annual median deployment locations (white squares) of all tagged species. b, Daily mean position estimates of the major TOPP guilds (from left): tunas (yellowfin, bluefin and albacore), pinnipeds (northern elephant seals, California sea lions and northern fur seals), sharks (salmon, white, blue, common thresher and mako), seabirds (Laysan and black-footed albatrosses and sooty shearwaters), sea turtles (leatherback and loggerhead) and cetaceans (blue, fin, sperm and humpback whales).

corridor analysis tools

Alan shared a link with me for Corridor Design. It includes downloads for various GIS Tools, overviews of corridor concepts, and reports on linkage designs. The stated goal is "to transfer everything we've learned about designing wildlife corridors to the general public to facilitate better conservation, science, and dialogue."  Check out the site's blog for info on their latest projects.

Clark Labs teams up with Google.org to develop web based land-cover analysis and REDD tools

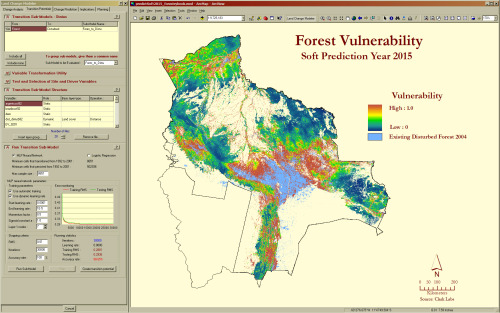
Land Change Modeler for ArcGIS (Image used with permission from Clark Labs)

From Clark Labs news:

Clark Labs recently received a $451,000 grant from the Gordon and Betty Moore Foundation to support the development of land-cover analysis and REDD tools for use on Google's Earth Engine. REDD, Reducing Emissions from Deforestation and Forest Degradation, is a climate change mitigation strategy that offers developing countries incentives to reduce forest carbon emissions. The complex implementation of REDD relies on substantial computing and data resources, and requires significant effort and investment. It is hoped that providing accessible modeling tools with Google’s cloud computing resources and wealth of geospatial data will encourage broader adoption of REDD.

The grant supports the development of a prototype of the land change analysis and prediction tools for Google.org’s Earth Engine platform, a technology in development that enables global-scale monitoring and measurement of changes in the Earth’s forests. It is planned that Google will host the required geospatial data layers to implement a REDD project, including maps of those factors identified as critical causes of deforestation, such as proximity to roads, slopes or distance from existing deforestation.

The new tools in development will guide the user through the steps of baseline development--land change analysis of the reference, project and leakage areas of a project, the identification of the carbon pools and input of carbon density values, and the estimation of emissions for projected dates. This new functionality will also directly produce the multitude of tables and graphics for the carbon accounting reporting requirement of REDD. The preparation costs of REDD will be significantly reduced by the automation provided by these tools.

Clark Labs is based within the Graduate School of Geography at Clark University in Worcester, MA and is the developer of the IDRISI Taiga GIS and Image Processing software and the Land Change Modeler software extension to ArcGIS. To view the full news release click here.
Researching why animals move across the land

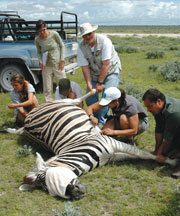
Collaring a zebraA very nice article about Wayne Getz's research in Africa: spatial ecology, epidemiology, conservation and citizen science. From Breakthroughs Magazine

In this article he talks about his evolution as a scientist from mathematician to geo-nerd. The article states: At the core of Getz’s work is how and why animals move across the land. People have sought answers to these questions for time immemorial - at first to improve success in the hunt and harvest, and much later to understand animals in and of themselves. His approach combines a mathematician’s genius for analysis with hands-on wildlife research. This unique perspective is revealing that animal travel patterns can provide a great number of insights into animal behavior, ecology, and epidemiology.

And now the GIS part: In recent years, the advent of global positioning system technologies, coupled with expanded telecommunications networks, have added up to a revolution in animal tracking. The modern version of the radio collar can map an animal’s position to within a couple of meters every few minutes, upload the stored data automatically to a satellite or cell phone network, and allow biologists to track the beast from afar for many weeks. 

Also read about his work in education and social justice in South Africa. Cool stuff. Check it.

Fog in California - it's declining

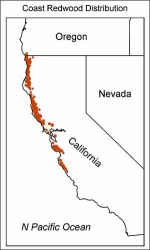
James A. Johnstone and Tod Dawson's recent paper in PNAS show that California's coastal fog has decreased significantly over the past 100 years, potentially endangering coast redwood trees dependent on cool, humid summers. Coast redwoods, Sequoia sempervirens, grow in a narrow coastal band, from Big Sur to Oregon, characterized by cool summer temperatures and high humidity from fog (see map at right from USGS).  They analyzed 20th century climate station records, and have shown that since 1901, the average number of hours of fog along the coast in summer has dropped from 56 percent to 42 percent, which is a loss of about three hours per day. Excerpted here.

CPAD 1.4 drops today! California Protected Areas Database

From GreenInfo Network.  The new California Protected Areas Database (CPAD 1.4) has just been released in geodatabase and shape file formats.  Please visit www.calands.org to download.  Updates and improvements to CPAD are described in the CPAD Manual also available on the CALands web site.

WHAT'S NEW IN CPAD 1.4:  CPAD 1.4 contains a number of important data improvements - more coverage of urban parks, more complete alignment to parcels, broader implementation of management designations, and more.

VIEW CPAD DATA ONLINE, REPORT ISSUES:  For those who do not use GIS or prefer to view CPAD via the web, you can do so though a google map overlay at http://www.calands.org/review.php.  We welcome input from the CPAD user community to keep us informed about errors and updates in CPAD.  Please report errors by clicking on the "Report Error" button.

GET NOTIFIED WHEN CPAD IS UPDATED: We encourage you to receive CPAD updates.  You can do this by clicking on the "Receive Update Notification" link on the calands.org homepage.  We will not distribute any of your information or use your email outside of the CPAD mailing list.  Registering helps us better serve the CPAD user community.

Mapping the arctic tern's amazing pole-to-pole flight

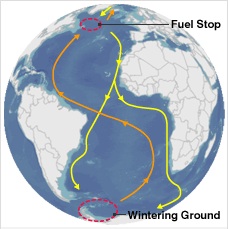
After setting out (yellow line) the birds pause in the North Atlantic (red circle) to feed. Going home (orange line), they follow the winds.We still might not know the air-speed velocity of an unladen swallow, but now we know the daily flight distance (up to 500km!) of the tiny arctic tern. Reported in the BBC.

Starting in August and September, the small (3.5oz) bird will head from Greenland and fly to the Weddell Sea, on the shores of Antarctica. It will spend about four or five months in the deep south before heading back to the far north, arriving home in May or June.

A team from Greenland, Denmark, the US, the UK and Iceland attached small (0.05oz) geolocating archival light loggers to the birds' legs to find out exactly where they went on this polar round trip. The devices do not rely on satellite navigation, but record light intensity.  This gives an estimate of the local day length, and the times of sunrise and sunset; and from this information it is possible to work out a geographical position of the birds. They banded 50 birds in July 2007 in Greenland, and one year later collected the devices from 10 birds (more birds with loggers were seen in the colony, but these could not be recaptured). More on these cool devices here.  More info on these amazing birds here.

A year in the life of the world's precipitation: video

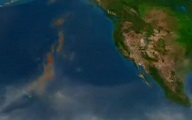
John Chiang gave the geolunch last week, and discussed the possible changes to tropical rainfall in the future. Tropical precipitation is controlled much differently than precipitation at the mid-latitudes.  To illustrate this, at the begining of his talk he showed us this video from UCAR/NCAR visualization team, which is a simluation for one year from the CommunitA snap from the video showing a Pacific storm about to drench Cali.y Climate System Model (CCSM), a coupled climate model for simulating Earth's climate system using the Community Atmosphere Model (CAM), the latest in a series of global atmosphere models developed at NCAR for the weather and climate research communities. Watch storms develop in the mid-latitudes as clear easterly moving systems; in the tropics you have daily convective action governing precipitation. 

Mapping wetlands: the GlobWetland project

A bit late, but a good source of wetland mapping information from the the GlobWetland Symposium: Looking Lake Bogoria in Kenya, Landsatat wetlands from space.  The GlobWetland project was launched in 2003 with the aim of developing and demonstrating earth observation-based information services to support wetland managers and national authorities worldwide in responding to the requirements agreed under the Convention. The project involved 50 different wetlands in 21 countries and relied on the direct collaboration of several regional, national and local conservation authorities and wetland managers. It has now produced a number of standardised information products (e.g. land use and land cover maps, change-detection maps, water cycle regime maps and others) validated over the 50 selected sites by the users themselves, consolidated methods and guidelines for the users to continue the work after the project lifetime.

The GlobWetland Symposium was held in October 2006 in Frascati, Italy to inform the general public and policy makers of the importance of wetlands and to promote their conservation and protection worldwide. The papers in this special issue highlight the major points and recommendations derived from the Symposium while the final conclusions provide a basis for initiating new actions within the ESA in support of the EO requirements of the Ramsar Convention and the wetlands community.

The special issue in Journal of Environmental Management from the conference has many interesting papers on wetlands mapping.

Vast shifts in bird species expected as CA warms: Diana's article

From SF Gate: Because of climate changes in the next few decades, the changes in bird habitats and behavior between now and 2070 will equal the evolutionary and adaptive shifts that normally occur over tens of thousands of years, according to researchers with PRBO, also known as the Point Reyes Bird Observatory.

"What we found is that not only will species shift and communities change, but the composition of communities in certain places will not resemble anything we see today," said Diana Stralberg, a landscape ecologist and the lead author of the report, "Reshuffling of Species With Climate Disruption: A No-Analog Future for California Birds?" published in PLOS.

From the abstract: By facilitating independent shifts in species’ distributions, climate disruption may result in the rapid development of novel species assemblages that challenge the capacity of species to co-exist and adapt. ...Projections of future no-analog communities based on two climate models and two species-distribution-model algorithms indicate that by 2070 over half of California could be occupied by novel assemblages of bird species, implying the potential for dramatic community reshuffling and altered patterns of species interactions. ...Efforts to conserve and manage biodiversity could be substantially improved by considering not just future changes in the distribution of individual species, but including the potential for unprecedented changes in community composition and unanticipated consequences of novel species assemblages.

New Interface for the Manhatta Project. Check it.

We talked about this before here; and the Manhatta project has a nice new interface for exploring the 1609 map of the island of Manhatta(n), block by block, through time.  I love this project! The combination of mashup, history, design and art are breathtaking.  (And our own Tim Bean worked on reconstructing the early topography! - see his comment below.) Go Fullscreen on your 30"-monitor. I dare you.

“The goal of the Mannahatta Project has never been to return Manhattan to its primeval state. The goal of the project is discover something new about a place we all know so well, whether we live in New York or see it on television, and, through that discovery, to alter our way of life. New York does not lack for dystopian visions of the future…. But what is the vision of the future that works? Might it lie in Mannahatta, the green heart of New York, and with a new start to history, a few hours before Hudson arrived that sunny afternoon four hundred years ago?”

- from Mannahatta: A Natural History of New York City

Get those roofs fixed: El Nino is coming!

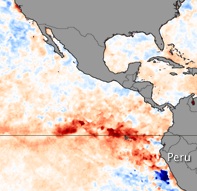
From NASA Image of the Day: In July 2009, the National Oceanic and Atmospheric Administration (NOAA) Climate Prediction Center reported that ocean temperatures in the central and eastern Pacific had shifted into El Niño—anomalously warm—conditions. El Niño conditions are evident in this sea surface temperature anomaly image based on data from the Advanced Microwave Scanning Radiometer for EOS (AMSR-E) on NASA’s Aqua satellite on July 26. THe current data are compared to long-term average temperatures (1985-1997) measured by the Advanced Very High Resolution Radiometers that have flown on several NOAA missions.

In this map, places where temperatures were near normal are cream-colored, places where temperatures were warmer than normal are red, and places where temperatures were cooler than normal are blue. An area of dark red occupies the eastern Pacific off the coast of Peru and Ecaudor (north of Peru), indicating temperatures were much warmer than average. Meanwhile, across the Pacific, ocean temperatures around Indonesia were slightly cooler (light blue) than usual.

Indigenous mapping network at UC Berkeley

Our friends from DataBasin are on campus on Monday. Kai Henifin is a Cultural Ecologist/GIS Analyst with the non-profit organization Conservation Biology Institute, the developers of DataBasin. Kai will be speaking about "Incorporating Indigenous Knowledge to Improve Conservation through Data Sharing" as part of the Berkeley Indigenous Mapping Network. For more info on the event.

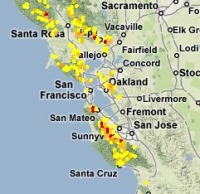
We have some interesting cross-overs with CBI and DataBasin: we added our SOD data to DataBasin recently (see image at left); and CBI have a nice modeling project looking at fisher in the southern Sierra that Reg and Rick are using in their SNAMP work.