New SOD Confirmations Added to OakMapper!

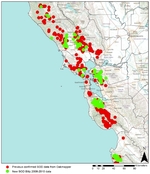
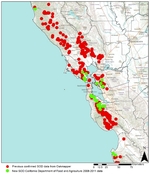
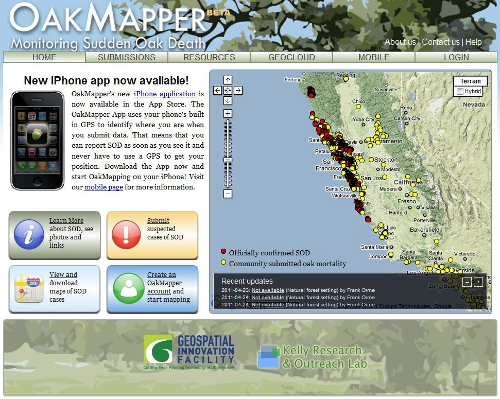
New confirmed cases of Sudden Oak Death (SOD) (P. ramorum) have been added to OakMapper, a project that tracks the spread of Sudden Oak Death from data collected by citizens and organizations. All official SOD cases are collected and confirmed by the California Department of Food and Agriculture or the University of California. Community SOD cases are submitted by citizens via the OakMapper website and iPhone application. 415 new points collected between 2008 and 2011 have been added to OakMapper bringing the total number of confirmed SOD locations to 1570. The new data consists of laboratory confirmed cases collected by the annual SOD Blitz campaigns of 2008-2010 from the Forest Pathology and Mycology Lab run by Dr. Matteo Garbelotto and also data collected by the California Department of Food and Agriculture between 2008 and 2011.

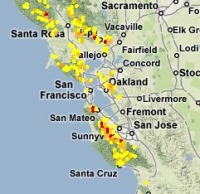
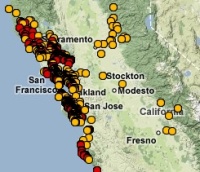
Click on the images below to view close-ups of the new confirmed SOD data (in green) from the SOD Blitz and California Department of Food and Agriculture (CDFA).

New SOD Blitz 08-10 Data

New CDFA 08-11 Data


Explore the new data online here

OakMapper.org

Open Street Map's further integration into commercial mapping products

MapQuest has recently announced the opening of a secondary beta open source mapping website based on the Open Street Maps engine where community members can post and edit map data that will then be integrated into Open Street Maps and MapQuest products. The announcement also indicates MapQuest may in the near future merge this beta open source map portal with their commercial map portal. The integration of community based map editing and open source data in commercial products has started to become a trend in the commercial mapping world. Other commercial map products such as Microsoft Bing and commercial mapping applications such as ESRI ArcGIS 10 base maps already offer Open Street Map as a product to view alongside their propriety map data. Community led commercial map editing is not entirely new as Google and other map services already allow account members to point out errors and make corrections. What is different in the case of MapQuest is the integration of open source data with commercial data. This continues to push the boundaries of community led mapping and the further proliferation of open source data products in the commercial and public spheres.

Read the full article here.

Open MapQuest Beta

Google Earth Engine Debuted at the International Climate Change Conference in Cancun, Mexico

Google.org introduced a new Google Labs product called Google Earth Engine at the International Climate Change Conference in Cancun, Mexico. Google Earth Engine is a new technology platform that puts petabytes of satellite imagery and data from the past 25 years online, many of which have never been seen, much less analyzed. The platform will enable scientists around the world to use Google’s cloud computing infrastructure to implement their applications. For example, creating a detailed forest cover and water map of Mexico, a task that would have taken 3 years on one computer, was accomplished in less than a day.

Google Earth Engine can help scientists track and analyze changes in Earth’s environment  and can be used for a wide range of applications—from mapping and monitoring water resources to ecosystem services to deforestation. The idea is to enable global-scale monitoring and measurement of changes in the earth’s environment by providing scientists a vast new amount of data and powerful computing resources.
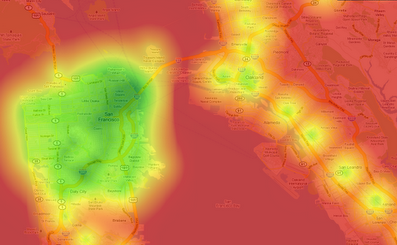
Read more at Introducing Google Earth Engine or watch Google Earth Engine Overview videos.

National Map of Food Deserts

I live in a Low Access Area! According to a new food desert webGIS, my neighobrhood around 58th & Shattuck doesn't have access to a full-service grocery store, has low car ownership, and low median household income. I have never considered my self to live in a food dessert because I go to Berkeley Bowl at least once a week on my bike ride home from campus, but according to these combined metrics I am more underserved by full-service food stores than most other neighborhoods. I think this is a really neat tool to start a broader conversation about how to measure and evaluate food access and what it means for individual and community health.

As Grist writes...."The point of the project isn't just to map food deserts, it's to help TRF and other investors, as well as policymakers, calculate how much money is "leaking" from an area (being spent elsewhere), so as to evaluate whether a loan for a new supermarket is a good idea -- financially, presumably. As Stephanie covered in her piece, food-justice advocates disagree on whether small, independently owned but somewhat limited food stores are the answer, or chain stores such as a Safeway or Walmart.

Alas, the tool does not include data for health care expenditures or obesity rates in these areas, which would be interesting comparisons to see."


Mapping Traffic’s Toll on Wildlife

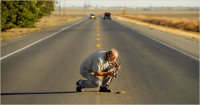
Roadkill and participatory GIS (two of my favorite topics) make it mainstream! A recent article from the New York Times describes a project out of UC Davis using citizen observers to map roadkill.

"Volunteers comb the state’s highways and country roads for dead animals, collecting GPS coordinates, photographs and species information and uploading it to a database and Google map populated with dots representing the kills. The site’s gruesome gallery includes photos of flattened squirrels or squashed skunks."

The project website can be found here: http://www.wildlifecrossing.net/california/

Read the NY times article here.

ArcGIS.com online mapping now available

ESRI has just launched a public beta version of their online mapping service on arcgis.com

At the ArcGIS.com site, you can browse featured ArcGIS Online content such as maps and applications published by ESRI and the ArcGIS community, and add comments and ratings. You can upload and share your own items, either with specific groups that you created or are a member of, or you can share your items publicly. Use the newly designed Web Mapping application to quickly create online mashups that you can also share with others.

The design and interface is nicely done, and includes easy access to many of ESRI's online basemaps.  This site launch coencides with a greatly updated version of ArcGIS Explorer which provides a much improved free GIS viewer, tightly integrated with ArcGIS desktop layers and outputs.


Google Earth Browser Plugin

A union of Google Earth and Google Map took place yesterday (4/26/2010) resulting in Earth view. To be able to see the Earth view, you need to install the Google Earth browser plugin. From the LatLong Blog:

Those of you who aren’t as familiar with Google Earth might be wondering how Earth view differs from the satellite view that’s currently available in Maps. First of all, Earth view offers a true three-dimensional perspective, which lets you experience mountains in full detail, 3D buildings, and first-person dives beneath the ocean. The motion is fluid, and you can see the world from any viewpoint. Because Earth view is built right into Maps, you can switch back to cartographic view simply by clicking on the “Map” button. The view will even adjust automatically to a top-down, north-heading perspective as you transition. In essence, you now have all the best mapping tools at your fingertips, all in one place.

Today we are proud to announce the next major step in the marriage between Google Earth and Google Maps -- Earth view.

The volunteer mappers who helped Haiti

Using an image slideshow, BBC News tells the story of how volunteer mappers used OpenStreetMap, an open source mapping platform, to construct a detailed map of Port au Prince in Haiti with layers of geographic information. The geographic information was accessed and used by the rescue personel on the ground. This short slideshow highlights the importance of PPGIS/webGIS, mobile GIS, open source/platform, crowdsourcing, and public participation in a critical situation like the rescue effort in Haiti.

To view the slideshow, please click here.

Indigenous mapping network at UC Berkeley

Our friends from DataBasin are on campus on Monday. Kai Henifin is a Cultural Ecologist/GIS Analyst with the non-profit organization Conservation Biology Institute, the developers of DataBasin. Kai will be speaking about "Incorporating Indigenous Knowledge to Improve Conservation through Data Sharing" as part of the Berkeley Indigenous Mapping Network. For more info on the event.

We have some interesting cross-overs with CBI and DataBasin: we added our SOD data to DataBasin recently (see image at left); and CBI have a nice modeling project looking at fisher in the southern Sierra that Reg and Rick are using in their SNAMP work.

Maps + Compass

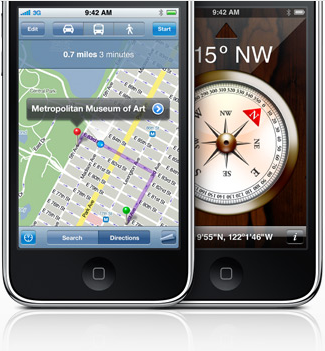
In iPhone OS 3.0, a digital compass will be provisioned, which could potentially add more helpful features to the existing Google Map application. Already, the soon-to-released OakMapper Mobile is taking advantage the open API for Google Map in iPhone SDK 3.0beta to create an application that allow iPhone users to view and report SODs on their iPhones. I believe that the future iteration of the OakMapper Mobile application can take advantage the built-in compass to re-trace the reported SODs.


Tracking people and crime

This article describes how the LAPD online crime map mistakenly geocoded 1,380 crimes to a spot directly in front of the LA Times Office because it was the default location for unmatched geocodes. This mistake then lead to the popular site EveryBlock to rank that ZIP code as one of the most dangerous in the city. Lesson learned: don't believe every dot on a map is the absolute truth.

Another interesting article describes how analysis of an FBI database links long-haul truckers to serial killings. This shows that local data linked together can change the scale of analysis to reveal a "mobile crime scene".

OakMapper 2.0 released

Hi y'all. The new OakMapper 2.0 is up and running, and we'd like your help in mapping areas of oak mortality around the state. Version 2.0 improves upon the website's prior version with increased functionality and additional tools within an easily navigated interface.  Launched by the UC Berkeley Kelly lab in October, OakMapper 2.0 makes it easier for users to explore data, download maps, look at images of oak mortality, and submit suspected locations of oak mortality that may be associated with SOD.  The new interface utilizes the familiar background layers and navigation tools from Google Maps.  Users are able to draw points and polygons directly on the map as well as attach photos to specific points.  The Kelly lab encourages the public to use this site to map suspected cases of SOD and to track their submission by signing up for an account with OakMapper.  Registered users of the site can update their information and make comments on other users' points.  Official confirmations of P. ramorum are clearly separated from community-submitted points and either set of points can be filtered out.The new OakMapper is found at oakmapper.org.  Please consider signing up to be an OakMapper user! The OakMapper was recently featured in the recent journal of the Bay Area Automated Mapping Association

.

State of the GeoWeb

Since Google first presented a snapshot of the geoweb at last year’s Where 2.0, it has considerably evolved: more Geo data is published on the web, KML was accepted as an OGC standard and is adopted by a growing number of tools. Join John Hanke, Director of Google Earth & Maps to hear the latest on the evolution of the Geoweb and Google’s effort to organize it and make it universally accessible and useful. In this video from the O’Reilly 2008 Where 2.0 conference, John Hanke demonstrates the latest in Google geo development with Jack Dangemond of ESRI.