Fire in the Great Dismal Swamp, VI
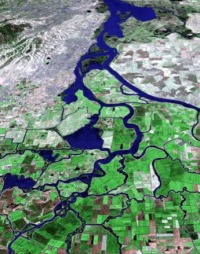
A nice example of remote sensing for fire: this visualization allows you to compare the utility of hyperspectral images to see through the smoke and map fire scars. The article is about a lightning strick fire in the fantastically named "Great Dismal Swamp" in Virginia. Hurricane Irene might put a damper on the fire.

“Eight inches of rain will not put the fire out,” said Tim Craig, Fire Management Officer for the refuge. “It will buy us time to clear our way through the downed trees back to the fire zone after the storm.” Irene generously drenched the swamp with 10 – 15 inches of rain, but initial assessments show that the fire is still burning. Before the storm, the Lateral West fire was 35 percent contained. Smoke still rose from at least 30 acres after the storm though open flames were no longer visible and the fire did not spread under Irene’s strong winds, said local news reports. The sudden flush of rain left puddles that are still soaking in to the soil and may yet help extinguish the fire.

See the interactive tool and article here.

Debris from Japanese tsunami steadily drifting toward California

This item got heavy news rotation this morning: the considerable debris from the tsunami in Japan is out to sea and slowly moving toward Hawaii and the west coast of the US. 

The debris is moving east at roughly 10 miles a day, and is spread over an area about 350 miles wide and 1,300 miles long -- an area roughly the size of California. It should reach beaches and coastal cities in California, Oregon and Washington in 2013 or early 2014. These estimates are from a computer model, the details of which are spotty in the articles I read. Example here from insidebayarea.

Debris movement similation: purple is low density, red is high density of debrisThere is considerable concern about this.  Last Monday, representatives from the Coast Guard, NOAA, the Environmental Protection Agency, the U.S. State Department and other agencies met for the first time in Honolulu to share information about the Japanese debris and begin to chart a strategy.

Among their plans: to notify the U.S. Navy and commercial shipping companies that regularly sail across the Pacific so they can begin to document what is floating. That could lead to expeditions to go map and study it.

Curtis Ebbesmeyer, a Seattle oceanographer who has studied marine debris for more than 20 years (and done some neat work with rubber duckies to map ocean currents) is one of the leads interviewed for the report.


Map of scientific collaboration between researchers

This map of scientific collaboration between researchers by Olivier Beauchesne has a similar look and methodology to the facebook friend maps done by Paul Butler but instead of mapping facebook friendships these maps try to describe the level of scientific collaboration between researchers from 2005 to 2009 using databases of academic paper authorship and author location. From Olivier Beauchesne's blog this is how to interpret it: "For example, if a UCLA researcher published a paper with a colleague at the University of Tokyo, this would create an instance of collaboration between Los Angeles and Tokyo." The brighter the lines, the higher number of collaborations between a pair of locations. Seems to be a lack of data in certain regions.

For more information and to view the maps in hi-res see Olivier's blog post here.


Visualizing slavery from 1860

From the NYT comes a great article about an early map from the US Coast Survey (creators of those lovely coastal charts from the late 19th century that adorn many of my walls) that shows slavery in the southern US, based on the 1860 census. The map used novel cartographic techniques for the day and was a masterful piece of public outreach: it was important in convincing the Union public that the civil war was about slavery, and not just state's rights. Map here.

From the article: 

The 1860 Census was the last time the federal government took a count of the South’s vast slave population. Several months later, the United States Coast Survey—arguably the most important scientific agency in the nation at the time—issued two maps of slavery that drew on the Census data, the first of Virginia and the second of Southern states as a whole. Though many Americans knew that dependence on slave labor varied throughout the South, these maps uniquely captured the complexity of the institution and struck a chord with a public hungry for information about the rebellion.

The map uses what was then a new technique in statistical cartography: Each county not only displays its slave population numerically, but is shaded (the darker the shading, the higher the number of slaves) to visualize the concentration of slavery across the region (legend at left). The counties along the Mississippi River and in coastal South Carolina are almost black, while Kentucky and the Appalachians are nearly white.

Mapping science and the city - from Nature

Suggested by Tim. Nature has a nice viz on where science happens, in terms of cities, and how publication output interacts with publication impact. Their analysis - provided to Nature by Elsevier - of Scopus data shows how absolute counts of publications per city and relative citation impact have changed from 2000 to 2008. The interactive graphics supplement the news feature 'Building the best cities for science' part of Nature's special package on Science and the city. Berkeley does quite well, by the way. Go Bears!

They also have the same information as a google earth viz. Very cool.

William Bowen: 3 new aerial flights of the Sierra Nevada


William Bowen has produced some new lovely high res aerial flyovers (some with what he describes as "choppy and unscripted" - but very informative - narration). At left, one of his great images of the Delta from the California Atlas of Panoramic Images.


Three new silent movies focusing on the High Sierra:

Examples with narration:

Flow Map Layout

Several researchers at Stanford have written some software for visualizing flow maps. There pictures are very pretty, and, I think, good data vis. The map above shows the top ten states providing migrants to NY and CA. Here's their abstract:

Cartographers have long used flow maps to show the movement of objects from one location to another, such as the number of people in a migration, the amount of goods being traded, or the number of packets in a network. The advantage of flow maps is that they reduce visual clutter by merging edges. Most flow maps are drawn by hand and there are few computer algorithms available. We present a method for generating flow maps using hierarchical clustering given a set of nodes, positions, and flow data between the nodes. Our techniques are inspired by graph layout algorithms that minimize edge crossings and distort node positions while maintaining their relative position to one another. We demonstrate our technique by producing flow maps for network traffic, census data, and trade data.