NASA challenge announced: Open NASA Earth Exchange 2014

President Obama has announced a series of executive actions to reduce carbon pollution and promote sound science to understand and manage climate impacts for the U.S. 

Following the President’s call for developing tools for climate resilience, NEX is hosting a workshop that will feature:
  1. Climate science through lectures by experts;
  2. Computational tools through virtual labs; and
  3. A challenge inviting participants to compete for prizes by designing and implementing solutions for climate resilience.

An particularly exciting part of this initiative is the possibility to win cash prizes for innovative research ideas. You can find more information about labs and lectures here at https://nex.nasa.gov/opennex
and to participate in the challenge, you can go directly at https://www.innocentive.com/ar/challenge/9933584.

Pay attention! Especially grad students and young researchers! The first part of the challenge is the ideation challenge which will close on the 31st of July, 2014 and will follow up with another solvers challenge based on the ideas as selected form the ideation challenge. This will run through October so ample time to participate and win prizes.

Job Opening: Executive Director at the GIF

The Geospatial Innovation Facility at the University of California, Berkeley is recruiting for an Executive Director (Academic Coordinator).  The mission of The Geospatial Innovation Facility (GIF) http://gif.berkeley.edu is to help people better understand the complex challenges facing our changing world through the acquisition, analysis and visualization of spatial data. We strive to fulfill our mission by developing engaging applications that leverage and build upon state-of-the-art geospatial and web technologies, and by providing opportunities for new researchers to learn how they can use spatial data to answer critical questions.

Responsibilities include managing the facility’s budget, spending, and new business development; delivering workshops and training; supervising a talented team of web application developer and IT staff; and managing projects, including Cal-Adapt, LandCarbon, and the Berkeley Ecoinformatics Engine; developing future vision and work plans and reports to the faculty advisory board and external oversight committee; and promoting the adoption of geospatial technology on campus.

The minimum requirement to be considered an applicant is an advanced degree in a related field by the time of application. Preferred qualifications include advanced understanding of geospatial technology and Open Source GIS and webGIS programming; excellent commination skills; experience in grant writing, fundraising, and managing large budgets; and strong leadership skills associated with project management.

Salary range is $75,000 – $95,000/annually, depending on prior experience and qualifications. Generous benefits are included (http://hrweb.berkeley.edu/benefits).

For more information about the position, including required qualifications and application materials, go to https://aprecruit.berkeley.edu/apply/JPF00460. The deadline to apply is July 31, 2014.For questions, please contact Ruxin Liu at ruxinl@berkeley.edu.  UC Berkeley is an Equal Opportunity/Affirmative Action Employer.

A nice blast from the past: the map that started it all, from Tim

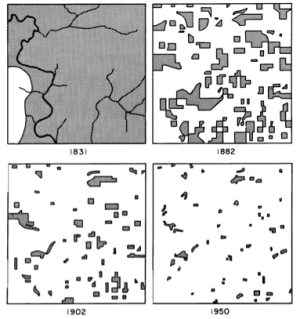
Forest cover in Cadiz Township, Wisconsin: 1831, 1882, 1902, 1950It is graduation season around Berkeley, which means some time to look forward to the future, and take stock of the past. For me, taking stock of the past happened unexpectedly today when, in cleaning up my desk, I found a print-out of one of Tim De Chant's earlier blog posts from Per Square Mile entitled "The map that started it all" about his early fascination with this map, from John T. Curtis, published in Man's Role in Changing the Face of the Earth. Tim is now senior digital editor at NOVA and editor of NOVA Next, which is very cool.

Tim describes the map documenting a transition from a wild Wisconsin dominated by a deciduous forest to a landscape in which the remaining woodlots are barely visible. This was proto-GIS, as Curtis recreated the scenes from survey data and his own observations, painstakingly piecing together handwritten records of the six-by-six mile township.

This is such a nice entry, and reminds me of many things: past students now gone on to great things, past times reading Man's Role in Changing the Face of the Earth in the 1980s in McCone Hall for an exam in Hooson's class, and my own nascent interest in all things landscape palimpsesty and patterny.

Here is my copy (at right) of the venerable tome, Volume 2, complete with its ridiculous price tag: $6.95! 

I've always been in love with maps, and am fortunate now that my career allows me to learn about them and their uses daily.  Thanks Tim for the reminder!

1966 Lunar Orbiter 1 Images of Earth Recovered

comparison of the original Earthrise image as seen by the public in 1966 and the restored image released in 2008Interesting article from Wired on the recovery of forgotten images from the 1966 Lunar Orbiter 1 mission. The images were taken from a probe orbiting the moon and contain images of the surface of the moon and distant Earth including the first high resolution photographs ever taken from behind the lunar horizon of an Earthrise. The images were recovered from analog data tapes at NASA Ames and have not been seen publicly since the original data from the mission was received in the late 1960s and never at such high resolution. The historical images of Earth are now being used to fill in gaps about Earth's climate in the 1960s. For the full story click here.

Cropland Data Layer (CDL) and National Land Cover Dataset (NLCD): new versions released this year

Both the NASS Cropland Data Layer (CDL) and the National Land Cover Dataset (NLCD) released new versions in early 2014. Links for download are here:

NLCD released and webinar April 15 2014

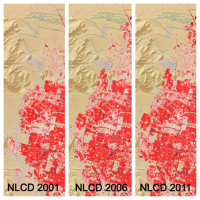
These three panels of cyclical data (2001, 2006, 2011) from the National Land Cover Database depict intervals of land cover change in the vicinity of Spring Valley, a suburb of Las Vegas, NV.[Source: USGS] Just released, the latest edition of the nation’s most comprehensive look at land-surface conditions from coast to coast shows the extent of land cover types from forests to urban areas. The National Land Cover Database (NLCD 2011) is made available to the public by the U.S. Geological Survey and partners.

Dividing the lower 48 states into 9 billion geographic cells, the massive database provides consistent information about land conditions at regional to nationwide scales. Collected in repeated five-year cycles, NLCD data is used by resource managers and decision-makers to conduct ecosystem studies, determine spatial patterns of biodiversity, trace indications of climate change, and develop best practices in land management.

Based on Landsat satellite imagery taken in 2011, NLCD 2011 describes the land cover of each 30-meter cell of land in the conterminous United States and identifies which ones have changed since the year 2006. Nearly six such cells — each 98 feet long and wide — would fit on a football field. Land cover is broadly defined as the biophysical pattern of natural vegetation, agriculture, and urban areas. It is shaped by both natural processes and human influences. NLCD 2011 updates the previous database version, NLCD 2006.

Webinar about the release will be Tuesday, April 15, 2014, 2:00 PM Eastern Time: "New Version of the National Land Cover Database - April 4, 2014 Release”

The latest version of the National Land Cover Database (NLCD) for the conterminous United States will be publicly released on April 4, 2014.  NLCD 2011 is the most up-to-date and extensive iteration of the National Land Cover Database, the definitive Landsat-based, 30-meter resolution land cover database for the Nation.  NLCD 2011 products are completely integrated with those of previous versions (2001, 2006), providing a 10-year record of change for the Nation.  Products include 16 classes of land cover, the percent of imperviousness in urban areas, and the percent of tree canopy cover. NLCD is constructed by the 10-member federal interagency Multi-Resolution Land Characteristics (MRLC) Consortium.   This seminar will highlight the new features of NLCD 2011 and the related applicationsCollin Homer, 605-594-2714, homer@usgs.gov)
For more information and to download NLCD data, visit http://www.mrlc.gov/.
Please click the following link to join the webinar:
 https://usgs.webex.com/usgs/j.php?ED=279876177&UID=490357047&RT=MiM3

At start time of the webinar, each location must call one of the dial-in numbers:
From the National Center in Reston, dial internally x4848
From all other USGS/DOI locations, dial 703-648-4848
From non DOI locations, dial toll free 855-547-8255
After the voice prompt, please enter the Conference Security Code 73848024 followed by the # key. You will hear a tone confirming that you have successfully joined the conference call. If you weren't successful, you will hear another voice prompt with instructions.

Sierra Nevada Decision Support System

Former student and GIS expert Chippie Kislik alerted me to this video. She is working with others at NASA Ames on a Sierra Nevada DSS Ecological Forecasting Project. A video about the project is here.

The Sierra Nevada contains vital ecosystems that are experiencing changes in hydrologic regimes, such as decreases in snowmelt and peak runoff, which affect forest health and water resources. Currently, the U.S. Forest Service Region 5 office is undergoing Forest Plan revisions to integrate climate-change impacts into mitigation and adaptation strategies. However, there are few tools in place to conduct quantitative assessments of forest and surface conditions in relation to mountain hydrology, while easily and effectively delivering that information to forest managers. To assist the Forest Service, this research team created a Decision Support System (DSS) featuring data integration, data viewing, reporting, and forecasting of ecological conditions within all Sierra Nevada intersecting watersheds.

White House Launches new Climate Data Initiative...

We are in the lovely "Indian Treaty" room.And we were there! Kevin and I went to the White House (here is photographic proof) to represent Cal-Adapt.

The President’s Climate Data Initiative was launched March 19th with the tagline: Empowering America’s Communities to Prepare for the Effects of Climate Change. The initiative is a complex partnership of government, industry, academia and local public to get the US ready for climate change. The overall goal of the climate data initiative is "Spark Innovation": release data, articulate challenges, turn data scientists loose. Here is the fact sheet and a blog post from John Podesta and John Holdren.

We saw some very interesting short talks from a range of speakers. Here are some highlights:

Jack Dangermond highlighted the many initiatives that ESRI is pushing to help with climate resilience. Kathyrn Sullivan from NOAA discussed her concept of "Environmental Intelligence", which describes the use of data to create resilience. She says: "NOAA capture 20TB daily, they release 2TB daily. Upon that data stream are built all the climate businesses we have today. What would this industry be like if we release the other 18TB?" Ellen Stofan from NASA talked about new earth observation missions, including satellites for precipitation, soil moisture, CO2, winds, aerosols. She announced another of a series of data driven challenges called "coastal inundation in your community". Rachel Kyte from the World Bank called their multiple initiatives "Open Data for Resilience". She said that climate change may eradicate the mission of the World Bank, because of its disproportionate impact on poorer communities worldwide. Rebecca More from Google gave us a fantastic overview of the Landsat, climate and topography missions that Google Earth Engine is working on. Google is contributing 1PT cloud storage, and 50 million CPU hours of collaboration.

Videos:

All was very inspiring and informative.

Here are some press links about the Initiative:

Important proposed legislation limiting UAVs: consider reading this and commenting

AB1327 is a bill that could potentially impact the work that we do in regards to remote sensing and aerial imagery collection, etc… in the near future. See the link below for more detail. The office of the California CIO, Scott Gregory, is in the process of providing the Legislature a summary analysis of the bill. In our analysis we want to highlight civilian use (non-public safety governmental) cases for UAV technology as a rebuttal to some of the limiting language in the bill.

The bill would generally prohibit public agencies from using unmanned aircraft systems, or contracting for the use of unmanned aircraft systems, as defined, with certain exceptions applicable to law enforcement agencies and in certain other cases. The bill would require reasonable public notice to be provided by public agencies intending to deploy unmanned aircraft systems, as specified. The bill would require images, footage, or data obtained through the use of an unmanned aircraft system under these provisions to be permanently destroyed within 6 months, except as specified.

http://leginfo.legislature.ca.gov/faces/billNavClient.xhtml?bill_id=201320140AB1327
 
If this bill will affect your organization’s future data collection needs, please provide them a brief summary to be incorporated into the analysis.

Here is what I have sent to Scott Gregory:

Maggi Kelly

Department of Environmental Sciences, Policy and Management

UC Berkeley

The use of civilian accessed UAV technology is commonly used for research purposes to aquire imagery at critical times over inaccessible field sites such as wetlands and forests, or over agricultural fields throught the growing season. This remote data acquisition using UAVs has several advantages: 1) it limits damage of the site, 2) it allows for mutliple returns in a cost-effective way, and 3) it allows for important very high resolution imagery to be collected. Here is a paper where we perfected techniques to find weeds in an agricultural field using UAV imagery. http://www.plosone.org/article/info%3Adoi%2F10.1371%2Fjournal.pone.0077151

Basically, they are looking for the organization name, use case and description of that use case. Please circulate to the user community within your respective organizations to solicit feedback. Please email or call if you have any questions. He would like to have these complied by 10am Friday (3/14/14).

Email: Scott Gregory Scott.Gregory@state.ca.gov

Thanks for your help.

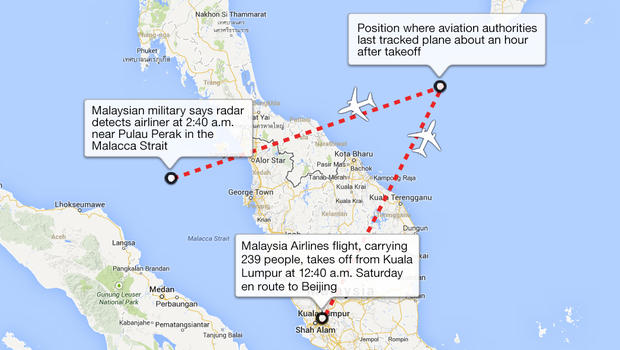
DigitalGlobe Crowdsourcing effort to find missing Malaysian Airlines plane

Digital Globe is enlisitng a crowdsourcing effort to scan through thousands of satellite images and tag potential sitings of the Malaysian Aircraft that went missing this weekend.

The crowdsourcing platform Tomnod, was launched on Monday afternoon and recieved 60,000 page views in the first hour depolying arguably one of the most responsive and comprehensive search missions aided by crowdsourcing and satellite imagery. 

Read more about this here and here and join the effort here

SNAMP participation: in person and online

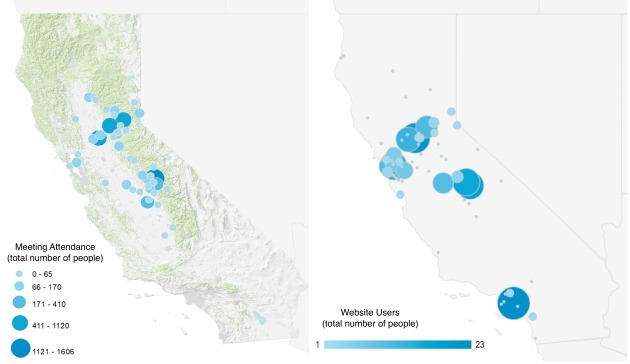
We are starting to do some retrospectives of the SNAMP program. Just to get going, here are our participants visualized from two different angles: in person and online. The in person numbers (left) come from meeting attendance from the project; the online numbers (right) come from the previous year's hits from Google Analytics.


The meeting attendance is far greater, but we get more of the southern California audience from the website.

Berkeley Food Institute's new grants announced

The new Berkeley Food Institute has released its crop of funded projects from its first seed grant program. Our project Making the Road by Mapping: Informing Food System Transformation through Participatory Mapmaking was selected for seed funding. This project, led by Kathryn DeMaster includes graduate students Adam Calo (ESPM) and Sarah Van Wart (Information), Darin Jensen (Geography), Tapan Parikh (Information), Kaley Grimland-Mendoza (Agriculture and Land-Based Training Association), Amber Sciligo (Post-doc, ESPM), Christy Getz (ESPM), and Jennifer Sowerwine (Jepson Herbaria). We look forward to digging in.

Our participatory mapping research project has four primary purposes: First, we explore participatory mapping as a way to collaboratively generate new food system knowledge with scholars, practitioners, and producers. Second, through a process we term “communitysourcing,” we aim to illuminate overlooked caches of community-based knowledge and engage community members, agricultural producers and scholars in collaborative efforts to map a particular food system supply chain (small-scale organic strawberry production in the Salinas Valley). Third, we aim to integrate the interdisciplinary community-based participatory research with specific understandings of the way that certain agricultural policies either facilitate or restrict sustainable small-scale organic strawberry production in the Salinas Valley (with a particular focus on water quality and food safety policy/regulations). Fourth, we will present our findings in novel, innovative, and visually captivating ways that will: (a) Inform specific policies/regulations and; (b) Provide small-scale producers with easily accessible caches of community generated knowledge to inform their practices.

http://berkeleyfoodinstitute.org/current-research/

Happy Valentine's Day Landsat 8!

It's meta-gorgeous, and better than spy vs spy: Landsat 8 catches a glimpse of its older, retired uncle Landsat 5. From NASA:

Feb 14, 2014 • Eight months ago, on June 5, 2013, the U.S. Geological Survey decommissioned the venerable Landsat 5 satellite. That day, the USGS Landsat Flight Operations Team transmitted the last command to Landsat 5, effectively terminating the mission and leaving it in a disposal orbit.

This week, Landsat 8 overflew the defunct Landsat 5, and thanks to some clever work by Mike Gartley, a Research Scientist with the Digital Imaging and Remote Sensing group at Rochester Institute of Technology (RIT)—a group that has long participated in Landsat calibration and validation—Landsat 5 was seen in an image taken by Landsat 8.

In these images, the satellite is seen as a streak of pixels (dark or light depending on the spectral band). There is one image from each of Landsat 8′s OLI bands, except for Band 7, or SWIR-2, where she blended into the clouds and was impossible to distinguish. In these images Landsat 5 is much closer to Landsat 8 than she is to the Earth. More here.

Clark Labs to Create Cloud-based Land Change Modeler for ArcGIS

Clark Labs was awarded a million dollar grant from Esri to create a cloud-based version of their Land Change Modeler for ArcGIS. Land Change Modeler is suite of tools to assess and predict land change and evaluate the impacts of change and includes REDD (Reducing Emissions from Deforestation and Forest Degradation) tools for modeling the impact of land cover change on carbon emissions. Currently Land Change Modeler is only available in IDRISI and as a software extension for ArcGIS (the latest version is compatible with v10.2). This will make this tool more easily assessable to the wider public and scientific community.

From Clark Labs press release:

"Clark Labs was recently awarded a million dollar grant from Esri to create a cloud-based version of their Land Change Modeler for ArcGIS. Currently, Clark Labs’ extension is for the ArcGIS desktop.

Land Change Modeler for ArcGIS, first released in 2007 with Version 2 released this past month, is a software extension for ArcGIS users, offering a suite of tools to assess and predict land change and evaluate the impacts of such change. Clark Labs recent release includes many significant enhancements. The new version is compatible with ArcGIS Version 10.2

The Land Change Modeler offers an extensive suite of tools for land change research in a simple and automated workflow. It provides a variety of tools for land change analysis and prediction, as well as the impacts of those changes.

The new version release of this fall provides significant enhancements, particularly for its utility for REDD (Reducing Emissions from Deforestation and Forest Degradation). Land Change Modeler now includes functionality for modeling the impact of land cover change on carbon emissions. “Our world is changing rapidly, and technology to efficiently model and predict future land change is vital to addressing global challenges,’ said Jack Dangermond, Esri President. “We’re pleased to award this grant to Clark Labs to jumpstart their effort to utilize and provide rich content through ArcGIS Online.”

The new version also provides more capability for estimating land change impacts on habitat and biodiversity. With the grant from Esri, Clark Labs will be creating a cloud-based implementation of Land Change Modeler for their platform.

Clark Labs and Esri have been business partners for nearly ten years, working collaboratively on GIS research."

For the full news release see here.

Musings about Robert N. Colwell

I am working on a retrospective of remote sensing of forests in California for the centennial. I am trying to highlight some of the pioneering work done by remote sensors that focused on Californian forests from the 1960s through the use of lidar today.

Oblique aerial view of Berkeley Campus of University of California taken with Camouflage Detection film. Robert N. Colwell

Of course with this topic you must begin with Robert N. Colwell. Dr. Colwell was an internationally renowned remote sensing scientist; he was former associate director of the Space Sciences Laboratory at the UC Berkeley, and he was the instructor of remote sensing in our own Mulford Hall from 1947 until his retirement in 1983. He was NASA co-investigator for Apollo IX, and his research in the 1960s on reflectance and multispectral reconnaissance were the primary basis for selecting the type of sensors and the spectral bands implemented in Landsat. Neat guy, and we all benefit from his intellectual legacy.

Anyway, for this paper, I am going through some of his work as he transitioned from aerial photography to digital imaging, and I came across this picture. Mulford is just off the scene in the upper left corner, and Hearst Gym pool is visible in lower part. In his caption he says:

"Oblique aerial view of Berkeley Campus of University of California taken with Camouflage Detection film." (That is what they used to call color infrared.) "Such photography is superior to any other for certain photo interpretation purposes as indicated by some of the preceding examples. Note in this photo how color values for each species of tree tend to remain uniform from foreground to background because of the superior haze penetration offered by this film. The relatively long wavelengths to which this infrared-sensitive film reacts are scattered but very little by atmospheric haze particles, thus accounting for the uniform color values and for excellent image sharpness." I dig this part: "The original color transparencies have the same color values as seen here and consequently make very attractive panels for lamp shades, although certain of their colors fade upon prolonged exposure to light."

The trend for using map products as kitchy home decorations PRE-DATES 1970! Take that hipsters!

Article source: Colwell, R.N. 1964. Aerial photography - A valuable sensor for the scientist. American Scientist, Vol. 52, No. 1 (MARCH 1964), pp. 16-49

Some more about him here: http://senate.universityofcalifornia.edu/inmemoriam/robertcolwell.htm

Predatory open access journal wrap-up spring 2014

There has been a trend toward open access publishing that has been strengthened recently with a number of coincident efforts, for example Randy Scheckman's Nobel Prize talk, and the UC's Open Access policy for example. Some journals are opening up an open access component to their publishing - Remote Sensing of Environment for example now has an open access model as well as subscription model, and some new completely open access journals are coming on line. The open access model means the author pays the publisher for the costs of putting out an article, instead of the publisher charging universities subscription fees to allow access to the journal.

Open access publishing is a great idea, whose time is ripe: publically funded research should be easily assessed by the public; in general the cost of publishing an open access journal is less than that of a regular article. But the rush to open has opened the window to fraudulent enterprises out to make a fast buck. Thus the landscape of open access publishing is often confusing, and there have been a number of great discussion about how to navigate the stormy waters of open access. Here is my wrap up of some of the informative posts out there:

Other notes pointed out in the Nature article:

  • PLOS ONE, which charges a fee of $1,350 for authors in middle- and high-income countries (UC Berkeley gets a slight price cut), has seen the number of articles it publishes leap from 138 in 2006 to 23,464 last year, making it the world's largest scientific journal.
  • In the past year, the UK and US governments, as well as the European Commission, have thrown their weight behind some form of open-access publishing.

2014 Western Section of the Wildlife Society Meeting wrap-up

I recently attended the 2014 annual meeting of the Western Section of the Wildlife Society in Reno CA. The focus of the conference was on harnessing citizen science toward greater conservation.

I saw some interesting talks in my session (I was clearly the odd-talk-out in a session dominated by animal tracking (I spoke about our SNAMP website evaluation)). For example:

  • Peter Bloom discussed red-tailed hawk movements from banded bird recovery. The birds are banded as juveniles and observed by citizens and scientists. In this way their movements can be mapped: across southern California, across the Pacific flyway, and across the US.
  • Joe Burnett presented on the use of GSM transmitters to track California condor (the largest flying bird in north America) movement patterns. He caught us up on condor recovery and current threats (lead poisoning from foraging on wild game) to condors. He showed some very nice visualizations of wild condor flights between Ventana and the Pinnacles (including some stops for water and dead animal chomping) from the GSM transmitters and Google Earth. 
  • Shannon Rich looked at migration patterns of flammulated owls using light-level geolocators. "What is a flammulated owl”? you say: I will tell you. They are super cute tiny owls, with neat flame-like markings on their face and body. Geolocators are small (~1g) that record ambient light levels during the day, and from timing of sunrise and sunset, you can get latitude and longitude. These are not sending out signals, and you need to recapture the owl to download data. As always, I am stunned by the dedication and time it takes for wildlife biologists to gather their careful data on animal movement.
  • Russ Bryant talked about native honeybee habitat in North Dakota. He talked about the important services that bees give us: 95 agricultural plants benefit from pollination services (estimated at $15b). I did not know that ND is the top honey producer in the US. Colony collapse across the US has been profound. They used INVEST to explore the role of land cover and bee pollination to produce a pollinator habitat index, and a habitat connectivity for areas where bees had been captured. 

In the climate change session, I heard from a range of speakers on practical adaptation strategies, curriculum for climate change education (Whitney Albright), new tools and reports for grassland bird species conservation (Ryan Diguadio), landscape-scale conservation planning for bobcats in the San Diego area (Megan Jennings), and some neat genetics of the SF Bay’s salt marsh harvest mouse (Mark Statham). Also, Curtis Alling talked about local, regional and state climate preparedness planning, and dedicated a slide to cal-adapt.org. Nice!

I also got to catch up briefly with ESPM grads Sarah Sawyer who is now at the Forest Service and Tim Bean, who is thriving at HSU. Alice, he suggested a trip up to Redwood State Park to check out the dark figure of crime in the tall trees.