Where is the best source for NAIP information for California?

How many times has NAIP been acquired for California? 
According to DFG, we have:

  • NAIP 2014 aerial imagery, 1 m, 4 variations (natural color, 4-band, CIR/false color, NDVI)
  • NAIP 2012 aerial imagery, 1 m, 4 variations (natural color, 4-band, CIR/false color, NDVI) 
  • NAIP 2010 aerial imagery, 1 m, 4 variations (natural color, 4-band, CIR/false color, NDVI) 
  • NAIP 2009 aerial imagery, 1 m, 4 variations (natural color, 4-band, CIR/false color, NDVI) 
  • NAIP 2005 aerial imagery, 1 m (natural color)

I was not aware the flight schedule was this frequent. 

Still, I can't find a definitive information source that helps. 

GIS-related courses for Spring 2016

Hello World!

There are several GIS classes to chose from in the spring. So far we have: 

Lower division:

  • ESPM 72 Geographic Information Systems *Not sure who is teaching this yet*

Upper division:

  • Biging, G & Radke, J ESPM 177 GIS and Environmental Spatial Data Analysis
  • Chambers, J    GEOG 185    Earth System Remote Sensing   
  • O'Sullivan, D   GEOG 187 Geographic Information Analysis

Graduate:

  • Radke, J    LDARC 221    Quantitative Methods in Environmental Planning
  • Dronova, I LDARC 221 Applied Remote Sensing
  • Chambers, J GEOG 285 Topics in Earth System Remote Sensing
  • Wang, I   ESPM 290 Special Topics in Environmental Science: Spatial Ecology

Email me with others. 
Thanks!

rOpenSci- new R package to search biodiversity data

Awesome new (ish?) R package from the gang over at rOpenSci 

Tired of searching biodiversity occurance data through individual platforms? The "spocc" package comes to your rescue and allows for a streamlined workflow in the collection and mapping of species occurrence data from range of sites including: GBIF, iNaturalist, Ecoengine, AntWeb, eBird, and USGS's BISON.

There is a caveat however, since the sites use alot of the same repositories the authors of the package caution to check for dulicates. Regardless what a great way to simplify your workflow!

Find the package from CRAN: install.packages("spocc") and read more about it here!

RUCS Rural Urban Connections Strategy

What started as a realtively small project in the Sacramento area to understand the rural agricultural sector has quickly transitioned into a project that hopes to have statewide impact. The premise of the project began with the ideas that planning maps and county data were unrepresentative of rural agricultural areas which in maps were shown as a single color, "green".  Using pesticide report data and remote sensing imagery the project was able to assemble a much more vibrant and representative map that now serves as the backbone of their models. 


This project called Rural-Urban Connections Strategy or RUCS for short made a huge impact on how the city council and politicans were veiwing the agricultural sector. Once the data was collected the folks at RUCS created an econometrics model to understanding the needs and costs of changing agricultural production across the area. See more about the model they employed here  and more information on their approach here

Using the methodology and tools below understanding the rural and urban connections of agricultural will become transferable and scalable so any local, regional, state or federal organization may adapt them.

1. SACOG created a CROP MAP that details agriculture production at the field level across more than 2 million acres of farmland. 

2. Building on the crop map, the ECONOMETRIC MODEL tests how cropping patterns could change under different conditions such as changes input costs.

3 The DIET/LAND NEEDS MODEL estimates how much land is needed to meet demand for locally grown food. 

4 The I-PLACE3S web-based land use modeling tool facilitates land use planning for agriculture and ruralcommunities. .

5 The INFRASTRUCTURE/FISCAL MODEL (IMPACS) provides local governments a means of evaluating the fiscal challenges and opportunities of providing infrastructure and services in their communities. 

Now the questions is how and where to scale RUCS up to a statewide assessment tool. More to come in furture conversations with the folks over at RUCS

Other helpful links from our discussion

GIF+CartoDB workshop coming up! Oct 2

Free Workshop: Intro to CartoDB for Online Mapping

Andy Eschbacher, Map Scientist with CartoDB, will visit the GIF to teach this special hands-on workshop.CartoDB.com is a versatile cloud-powered spatial database, mapping, analysis and visualization engine that facilitates the process of building spatial applications for both web and mobile devices. The platform is currently used by major news organizations, research institutions, non-profits and geospatial application developers. This hands-on workshop will provide an introduction to managing, creating and analyzing spatial data and creating interactive map visualizations for the web, using the CartoDB platform.

If you are interested, you need to register here

International Map Year

Did you know that it is International Map Year? 2015-2016.  

The International Map Year (IMY) is a worldwide celebration of maps and their unique role in our world. Supported by the United Nations, IMY provides opportunities to demonstrate, follow, and get involved in the art, science and technology of making and using maps and geographic information.

http://mapyear.org/about-international-map-year/

Think about ways in which maps can be integrated into your work!

False precision in the English Lidar release

Great commentary from Martin Isenburgon of LASTools fame on releasing data with false precision. This deals with the new open data release by the Environment Agency in England. So far LiDAR-derived DTM and DSM rasters have been released for 72% of the entire English territory at horizontal resolutions of 50 cm, 1 m, and 2 m. They can be downloaded here. The rasters are distributed as zipped archives of tiles in textual ASC format (*.asc). 

Martin gives us a cautionary tale on how not to release national data. It is not the ASC format that he has problems with, but the vertical precision. He says:

"The vertical resolution ranges from femtometers to attometers. This means that the ASCII numbers that specify the elevation for each grid cell are written down with 15 to 17 digits after the decimal point."

Example heights might be something like: 79.9499969482421875 or 80.23999786376953125. These data should be resolved to about the cm, not attometer, whatever that is. Crazy man!

Read the full post: http://rapidlasso.com/2015/09/02/england-releases-national-lidar-dem-with-insane-vertical-resolution/

Data Visualization of WWII

Here in the Kelly Lab we talk a lot about effective ways to visualize data.  How do we show the true weight and impact of those data we work with?  How do we communicate uncertainty?  I think this fellow Neil Halloran did a pretty great job with WWII.  This short video is a combination of visualization and narration.  While effective visualization on its own is ideal, I think the narration offers different avenues of talking about uncertainty in the data.  Check out his video HERE.

Google Earth Engine @ the GIF!

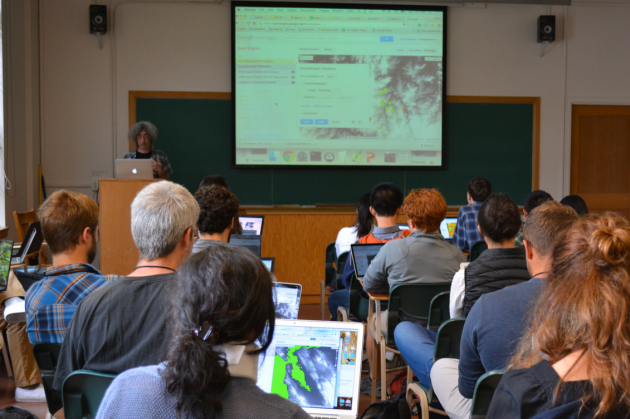
Students, researchers, mappers, and big data enthusiasts took place in an exciting 2 day Google Earth Engine workshop this last week hosted by the GIF and the Google Earth Engine Team. We had an exiting overview of the latest and greatest research adventures from Google by Kelly lab alum Karin Tuxen-Bettman including advances in some of what Google Earth Outreach team is involved in...

As well as new/upcoming ventures

The Earth Engine team led some great tutorials getting people well versed in JavaScript and using the Earth Engine playground, and Earth Engine API. Having beginner and advanced workshop tracks during the two day event allowed for both broad and deep participation from researchers across the Berkeley campus. Take a look at the packed agenda and more

here!

We also had a stellar panel of UC Berkeley professor Jeff Chambers and graduate students Sophie Taddeo, Alexander Bryk, and Lisa Kelley who shared an intimate view of how they were using Earth Engine in their research. The panel shared stories of using Earth Engine to evaluate disturbance in tropical forests, map the movement of wetlands, and meandering rivers, as well as looking at agroforestry systems in Indonesia through a socio-ecological lens.

Thanks to Google and the Earth Engine Team for guiding, the GIF for hosting, and all of the participants for engaging in an action packed two days!

Google @ the GIF: Geospatial Technology Workshop

August 20 & 21, 2015

Geospatial Innovation Facility @ Mulford Hall, UC Berkeley

What will you learn?

Led by instructors from Google Earth Outreach and Google Earth Engine, this workshop will teach highly practical tools which can be used to collect, host, analyze, visualize, and publish map data using the power of the cloud. Sessions will include hands-on experience at both beginner and advanced levels using Google Earth Engine, which brings together the world's satellite imagery — trillions of scientific measurements dating back almost 40 years — and makes it available online with tools for scientists, independent researchers, and nations to mine this massive warehouse of data to detect changes, map trends and quantify differences on the Earth's surface. Applications include: detecting deforestation, classifying land cover, estimating forest biomass and carbon, and mapping the world’s roadless areas. Learn more aat http://earthengine.google.org/.

Who should attend?

Researchers and educators at UC Berkeley and UC affiliates who meet one or more of the following should attend!

  • Are currently working on GIS or remote sensing projects, or have datasets they want to map.
  • Are teaching or developing curricula for GIS or remote sensing courses.
  • Have intermediate-to-advanced technical experience in one or more of the following areas:
    • Remote sensing
    • GIS
    • Web/multimedia development 

Cost & Registration

Attendance is free, but registration is required since space is limited. http://ucberkeley2015.earthoutreach.org/home


New scholarly open access journal: Remote Sensing in Ecology and Conservation

Remote Sensing in Ecology and Conservation is a new, fully open access journal from Wiley and the Zoological Society of London. The journal will provide a forum for the rapid publication of peer-reviewed, multidisciplinary research from the interface between remote sensing science and ecology and conservation. The journal defines remote sensing in its broadest sense, including data acquisition by hand-held and fixed ground-based sensors, such as camera traps and acoustic recorders, and sensors on airplanes and satellites. The journal's intended audience includes ecologists, conservation scientists, policy makers, managers of terrestrial and aquatic systems, remote sensing scientists, and students.