Lisa Schile is off to Abu Dhabi

Dr. Lisa Schile is off to Abu Dhabi for a postdoctoral research position with the Smithsonian Institution. She'll be working on a project monitoring carbon sequestration in wetlands. We checked out some of the available Abu Dhabi imagery on-line. The country has a long and interesting coastline, with many mangroves and wetlands, and of course the ever increasing coastal development. Here is a snapshot from NASA of coastal development. Lisa has started a blog, and taking lots of pics for us to see.

See the bigger picture. Make a better world.

Earlier this week we in ESPM heard a report from the folks in the SWIRL marketing team, who have been working to extract the essence of what we do in ESPM and in CNR. Their proposed tagline for us is: "See the bigger picture. Make a better world." Which aptly describes what we do in applied geospatial sciences. I kinda wish I'd thought it up myself. And since this summer marks the 40th anniversary of the Landsat program, I thought I'd use this post to talk about how our ability to observe the earth from space does indeed fit this new tagline.

July 23, 1972 ERTS Earth Resources Technology Satellite (ERTS), later christened Landsat 1, was launched into a near-polar orbit. We had our first earth-watching, civilian science satellite. ERTS instruments recorded information in four spectral bands: red, green, and two infrared.

Remote sensing missions have continued through the decades that followed, making modern earth system science, landscape ecology, agriculture prediction, and many other fields possible. The Landsat missions continue with some blips: Landsat2 was launched in 1975, Landsat 3 in 1978; Landsat 4 in 1982 and Landsat 5 in 1984; in 1993 funds were found to keep Landsat 4 and 5 operational just before Landsat 6 failed upon launch in 1993 and ended up in the Indian Ocean. Landsat 5 only recently gave out after 27 year of imaging; Landsat 7, launched in 1999 continues its work as well.  The eighth satellite, dubbed the Landsat Data Continuity Mission (LDCM), is scheduled for launch in 2013. It will be the next chapter for the longest-operating Earth-observing program in the world. More information here: http://earthobservatory.nasa.gov.

Landsat 7 is entirely government owned and operated, and after launch, the USGS was charged with distributing the data at government (nonprofit) rates. Today, the USGS distributes Landsat data over the Internet for free, and usage has exploded. Back in the day, we had to pay for each scene individually. This tended to limit the ability to work at regional, let alone global scales.  The new model of data distribution has made a number of on-line resources and visuzalizations possible.  Additionally, there are currently a quarter of a million science citations that use Landsat imagery, focusing on agriculture, oceans, land change, urban and natural areas.

The first fully operational Landsat image taken on July 25, 1972, inaugurating a 40-year run when the first satellite was known as the Earth Resources Technology Satellite, or ERTS. Credit: NASA’s Earth Observatory

This image above was the first image from the Landsat program. It shows Dallas, TX. Check out those reservoirs!

Some nice write-ups about Landsat:

Landsat imagery:

Happy Fall Semester 2012!

ASPRS 2012 Wrap-up

ASPRS 2012, held in Sacramento California, had about 1,100 participants. I am back to being bullish about our organization, as I now recognize that ASPRS is the only place in geospatial sciences where members of government, industry, and academia can meet, discuss, and network in a meaningful way. I saw a number of great talks, met with some energetic and informative industry reps, and got to catch up with old friends. Some highlights: Wednesday's Keynote speaker was David Thau from Google Earth Engine whose talk "Terapixels for Everyone" was designed to showcase the ways in which the public's awareness of imagery, and their ability to interact with geospatial data, are increasing. He calls this phenomena (and GEE plays a big role here): "geo-literacy for all", and discussed new technologies for data/imagery acquisition, processing, and dissemination to a broad public(s) that can include policy makers, land managers, and scientists. USGS's Ken Hudnut was Thursday's Keynote, and he had a sobering message about California earthquakes, and the need (and use) of geospatial intelligence in disaster preparedness.

Berkeley was well represented: Kevin and Brian from the GIF gave a great workshop on open source web, Kevin presented new developments in cal-adapt, Lisa and Iryna presented chapters from their respective dissertations, both relating to wetlands, and our SNAMP lidar session with Sam, Marek, and Feng (with Wenkai and Jacob from UCMerced) was just great!

So, what is in the future for remote sensing/geospatial analysis as told at ASPRS 2012? Here are some highlights:

  • Cloud computing, massive datasets, data/imagery fusion are everywhere, but principles in basic photogrammetry should still comes into play;
  • We saw neat examples of scientific visualization, including smooth rendering across scales, fast transformations, and immersive web;
  • Evolving, scaleable algorithms for regional or global classification and/or change detection; for real-time results rendering with interactive (on-the-fly) algorithm parameter adjustment; and often involving open source, machine learning;
  • Geospatial data and analysis are heavily, but inconsistently, deployed throughout the US for disaster response;
  • Landsat 8 goes up in January (party anyone?) and USGS/NASA are looking for other novel parterships to extend the Landsat lifespan beyond that;
  • Lidar is still big: with new deployable and cheaper sensors like FLASH lidar on the one hand, and increasing point density on the other;
  • Obia, obia, obia! We organized a nice series of obia talks, and saw some great presentations on accuracy, lidar+optical fusion, object movements; but thorny issues about segmentation accuracy and object ontology remain; 
  • Public interaction with imagery and data are critical. The Public can be a broader scientific community, or a an informed and engaged community who can presumably use these types of data to support public policy engagement, disaster preparedness and response.

AAG 2012 Wrap-up

NY skyline from Tim DeChant's blogAAG was a moderately large conference (just under 9,000) this year, held in mid-town NY. It was a brief trip for me, but I did go to some great talks across RS, GIScience, cartography, and VGI. I also went to a very productive OpenGeoSuite workshop hosted by OpenGeo. Some brief highights from the conference: Muki Hacklay discussed participation inequities in VGI: when you mine geoweb data, you are mining outliers, not society; there are biases in gender, education, age and enthusiasm. Agent-based modeling is still hot, and still improving. I saw some great talks in ABM for understanding land use change. Peter Deadman showed how new markets in a hot crop (like Acai) can transform a region quite quickly. Landsat 8 will likely be launched in early 2013, but further missions are less certain. My talk was in a historical ecology session, and Qinghua Guo and I highlighted some of the new modeled results of historic oak diversity in California using VTM data and Maxent.

Saturday evening I had the great pleasure of being locked in after hours at the NY Public Library for a session on historic maps. David Rumsey, with Humphrey Southall (University of Portsmouth) and Petr Pridal (Moravian Library) led a presentation introducing a new website: oldmapsonline.org. The website's goal is to provide a clearer way to find old maps, and provide them with a stable digital reference. 

Landsat continues...

Tentatively excited: the Landsat mission will continue (I think). Its new name will be LDCM: Landsat Data Continuity Mission. Tentative launch date in 2013. More information here. The President's recent budget seemed to inlude continued funding for Earth Observation. The news post I read says: Among the other highlights in the White House summary, spending on Earth observation satellites would be maintained at nearly $1.8 billion next year.

Landscape as palimpsest

I am reading a fascinating book this January (xmas gift from the parents) by Jonathan Raban called Driving Home: An American Journey. He is a wonderful writer, and in the introduction he discusses his love of reading, travel and landscapes. He puts all of these into a kind of analytical framework, and discusses how one can observe and consider writing, language, and landscapes as a way to better understand people, context, place and history. Consider this marvelous paragraph:

Trying to understand the habitat in which we live requires an ability to read it - and not just in a loose metaphorical sense. Every inhabited landscape is a palimpsest (this is me now: what an awesome word! see below for definition), its original parchment nearly blackened with the cross-hatching of successive generations of authors, claiming this place as their own and imposing their designs on it, as if their temporary interpretations would stand forever. Later overwriting has obscured all but a few, incompletely erased fragments of the earliest entries on the land, but one can still pick out a phrase here, a word there, and see how the most recently dried layer is already being partially effased with fresh ink.

From wikipedia: A palimpsest is a manuscript page from a scroll or book from which the text has been scraped off and which can be used again. I had not heard of its used as a metaphor for a landscape before, but I like it!

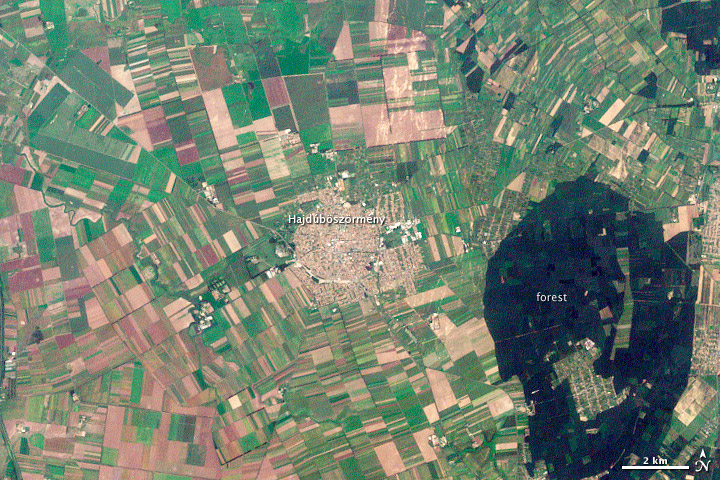
Hajdúböszörmény, Hungary. LandsatYesterday this NASA image post came across my screen as a fitting example of what Raban is talking about. In the  text that accompanies the image, they say "The history of Hajdúböszörmény, Hungary, echoes across its name and over its outline on the land." They go on to discuss the derivation of its name, which echoes past conflicts and local economy, and show how its history is written on the land, in layers of land use. 

"The city is round, a shape easily defended on the flat North Pannonian Plain in northeastern Hungary. The livestock-based economy may also play a role in the shape of the city. The center is densely built, a concentrated ellipse of tan and white. Surrounding the center is a slightly less dense circle, marked by diagonal roads, which held stockyards and gardens. Even today, tiny spots of green indicate that this area contains more open garden space than the city center."

Hooray for geography, landscape history and remote sensing. All fascinating subjects to study. And, I recently found this blogpost from Tim DeChant, former grad student and honorary geographer, in which he describes "ghosts of geography".

Forest clearing and regrowth in Washington

These shots (both Landsat 5) are from much larger images provided by NASA Earth Observatory. They depict forest clearing and regrowth in Washington state. The checkerboard pattern is typical of land ownership patterns in the American West.  A nice article on this checkerboarded ownership patterns is here. The overall article talks about carbon storage and forestry; the point of the images below is 1) the pattern of clearing in 1984, which is really quite interesting and abstract, and 2) the regrowth in 2010.


From the article:

This pair of images, both from the Landsat 5 satellite, shows grids of forest disappearing and gradually regrowing over 26 years. In 1984, logging in the area appears to be in the early stages. In many places, red-brown earth is exposed under the swaths of freshly cut forest. Other grids, cleared just a bit earlier, are pale green with newly growing grasses or very young trees. The rest of the image is dominated by the deep green of dense, mature forest. In 2010, the logging operation seems to be more mature. There is little evidence of fresh cuts, but some areas have been recently cleared. Pockets of mature forest remain, and forest is regrowing in other places. Grids that had been clear in 1984 are forested in 2010.

Trees become houses, furniture, paper products, and myriad other products that we use every day. Trees are also important because they take carbon dioxide from the atmosphere and convert it to the sugars that make up the leaves and wood of the tree. Trees store carbon. The Earth Observatory’s new carbon cycle article describes the impact of deforestation on the carbon cycle:

When we clear forests, we remove a dense growth of plants that had stored carbon in wood, stems, and leaves—biomass. By removing a forest, we eliminate plants that would otherwise take carbon out of the atmosphere as they grow. We also expose soil that vents carbon from decayed plant matter into the atmosphere. Humans are currently emitting just under a billion tons of carbon into the atmosphere per year through land use changes. Changes that put carbon gases into the atmosphere result in warmer temperatures on Earth.

Satellite images like these help scientists estimate how much carbon dioxide goes into the atmosphere when a forest is cleared, and how much carbon dioxide is being taken out of the atmosphere as a forest regrows.

Read more in the Carbon Cycle feature.

Wallow fire image from Nasa

From the Nasa Earth Observatory: The newly burned land left in the wake of the Wallow Fire is dark red in this false-color image taken on June 15, 2011. The image, acquired by the Landsat 5 satellite, is made with infrared light. The slightly blue blur is smoke, and dots of bright orange-red on the south side of the burn are active fires. Unburned forest is green, and sparsely vegetated land is pink.

By the end of the day on June 15, the Wallow Fire had burned 487,016 acres of forest in eastern Arizona and was 20 percent contained. Most of the fire activity was on the south side of the fire, away from the majority of the communities that had been evacuated. Among the places evacuated were Greer and Eager, labeled in the image. Irrigated plants (like lawns) are pale spots of green and buildings are tiny dots of blue. Most of the 32 homes destroyed in the fire were in Greer, where the fire clearly burned to the edge of the community. While the burned area encroaches on Eager in places, a buffer of green separates the community from the fire.

ESRI's ChangeMatters and New Landsat Image Services

Yesterday at the annual ASPRS conference in Milwaukee, WI (yes there were sausages shaped like the state), Jack Dangermond announced the release of ChangeMatters, and new Landsat Image Services from ESRI.

ChangeMatters. Working with partners, ESRI developed this web application - ChangeMatters - which allows users throughout the globe to quickly view the GLS Landsat imagery both multi-spectrally (in different Landsat band combinations) and multi-temporally (across epochs), and to conduct simple change detection analysis.

Image Services, with examples of vegetation, false color, land-water band combinations in seamless, color matched Landsat mosaics. Downloads will be available soon. Pretty nice. Website.

Example from ChangeMatters: Las Vegas from 1975 - 2000. Green is increase and red decrease in veg


Mapping wetlands: the GlobWetland project

A bit late, but a good source of wetland mapping information from the the GlobWetland Symposium: Looking Lake Bogoria in Kenya, Landsatat wetlands from space.  The GlobWetland project was launched in 2003 with the aim of developing and demonstrating earth observation-based information services to support wetland managers and national authorities worldwide in responding to the requirements agreed under the Convention. The project involved 50 different wetlands in 21 countries and relied on the direct collaboration of several regional, national and local conservation authorities and wetland managers. It has now produced a number of standardised information products (e.g. land use and land cover maps, change-detection maps, water cycle regime maps and others) validated over the 50 selected sites by the users themselves, consolidated methods and guidelines for the users to continue the work after the project lifetime.

The GlobWetland Symposium was held in October 2006 in Frascati, Italy to inform the general public and policy makers of the importance of wetlands and to promote their conservation and protection worldwide. The papers in this special issue highlight the major points and recommendations derived from the Symposium while the final conclusions provide a basis for initiating new actions within the ESA in support of the EO requirements of the Ramsar Convention and the wetlands community.

The special issue in Journal of Environmental Management from the conference has many interesting papers on wetlands mapping.

NASA Orbiting Carbon Observatory Goes for a Swim

The NASA Orbiting Carbon Observatory was intended to monitor carbon dioxide in order to help assess global warming.

Now it's hanging out with Landsat 6.

The rocket that the satellite was traveling on failed to separate from its payload fairing. The extra weight prevented the rocket from reaching orbit and the satellite plunged into the Ocean near Antartica. That's a $278 million swim.

Really though, it's all about Google Ocean now, so OCO probably just wanted a piece of the spotlight.