TauDEM software: for your hydro modeling needs

This was recommended to me recently by Orien; he is using it to create topographic indices to use as ancillary data in an object-based classification of palustrine wetlands in the foothills of the Sierra Nevada. These wetland sites are terrifically important for rails, and mapping them efficiently is a challenge.  Topographic information is proving useful in the classification, and Orien used this software rather than the ArcGIS hydro modeler suite.

From David Tarboton at Utah State: Terrain Analysis Using Digital Elevation Models (TauDEM) is a set of tools for the analysis of terrain using digital elevation models. TauDEM currently provides numerous capabilities that expand on the ESRI suite including (more listed on website):

  • Computation of flow directions and slopes;
  • Contributing area using single and multiple flow direction methods;
  • Multiple methods for the delineation of channel networks that include curvature;
  • Delineation of watersheds and subwatersheds draining to each stream segment; and
  • Specialized functions for terrain analysis, including wetness indices, accumulation measures, and downslope and upslope functions.
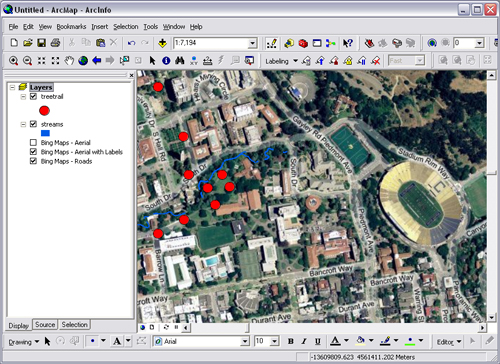
Bing map layers now available in ArcGIS applications

ESRI and Bing Maps (formerly Microsoft Virtual Earth) have recently developed a seamlessly integrated solution to view Bing’s aerial, road, or hybrid data as a base map in ArcGIS applications.  These layers are the same that can be viewed via Bing Maps web interface offering a huge variety of imagery throughout the world including very high resolution sources.

The layers are easily integrated into ArcMap by adding the .lyr files from ESRI’s website to any project.  These small .lyr files may be saved on your hard drive and accessed just like any other layers that you have stored locally.   In order to use these layers, however, you will need to have the latest version of ArcMap (9.3.1) installed, and a new license must be installed as described in the link.  For those of you connecting through UC Berkeley’s license server, you will be happy to know that this license update has already been made.

New(-ish) graphics software

These are not GIS or mapping software, but if you are looking for cheap, intuitive, effective and well-designed software for processing your summer vacation snaps or spreadsheets, consider these software programs:

  • Acorn: an innovative image editor built with simplicity in mind. Fast, easy, and fluid, Acorn provides the tools you need to alter and enhance your images, without any overhead. Acorn feels right, it won't drain your bank account, and you don't need a Ph.D. in computer graphics to use it. Cropping, color management, transformations are a breeze.
  • OmniGraphSketcher: helps you make elegant and precise graphs in seconds by combining the data plotting power of charting applications with the ease of a basic drawing program. You can import directly from excel. (Other Omni software includes OmniGraffle, my other favorite line drawing program (with TONS of stencils to steal ideas from)). On Tim's suggestion, I just recreated a series of excel charts for a publication using this software, and really like the switch.

New 'Map Illustration' Software for Mac Users

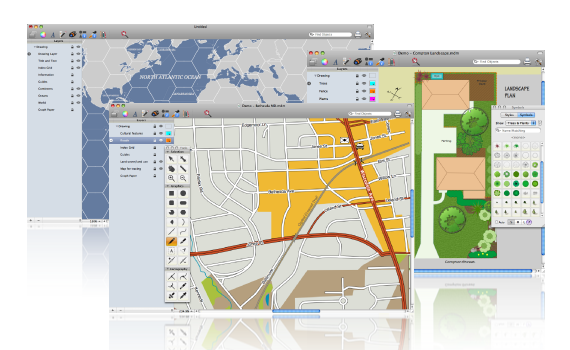
Mapdiva, LLC has just resleased its map illustration software OrteliusTM  for Mac computers. It's only 30Mb to download a free 31-day trial version, and for now they're offering an 'Introductory Price' of $79 (versus $99) until the end of September. An Education Edition is also available only $39 (after Sept. 30 willl be $49) for currently enrolled students with a valid .edu address.

Note that the company states, "Ortelius is designed for cartographic output as the end product, intentionally not a GIS system, though the Professional Edition with add more GIS-type operations to the currently available tools. On a general note the Standard Edition is likely to fall short in some aspects for hardcore geographers and GIS users; the Professional Edition is intended to provide many more GIS features." So some users may want to wait for the Pro Edition for increased functionality.

From The Map Room

Using LiDAR las files in next eCognition version

via Andreas Lang at the Definiens Community

Can we load and process LiDAR las files in Definiens eCognition (Developer or Server) directly?

The new Definiens software will have two ways for handling las files via converting them into rasters directly in the Software:

  • a raster driver for loading and visualizing these kind of images (with an appropriate dialog for setting the resolution for converting the point cloud to a 2D raster) using the driver the user can see the intensity data and select an appropriate subset;
  • an algorithm for converting the existing loaded image layer (las file) into a feasible layer with appropriate data of intensity, elevation, class or number of returns for further processing with much more functionality for filtering:
    • By Return (All/First/All)
    • By Classes
    The user can also select the kind of calculation for a raster cell value (Average, Minimum, Maximum, Median, Most frequently. value).


Offset points in ArcMap

Working with GIS, everyone encounters those problems that he knows there is a solution to, but he has no idea how to fix. Dealing with overlapping points has been a persistent example of such a problem for me. The other day, I was working with a file that contained several points with identical locations. In this case, the precise location of the points was less important than depicting the number of occurrences in the general region. I still wanted to show points on the map and did not want to show the number of occurrences in an enclosing polygon. Therefore, I needed a way to spread my points out.

After briefly scouring the ESRI site I found this guide for separating points based on labels. Essentially, this documents gives instructions to remove the symbols for the points in question and to enable the labels, but replacing the label text with symbols. Now symbols for the points show up where the labels would normally appear. I used this in conjunction with the labeling tools in the Maplex extension in ArcMap to gain a little more control over how the labels would be dispersed and to provide more offset.

This solution is only appropriate in certain scenarios, but it is a quick fix to a problem that I frequently encounter.

Does anyone else use a different solution to this problem?

Definiens community site launched

At our Definiens workshop today, Juan mentioned that the Definiens community website has been launched in the last month. Definiens is one of the few comprehensive segmentation and classification software solutions targeted for high spatial resolution imagery processing.  I've used the software for mapping tidal wetland sites, and for mapping dead crowns in oak forests.  The community site includes lots of information on shared codes, videos, demos, and discussion.  Since the software is so comprehensive, and has so many possible options, it can be difficult to become an expert. I personally like to know the "choice domain" within which I am working, so learning Definiens places me somewhere on the edge of my comfort zone. But with this, especially the rule set sharing, I think I can get stuck in. Thanks Juan!

The GIF is one of 7 Centers of Excellence for Definiens; other sites include: