map of global routes of ship-borne invasive species

From the BBC. Scientists have developed the first global model that analyses the routes taken by marine invasive species. The researchers examined the movements of cargo ships around the world to identify the hot spots where these aquatic aliens might thrive. The research is published in the Journal Ecology Letters.

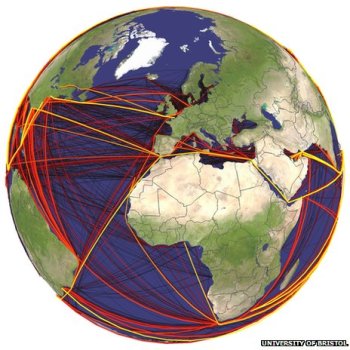
Scientists mapped the global routes taken by cargo ships over a two-year period

Marine species are taken in with ballast water on freighters and wreak havoc in new locations, driving natives to extinction.

There has been a well-documented boom in global shipping over the past 20 years and this has led to growing numbers of species moving via ballast tanks, or by clinging to hulls.

Some ports such as San Francisco and Chesapeake Bay have reported several exotic new species arriving every year. Economic estimates indicate that marine invaders can have huge impacts that last for decades.

Now, scientists from the UK and Germany have developed a model that might help curb these unwanted visitors. They obtained detailed logs from nearly three million voyages that took place in 2007 and 2008. The model combines information such as shipping routes, ship sizes, temperatures and biogeography to come up with local forecasts of invasion probabilities.

DNRGarmin + QGIS for a free and useful way to map properties

This website shows how any average computer user and/or landowner or forester can utilize the Quantum GIS open source freeware to do professional analyses of their land or their clients' land for free. Thanks Bob Wagoner!

http://www.centralillinoisforestry.com/index.php/illinois-forestry-blog/73-quantum-gis-for-landowners-and-practitioners

New report on sierra forest health and carbon storage

The Sierra Nevada Conservancy has just released a new report on System Indicators for Forest Health and Carbon Storage. This fourth report in the System Indicators series focuses on Sierra Nevada forests, and includes indicators related to Forest Health and Biomass/Carbon Storage on forest lands. In addition, this report describes the extent, character, and ownership of forest land in the Sierra Nevada Conservancy (SNC) Region. The lead author on the report is our Susie Kocher, from UC Cooperative Extension, and from SNAMP.

See the report here: http://www.sierranevada.ca.gov/about-us/SystetmIndicatorsForestHealth.pdf/view

LDCM releases first images of Earth!

Turning on new satellite instruments is like opening new eyes. This week, the Landsat Data Continuity Mission (LDCM) released its first images of Earth, collected at 1:40 p.m. EDT on March 18. The first image shows the meeting of the Great Plains with the Front Ranges of the Rocky Mountains in Wyoming and Colorado. The natural-color image shows the green coniferous forest of the mountains coming down to the dormant brown plains. The cities of Cheyenne, Fort Collins, Loveland, Longmont, Boulder and Denver string out from north to south. Popcorn clouds dot the plains while more complete cloud cover obscures the mountains.

Much more on the story and the images here:

http://www.nasa.gov/mission_pages/landsat/news/first-images-feature.html

Cal-adapt in the news

Kevin and I wrote a blog story for UC's Center for Forestry on Cal-Adapt. We walk through the local tools for a community by focusing on Eureka in Humboldt County. Humboldt County, located in Northwest California, is the southern gateway to the Pacific Northwest. The County is bound on the north by Del Norte County; on the east by Siskiyou and Trinity counties; on the south by Mendocino County and on the west by the Pacific Ocean. The County encompasses 2.3 million acres, 80 percent of which is forestlands, protected redwoods and recreation areas. Humboldt County faces a range of changes to its local climate: temperature, snowpack, fire regimes and sea level. Each of these can be explored with Cal-Adapt Local Snapshot tool.

Check it out: http://ucanr.edu/blogs/blogcore/postdetail.cfm?postnum=9573

The New Cartographers

 Interesting article by Emily Underwood in Science Magazine 

The New Cartographer

"Geographers have traditionally studied how the natural environment contributes to human society and vice versa, whereas cartographers have focused more explicitly on the art and science of mapmaking. Over the past couple of decades, a new field has emerged: geographical information systems (GIS), blending the study and expression of geographic information. Cartography and geography have overlapped and spawned innumerable subspecialties and applications. Modern geographers and cartographers are involved in diverse projects: tracking fleets of vehicles or products, helping customers locate a Dunkin' Donuts, modeling environmental scenarios such as oil spills, and studying the spread of disease."


more online

ANR Statewide Program on GIS

Mission Statement: IGIS aims to support high-priority programs to advance research and extension projects that enhance agricultural productivity, natural resource conservation and healthy communities into the future by providing Informatics and Geospatial Information Systems tools and applications.

ANR Recently announced the development of a new Statewide Program called the Informatics and GIS (IGIS) program. The new program aims to over the next five years become the nexus for ANR’s rich and diverse geospatial and ecological data, research information, and resources for academics and the public who rely on geospatial and informatics data, analysis and display.  Through data capture, information sharing, and collaboration, we aim to increase our ability to make meaningful predictions of the agricultural, ecosystem, and community response to future change, to increase our understanding of California’s diverse natural, agricultural and human resources, and to support research and outreach projects that enhance agricultural productivity, natural resource conservation and healthy communities into the future.

The IGIS team needs your input to design this resource to be an efficient and helpful delivery of information and GIS support. If you are affiliated with ANR, please take a few minutes to complete the Survey of Informatics and GIS Needs, Knowledge and Data Availability.  This is a short and comprehensive survey that will assess GIS, data and information needs, evaluate your level of informatics and GIS expertise and use of geospatial tools and data.  Your response will be of great assistance toward building a successful State-wide program.

Google is fined for collecting private info with Street View

We're not just taking pictures any more... All over the channels this morning is the $7B fine paid by Google to multiple states for violating public privacy.

From the NYTimes: Google on Tuesday acknowledged to state officials that it had violated people’s privacy during its Street View mapping project when it casually scooped up passwords, e-mail and other personal information from unsuspecting computer users.

Google says "we work hard to get privacy right at Google, but in this case we didn’t, which is why we quickly tightened up our systems to address the issue.” A more sceptical view is found here: Scott Cleland's blog: http://www.precursorblog.com/ (including a Google Privacy Rap Sheet).

The new settlement, which requires Google to set up a privacy program within six months, that includes an annual privacy week event for employees, and training for the public on how to protect themselves.

New 2012 SOD Confirmations Added to OakMapper!

New SOD Blitz 2012 Data

New confirmed cases of Sudden Oak Death (SOD) (P. ramorum) have been added to OakMapper, a project that tracks the spread of Sudden Oak Death from data collected by citizens and organizations. All official SOD cases are collected and confirmed by the California Department of Food and Agriculture or the University of California. Community SOD cases are submitted by citizens via the OakMapper website and iPhone application. 613 new points collected in 2012 have been added to OakMapper bringing the total number of confirmed SOD locations to 2804. The new data consists of laboratory confirmed cases collected by the annual SOD Blitz campaign of 2012 from the Forest Pathology and Mycology Lab run by Dr. Matteo Garbelotto. 

Click on the image in the upper left to view a close-up of the new confirmed SOD data (in green) from the SOD Blitz 2012. 

Explore the new data online here.

OakMapper.org

Update from LDCM

Some updates from this video from NASA:

  • Imagery should be available late May 2013
  • Landsat 7 has enough fuel to last until 2016
  • LCDM has a 5 year mission, but they are hopeful for a 10 year mission
  • Data continuity is the key to this whole deal: "continuity drives landsat"
  • High resolution data does not have the temporal resolution as Landsat - via Kass G.

Very excited.

LDCM FAQ here.


Landsat 8 is up and orbiting!

Atlas 5 Rocket With Landsat PayloadFun day today watching the LDCM (Landsat Data Continuity Mission) make its successful launch of the newest and coolest sensor in the Landsat family. The flawless launch from Vandenburg AFB was witnessed with lots of cheering and earth-themed cupcakes in Mulford Hall!

While I am not actively using Landsat imagery, I used Landsat 4 and 5 imagery for my dissertation, back in the day, and use it still to introduce geographic concepts in class. And I am super excited to see the new imagery. The sensor has similar spectral bands to the ETM+ sensor on Landsat 7, but also I think includes a new coastal aerosol band (443 nm) and cirrus detection band (1375 nm). The legacy of the Landsat program is tremendous; the program has given us reliable, comprehensive, and detailed views of a dynamic earth for decades. It is a government sponsored science program with lasting impact.

Some nice write-ups about Landsat:

NASA Earth Observatory Landsat Looks and Sees
NASA Landsat: http://www.nasa.gov/mission_pages/landsat/main/index.html
USGS Landsat Missions: http://landsat.usgs.gov/
Landsat Top 10: http://www.nasa.gov/mission_pages/landsat/news/landsat-40th-top10.html

Anyway, it was nice to have everyone on board to witness the launch! Thanks GIF folks and everyone else in the lab. Now we just have to watch out for DA14 on Friday!

How to Download Lots of Lidar from the Digital Coast

Via LASTOOLS: Kirk Waters, physical scientist at NOAA, describes in his latest blog entry how to efficiently download lots of compressed LiDAR data in LAZ format from NOAA's Digital Coast servers:

http://www.csc.noaa.gov/digitalcoast/geozone/how-to-download-lots-of-lidar-on-digital-coast


He also conjectures that more LiDAR software will be able to input and output the LAZ format soon. After FME, TopoDOT, GlobalMapper, RiProcess, QT Modeler / QT Reader, ... (see http://laszip.org for a complete list of LAZ-enabled software and LAZ download sites).

The Coastal Services Center, home of the Digital Coast, is one cool place. I visited there in the 1990s while at NOAA-Beaufort and working with the C-CAP program.

Check out the GIF workshops for Spring 2013

The GIF workshop schedule for Spring 2013 has been posted! We have a new workshop this semester on Lidar! check it out!

GIF workshops offer hands-on applications oriented training in a variety of geospatial topics. Workshop fees are available at a subsidized rate of $84 for all UC students (graduate and undergraduate), faculty, and staff. Workshop fees are $224 for all non-UC affiliates.

Undergraduate students can apply for financial assistance to take a workshop through the GIF Undergraduate Scholarship Program.

Check them all out here.

Mapping and interactive projections with D3

D3 is a javascript library that brings data to life through an unending array of vizualizations.  Whether you've realized it or not, D3 has been driving many of the most compeling data visualizations that you have likely seen throughout the last year including a popular series of election tracking tools in the New York Times.

You can find a series of examples in D3's gallery that will keep you busy for hours!

In addition to the fantastic charting tools, D3 also enables a growing list of mapping capabilities.  It is really exciting to see where all this is heading.  D3's developers have been spending a lot of time most recently working on projections transformations.  Check out these amazing interactive projection examples:

Projection Transitions

Comparing Map Projections

Adaptive Composite Map Projections (be sure to use chrome for the text to display correctly)

Can't wait to see what the future has in store for bringng custom map projections to life in more web map applications!


New Landsat Satellite set to launch Feb 11th

NASA's Landsat Data Continuity Mission (LDCM) is scheduled to launch Feb. 11 from Vandenberg Air Force Base in California. A joint NASA and U.S. Geological Survey (USGS) mission, LDCM will add to the longest continuous data record of Earth's surface as viewed from space.

LDCM is the eighth satellite in the Landsat series, which began in 1972. The mission will extend more than 40 years of global land observations that are critical in many areas, such as energy and water management, forest monitoring, human and environmental health, urban planning, disaster recovery and agriculture. NASA and the USGS jointly manage the Landsat Program. Check out more info.

Lisa Schile is off to Abu Dhabi

Dr. Lisa Schile is off to Abu Dhabi for a postdoctoral research position with the Smithsonian Institution. She'll be working on a project monitoring carbon sequestration in wetlands. We checked out some of the available Abu Dhabi imagery on-line. The country has a long and interesting coastline, with many mangroves and wetlands, and of course the ever increasing coastal development. Here is a snapshot from NASA of coastal development. Lisa has started a blog, and taking lots of pics for us to see.

VTM wrap-up: check out some neat photos and videos...

The VTM collection is a great resource from the 1920s and 1930s that we are woking with as part of our Keck project. David Ackerly, Patrick McIntyre, Jim Thorne and I are working with four different parts of the collection:

  • 17,860 plots with digitized vegetation and locality data (UC Berkeley, Geospatial Innovation Facility);
  • ~195,000 square kilometers of digitized and georeferenced vegetation maps, covering 45% of the total area of California (UC Davis Information Center for the Environment);
  • 20,791 herbarium specimens with locality and collection information (UC Berkeley & Jepson Herbaria); and
  • ~ 3,100 digitized photographs (UC Berkeley Marion Koshland Bioscience and Natural Resources Library).

Pretty cool stuff! Some related cool VTM-related work out there:

First, Jim Thorne's fabulous movie about using VTM data to look at change in vegetation: http://vimeo.com/41524838.

Also, a nice photo re-shoot project from Elsmere Canyon that Patrick McIntyre pointed out...

And one of his own before and after photos.

The original VTM version...

Patrick's retake, 2012

Launch of Sonoma County Veg Mapping Program

The Sonoma County Agricultural Preservation and Open Space District has begun a 3-5 year program to map Sonoma County’s diverse plant communities.

An accurate, up-to-date map of vegetation and habitat type is key to ensuring good planning and management for watershed protection, flood control, fire and fuels management, and wildlife habitat conservation. A vegetation map is also critical to assessing climate benefits provided by the landscape, such as the amount of carbon being absorbed from the atmosphere or the degree to which the landscape is buffering extreme weather events.

These folks are using 3-6-inch CIR imagery and obia to map vegetation across Sonoma County. GIF is serving up the imagery! Check it out!