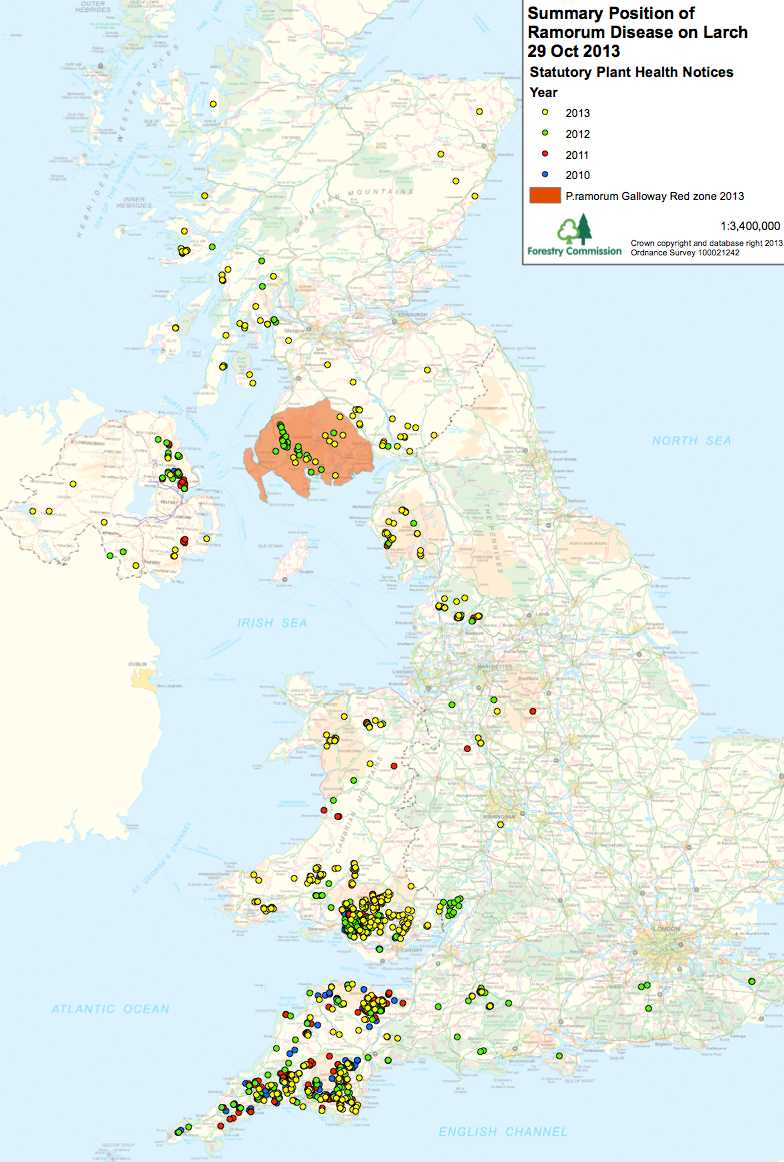
VGI or micro-mapping for response to Philippine’s typhoon disaster

urgent needs from the Philippines, from tweets and images

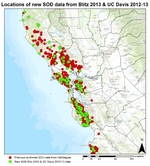
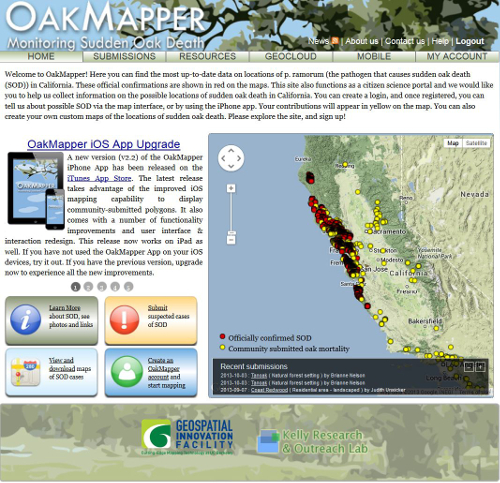
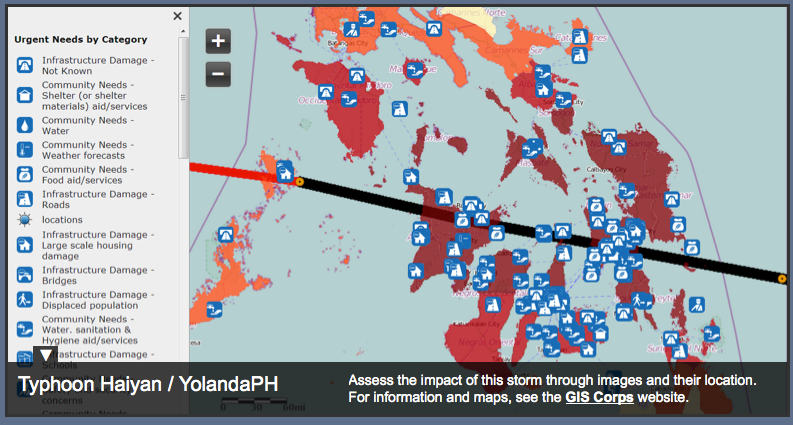
YolandaPH is a ESRI-based mapping platform for post-disaster response in the Philippines. Snapshot above.

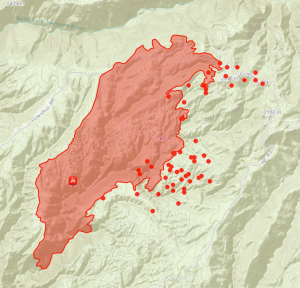
These maps were produced using a selection of photos from Twitter, Facebook, news articles, and other websites curated using the MicroMapper platform. The locations are approximate and more photos and information are currently being mapped and categorized by the GIS Corps

Hundreds of digital humanitarian volunteers worldwide, including media monitors, translators, GIS specialists, statistical analysts, emotional support teams, and standby task forces, are working around the clock with rescue and recovery efforts, particularly in the hard-hit eastern city of Tacloban.

"DHN is sorting through very high volumes of social media information,” said Sara Jane Terp, a DHN volunteer with the Standby Volunteer Task Force.

Approximately 182,000 tweets have been collected and automatically filtered down to 35,715 based on relevance and uniqueness, according to Carden.

Volunteers use triangulation (comparing information against two other sources, such as traditional media and official government reports) to verify information. The time-consuming work is made easier because of the large number of volunteers working in different time zones.

Useful slideshow of the workflow is found here.

from: http://www.irinnews.org/report/99102/micro-mapping-philippine-s-typhoon-disaster

UPDATE: Nice round-up of disaster response from flying sheep here.

Sudden Oak Death in the UK - Oct 2013

From suddenoakdeath.org.

The United Kingdom (UK) Forestry Commission has updated its P. ramorum larch outbreak map (http://www.forestry.gov.uk/forestry/infd-86ajqa) to include Northern Ireland.  

The map at left identifies areas where there is or has been confirmed or presumed infection in larch trees. Laboratory analysis of samples returns conclusive results in only a minority of cases, so a presumption of infection is used where all the other indications point to the presence of P. ramorum infection.

The colored dots on the map indicate sites where P. ramorum has been confirmed or presumed, and statutory plant health notices (SPHNs) have been issued. Each colour represents the April-March year in which this occurred.

The Galloway Red Zone in southwest Scotland has also been added to the map.  The Red Zone is the region of Scotland where the rate and severity of disease spread is too intense for control through tree felling; consequently, this region will have requirements put in place regarding the movement of infected timber and bark.  Control by statutory plant health notices requiring sanitation felling will continue elsewhere in Scotland. For more information on the status of the situation in Scotland, go to http://www.forestry.gov.uk/forestry/infd-9bglrr.


Helsinki wants feedback on its new urban plans

From Greg Brown.

Helsinki, Finland is developing a new city plan for the future (http://www.hel.fi/wps/portal/Kaupunkisuunnitteluvirasto_en). Helsinki becomes possibly the first major world city to use PPGIS to inform its comprehensive city planning process.   The PPGIS website was developed by Mapita (http://mapita.eu/), a software company founded by Prof. Marketta Kytta and others at Aalto University.  The website launched several days ago and has already had over 5500 participants map places and preferences for the future of Helsinki.
 
You can visit the website here:  https://helsinki.asiatkartalle.fi (There is an option to try out the website without having your map markers or survey responses included in the results…see option below the “Begin” button that says ”Try without saving answers”).

Some cool images showing the power of lidar and cartography

From Martin Isenburg, the brain behind LAStools.

Using LAStools, ArcGIS, and Photoshop, GRAFCAN has produced a LiDAR-derived digital suface model (DSM) that is seriously doped up: a synthetic map providing an intuitive understanding of the landscape. The product combines standard hillshading with a height and feature based color-coding that enables the viewer to "see" where trees are tall and to grasp height differences between buildings. The new product is available at a resolution of 2.5 meters/pixel via the GRAFCAN Web viewer and also as a WMS service. More info and pics here: http://rapidlasso.com/2013/11/03/grafcan-launches-dsm-on-steroids/.

Comparison between bare earth DTM and DSM with cartography.


Check out the greenhouses, which ppear as “low planar vegetatation”. They are made out of coarse maze fabric (instead of glass) that lets the laser through and does not deflect it (like glass would).

How does the USFS map vegetation post fires?

The discussion of how the USFS deals with fires on public forests came up strongly in our recent SNAMP Public Meeting. Our Last Change field site burned in October, and we are very interested in understanding the behavior and impact of the American fire. Part of the discussion stemmed from this presentation on preliminary estimates for fire intensity, ascertained partly from analysis of WorldView imagery delivered at our SNAMP meeting. For more on the SNAMP presentation, check out our website.

The website (linked below) offers an initial description of post-fire vegetative conditions using the Rapid Assessment of Vegetation Condition after Wildfire (RAVG) process. RAVG analysis looks at fires that burn more than 1,000 acres of forested National Forest System (NFS) lands, beginning with fires that occurred in 2007. These fires result in direct losses of vegetative cover and many of the benefits associated with forested ecosystems.

NFS lands experience thousands of wildfires every year, most of which are relatively small. The largest fires typically account for 90% of the total acreage burned. RAVG analysis provides a first approximation of areas that due to severity of the fire may require reforestation treatments. These reforestation treatments would re-establish forest cover and restore associated ecosystem services. This initial approximation could be followed by a site-specific diagnosis and development of a silvicultural prescription identifying reforestation needs.

Some resources:


FUEGO — A concept for a fire detection satellite

A nice press release about our new paper on the concepts behind a fire detection satellite with perhaps the coolest acronym yet: FUEGO — Fire Urgency Estimator in Geosynchronous Orbit. From Bob Sanders.

Artist's conception of the FUEGO satellite

Current and planned wildfire detection systems are impressive but lack both sensitivity and rapid response times. A small telescope with modern detectors and significant computing capacity in geosynchronous orbit can detect small (12 m2) fires on the surface of the earth, cover most of the western United States (under conditions of moderately clear skies) every few minutes or so, and attain very good signal-to-noise ratio against Poisson fluctuations in a second. Hence, these favorable statistical significances have initiated a study of how such a satellite could operate and reject the large number of expected systematic false alarms from a number of sources. We suggest a number of algorithms that can help reduce false alarms, and show efficacy on a few. Early detection and response would be of true value in the United States and other nations, as wildland fires continue to severely stress resource managers, policy makers, and the public, particularly in the western US. Here, we propose the framework for a geosynchronous satellite with modern imaging detectors, software, and algorithms able to detect heat from early and small fires, and yield minute-scale detection times. Open Access Journal Link. Press Release. KPIX spot.

Post American fire imagery

Check out these images from after the American fire, from the WorldView 2 satelllite from our northern SNAMP site. The blue boundary is our SNAMP site.  This background imagery is a pan-sharpened WV2 image (0.5 meters, channels 7, 5, 3). The red color depicts alive vegetation (at least for the time being) and green-blue is post-fire NPV (non-photosynthetic veg).  Thanks to Carlos Ramirez for the images.

 The post-fire imagery shows the heterogeneity of this fire - some spots burned all the vegetation, some spots have standing trees remaining.

The art of remote sensing: Van Gogh in Space via Landsat

This image is making the rounds on social media, and it is a beaut. The Landsat program calls this one "Van Gogh from Space" - It was imaged July 13th, 2005. 

In the style of Van Gogh's painting "Starry Night," massive congregations of greenish phytoplankton swirl in the dark water around Gotland, a Swedish island in the Baltic Sea.In a recent paper by Michael Wulder and others discuss the tremendous benefits of the Landsat program on numerous scientific disciplines, and the overwhelming benefits to science of open access to the Landsat archive.

"Landsat occupies a unique position in the constellation of civilian earth observation satellites, with a long and rich scientific and applications heritage. With nearly 40 years of continuous observation – since launch of the first satellite in 1972 – the Landsat program has benefited from insightful technical specification, robust engineering, and the necessary infrastructure for data archive and dissemination. Chiefly, the spatial and spectral resolutions have proven of broad utility and have remained largely stable over the life of the program. The foresighted acquisition and maintenance of a global image archive has proven to be of unmatched value, providing a window into the past and fueling the monitoring and modeling of global land cover and ecological change."

Reference: Wulder, M.A.; Masek, J.G.; Cohen, W.B.; Loveland, T.R.; Woodcock, C.E. Opening the archive: How free data has enabled the science and monitoring promise of Landsat. Remote Sensing of Environment 2012,122, 2-10

California Geoportal Offers One-Stop Shop for Statewide GIS Data

The California Geoportal, officially launched in March 2013 (see here for related launch press release), augments and in some ways replaces the original Cal-Atlas statewide GIS data download webpage with a more simplified, smooth, and more intuitive website for all GIS related data in the state. You can now search or browse for GIS data by geography and any corresponding metadata using traditional search queries as well as by using a standalone webGIS interface. The portal also provides direct download links to some Oregon and Nevada state GIS datasets. The site acts as a GIS data repository for publicly available GIS data and related documents and maps from state agencies and local and regional governments. Rather than hosting the physical data, the site instead acts as a library of direct download links to datasets that connect directly to the author’s databases. The site also links you to other state GIS applications such as the California Coastal Geoportal and webGIS viewers from various state agencies.

Screenshot of the CA Geoportal

Screenshot of the CA Geoportal Map ViewerSee below for an informative video on how and why the portal was created and for highlights of features:

New 2012-2013 SOD Confirmations Added to OakMapper!

New 2013 SOD Blitz and 2012-13 UC Davis DataNew confirmed cases of Sudden Oak Death (SOD) (P. ramorum) have been added to OakMapper, a project that tracks the spread of Sudden Oak Death from data collected by citizens and organizations. All official SOD cases are collected and confirmed by the California Department of Food and Agriculture or the University of California. Community SOD cases are submitted by citizens via the OakMapper website and iPhone application. 442 new points collected between 2012-2013 have been added to OakMapper bringing the total number of confirmed SOD locations to 3246. The new data consists of laboratory confirmed cases collected by the annual SOD Blitz campaign of 2013 from the Forest Pathology and Mycology Lab run by Dr. Matteo Garbelotto and also laboratory confirmed cases collected by the UC Davis Rizzo Lab run by Dr. David Rizzo.

Click on the image left to view a close-up of the new confirmed SOD data (in green) from SOD Blitz and UC Davis. 

Explore the new data online here.

OakMapper.org


Photos from the American Fire

These are courtesy of Christopher Dow, crew leader for our SNAMP field work. They were in the Last Chance area gathering post-treatment data when the American Fire started. They were able to collect all the field data we needed for SNAMP before leaving. Which is great news for SNAMP. The fire burned through our northern control and treatment firesheds. Check out the SNAMP project here.

Welcome to Fall 2013!

Fall semester is here! Summer was a great adventure, with a terrific Intro to GIS workshop at the Forest Camp (see Sam's photo below), and a just fantastic workshop down at Google where we learned about some really cool new Google tools with former Kellylabber Karin Tuxen and the rest of the Google crew.

Teaching GIS at the terrific Zivnuska HallThis summer we said goodbye to a few Kellylabbers - Sarah Lewis graduated (update here), and Jessica O'Connell is moving back to the southeast for research. New lab members include undergraduate student Tiffany Yu and graduate student Lauren Haumann, who are working on the OurSpace project. New postdocs and visitors include Alice Kelly, ESPM PhD (from S&E division), who will be working on her NSF postdoc project "Sustainability and Safety in the Pacific West's National Parks," and Paulina Wong, who comes from Hong Kong on a Fulbright Scholarship and whose background is in the use of three-dimensional (3D) spatial analytical tools to simulate visualize urban environments, she'll be working on the OurSpace project.

Also, check out the individual project pages at the right for news about what we are working on: SNAMP, VTM, Keck, Wetlands, OakMapper, OurSpace, and Oak encroachment, among other things.  Welcome back to Berkeley!

San Francisco circa 2072

SF archipelago, c. 2072

Some fun before the semester starts! Like something out of a great scifi novel: from Burrito Justice (and via Mark O.) "March 20th, 2072 (AP), Northern California Association of City States: With the surprising acceleration of sea level rise due to the melting of both the Greenland and Antarctic ice sheets over the past decade, the San Francisco canal system was officially abandoned this week. Additional ferry service has been announced between the new major islands of the San Franciscan Archipelago while the boring machines make progress under the Van Ness Passage and Richmond Pass for new transit tunnels." This rad poster is available for sale!

Update on the American fire and SNAMP

American fire as of 8-26-13The American fire is burning into our SNAMP study areas. It looks like our northern treatment and control sites have been burned through. Here is a snapshot of our study site and the fire perimeter (red) as of 8-26-13. SNAMP control (yellow) and treatment (purple) watersheds are shown.

American Fire Status from Incident Report as of 8-26-13: Fire Status: The south, west and north perimeters of the fire remainin patrol status. Some pockets of heat were found interior to the westside containment line and extinguished last night. Crews have completed burning operations adjacent to the Mosquito Ridge Road, along the eastern perimeter. These burning operations have consisted of fire fighters lighting low intensity (“cool”) fire with the intent of reducing ground fuels between the fire perimeter and the main fire. This tactic was highly successful as it reduced the potential of themain fire escaping containment lines. Crews continue to transition into detecting and extinguishing any remaining hot spots. With increased containment of the fire, crews have begun work repairing areas affected by fire fighting activities. This has included chipping material piled next to roads during fire line construction as well as identifying needs to construct water control devices along fire lines throughout the fire area. Forest visitors are asked to adhere to area and road closures. These closures are in place to protect visitors and fire fighters. The roads and areas that have been closed are unsafe due to fire-weakened, burned trees that pose a risk of falling, as well as frequently heavy smoke making visibility extremely poor. These areas and roads will be re-opened as soon as possible.

Summary Stats:

  • Total acres burned: 24,935 acres
  • Containment: 88%
  • Containment expected: Thursday August 29th, 2013 approx. 12:00 AM

Some resources:

We will keep you posted.

For more on the SNAMP project see: http://snamp.cnr.berkeley.edu/

This was originally posted on /.


American fire burns into SNAMP sites

American fire perimeter (red) as of 8-20-13The American fire is burning into our SNAMP study areas as of yesterday. Here is a snapshot of our study site and the fire perimeter (red) as of today (8-19-13 perimeter in orange). SNAMP control (yellow) and treatment (purple) watersheds are shown.

All SNAMP field crews are safely evacuated, with almost all field work completed for the year.

From the Incident Report: "The American Fire burning in heavy fuels on extreme slopes about 10 air miles northeast of the community of Foresthill, California, and eight air miles south of Interstate 80 has grown to 14,765 acres. While the fire is predominantly SimTable animation of American fire spread - modeled thru 8-14 I am guessingburning on the Tahoe National Forest within the North Fork of the Middle Fork American River drainage, there is a potential, given changes in weather or fire behavior, for the fire to threaten areas near Foresthill.

Active fire behavior continues on the eastern and southern flanks of the fire. Overnight, crews continued to build hand and dozer line to contain the active fire while evaluating future containment options. Firefighters will mop up and patrol containment line along Deadwood Road and Foresthill Divide Road south to the dozer line. Indirect line construction and mop up will continue down Deadwood Ridge. On the east side near Antoine, Manila and Screwauger Canyons, American fire as of 8-20-13 from ESRI onlinedirect and indirect line construction will continue, with support of retardant drops.

Active fire behavior and roll out of burning material continue to be of concern, and will be closely monitored. Strong, erratic outflow winds and lightning may occur today, as the National Weather Service’s Red Flag Warning remains in effect until 11 p.m. Wednesday.

Active fire behavior in very steep, inaccessible terrain makes preparation of contingency lines critical. Indirect attack is the safest way to manage fire in areas of steep and difficult terrain."

In the images to the left, both from ESRI online, there are a number of thermal hotposts in SNAMP territory American fire as of 8-21-13 from ESRI online(the red dots outside of the fire boundary) that were detected as of 10:30am 8-20-13 (upper image). As of 8-21-13 the MODIS hotspots indicate possible fire movement along Foresthill Rd to the east, and into the SNAMP control study area.


  Some resources:

We will keep you posted.

For more on the SNAMP project see: http://snamp.cnr.berkeley.edu/

This was originally posted on /.

Fall 2013 GIF Workshops Scheduled

The Fall 2013 schedule of workshops has been posted! Check them out at: http://gif.berkeley.edu/support/workshops.html.

Workshops include:

  • Intro to Geographic Information Systems (GIS): Environmental Science Focus
  • Intro to Geographic Information Systems (GIS): Social Science Focus
  • Intro to Global Positioning Systems (GPS): Working with Garmin receivers
  • Intro to Remote Sensing: Understanding digital imagery
  • Intro to Remote Sensing: Pixel-based analysis
  • Intro to Remote Sensing: Land cover change analysis
  • Intro to Remote Sensing: Object-based image analysis (OBIA)
  • Intro to Open Source GIS: Working with Quantum GIS (QGIS)
  • Intro to species distribution modeling
  • Creating your own web maps

ANR members are invited to attend. GIF workshops offer hands-on applications oriented training in a variety of geospatial topics. Workshop fees are available at a subsidized rate of $84 for all UC students (graduate and undergraduate), faculty, and staff. Workshop fees are $224 for all non-UC affiliates.

IGIS Retreat 2013

We just concluded our first IGIS Program all-hands-on-deck retreat. We evaluated our program components and made huge progress on planning for the future.  Key in our discussion was GIS Training for ANR, and linkages with the ANR Research and Extension Centers (RECs). The IGIS Program components include:

  • GIS Services Center: If you are in ANR and need help with your GIS Project, check out the ANR Services Center!
  • Training: We are developing a curriculum of GIS training.  Stay tuned! The first session ("Intro to WebGIS for ANR" involving Google and ESRI products) will be scheduled by the end of 2013.
  • ANR InfoBase: We are developing a database of REC related data and research project information.  These data will be made available through an online webGIS portal that is linked to other similar and complementary efforts statewide (including HOLOS).  
  • ANR EON: Eddy covariance towers and climate sensors will be placed at each ANR RECs. All sensor data will be available to ANR and other researchers. Check out Todd's post on setting up one of these towers.