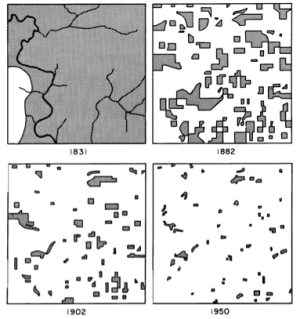
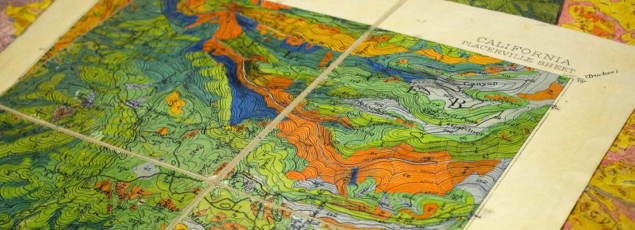
 An example of a VTM vegetation map, from Shufei LeiWe have been talking recently with the HOLOS project and the IGIS InfoBase project about the need to "rescue" data and to provide frameworks for data synthesis. I present to you a profound example of these needs: the VTM project. We have launched the new VTM website, in which the maps, plots, and photograph portions of the VTM collection are united and powered by HOLOS, open data, and sharing. The journey from paper collection to digital data has been a long one, with several cases of almost accidental and purposeful destruction. As such it is a cautionary tale about the importance of rescued and shared historical data in ecological and geographical analysis. We owe much to all the people who have contributed to the preservation and digitization of this important collection.
I spent this evening reading the oral history conducted in 1985 by Ann Lange of Albert Wieslander. It is called: California Forester: Mapper of Wildland Vegetation and Soils A. E. Wieslander, and it is a fascinating read. In addition to being a real spitfire and having very clear opinions on things (and people), he also tells this tale about the near loss in 1952 of the vegetation maps. Wieslander had made 23 of his vegetation maps available for publication through the University Press, for production and sale at a cost of $1 each. This was meant to supply funds for the rest of the maps to be published. But that didn't work out as planned.
"Not very many of the maps were sold, even though articles were written to give them publicity. I realized fairly soon that we wouldn't be able to publish any more unless we got additional money someplace.” He was "casually told one day that the University Press had written a letter to the station saying that the maps weren't selling very well, and it wanted to return the quadrangles to the station. They didn't want to handle it anymore.” A forest service employee "told the University Press the station didn't want the maps back and authorized it to dump them. I didn't know anything about this until after it was done. There was nothing I could do about it then. Imagine all these beautiful maps. They didn't even take out one as a sample.”
What!! That is so shortsighted… Anyway read on…
Wies (he refers to himself "Wies" in the interviews) then found out that the University Press couldn't understand the dumping of all those maps and alerted Paul Zinke, Forestry Professor here at Berkeley.
"So Zinke went down and got twenty copies of each of the quadrangles.”
“But, we still had all the original field maps, kept at the experiment station. Just before I retired, I talked with Herbert Mason about all the printed maps having been destroyed and about how it was important to preserve the originals. Researchers could use them. He suggested that the Botany Department set up in the Life Sciences Building a plant geography room. And the main feature of this plant geography room would be the vegetation mapping project. So I moved all the files of maps and sample plots over to the Life Sciences Building. Mason went through the material and found at least a third, maybe more, of the original maps were gone.” Apparently, different national forests had been writing to the station requesting certain maps. Since they didn't have any of the printed maps, originals were sent out, with no record kept of what was sent, or to whom.
This explains why the maps have been scattered across the state, and why it has taken so long to pull them (mostly) together again.
"The maps then made a trip back to the station, where Dr. William Critchfield used them to write a publication called "The Profiles of California Vegetation”. "Anyway, I'm glad that was done. It was a very nice publication, and it gave proper credit to the draftsman who did the beautiful job of drafting, and to the project, and to me. Then Critchfield also worked with James Griffen, of the university, and got out another publication on "The Distribution of Trees in California." It was based on the maps and other data we had." When Wies expressed "concern about these maps and Dr. Critchfield said, "I would like to get them deposited in the Bancroft Library." I don't know whether he did it or not, but that's what he told me.”
Thank goodness that they are back on campus in the Marian Koshland Library (and for this we are forever in debt to the wonderful Norma Kobzina), and the plot data, plot maps, vegetation maps, and photographs will be re-united and available for use.
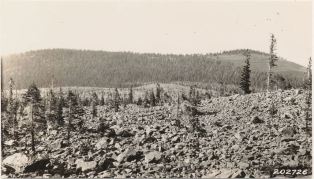 Albert Wieslander (October 1, 1925): Looking N 35 degrees W from 1/4 corner 16/17 T 31-4. Foreground dwarf timber on glacial deposit. Slope in background, section 7 and 8
 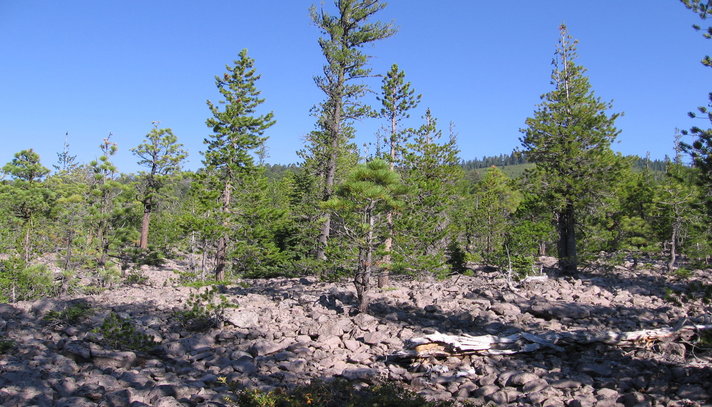 Tyler Brown of GRS (September,2011): At Accuracy Assessment Site 091646 located in the Chaos Crags Jumble in Lassen Volcanic National Park