The City Project: Park Poor, Income Poor, and People of Color
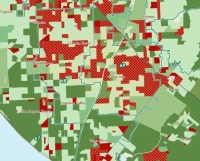
/ example from orange countyThe City Project has released a report for California analyzing access to green space. The report uses geographic, demographic, economic and historical data to map and analyze access to the region's green space. In addition, the report examines access to green space based on income, race or ethnicity.
The report's GIS maps were produced by GreenInfo Network and help illustrate unfair disparities in park access.
The areas that are symbolized with red and crosshatching indicate areas that are park poor (less than 3 acres of parks per 1,000 residents) and income poor (below $47,331 median household income), and disproportionately populated by people of color.