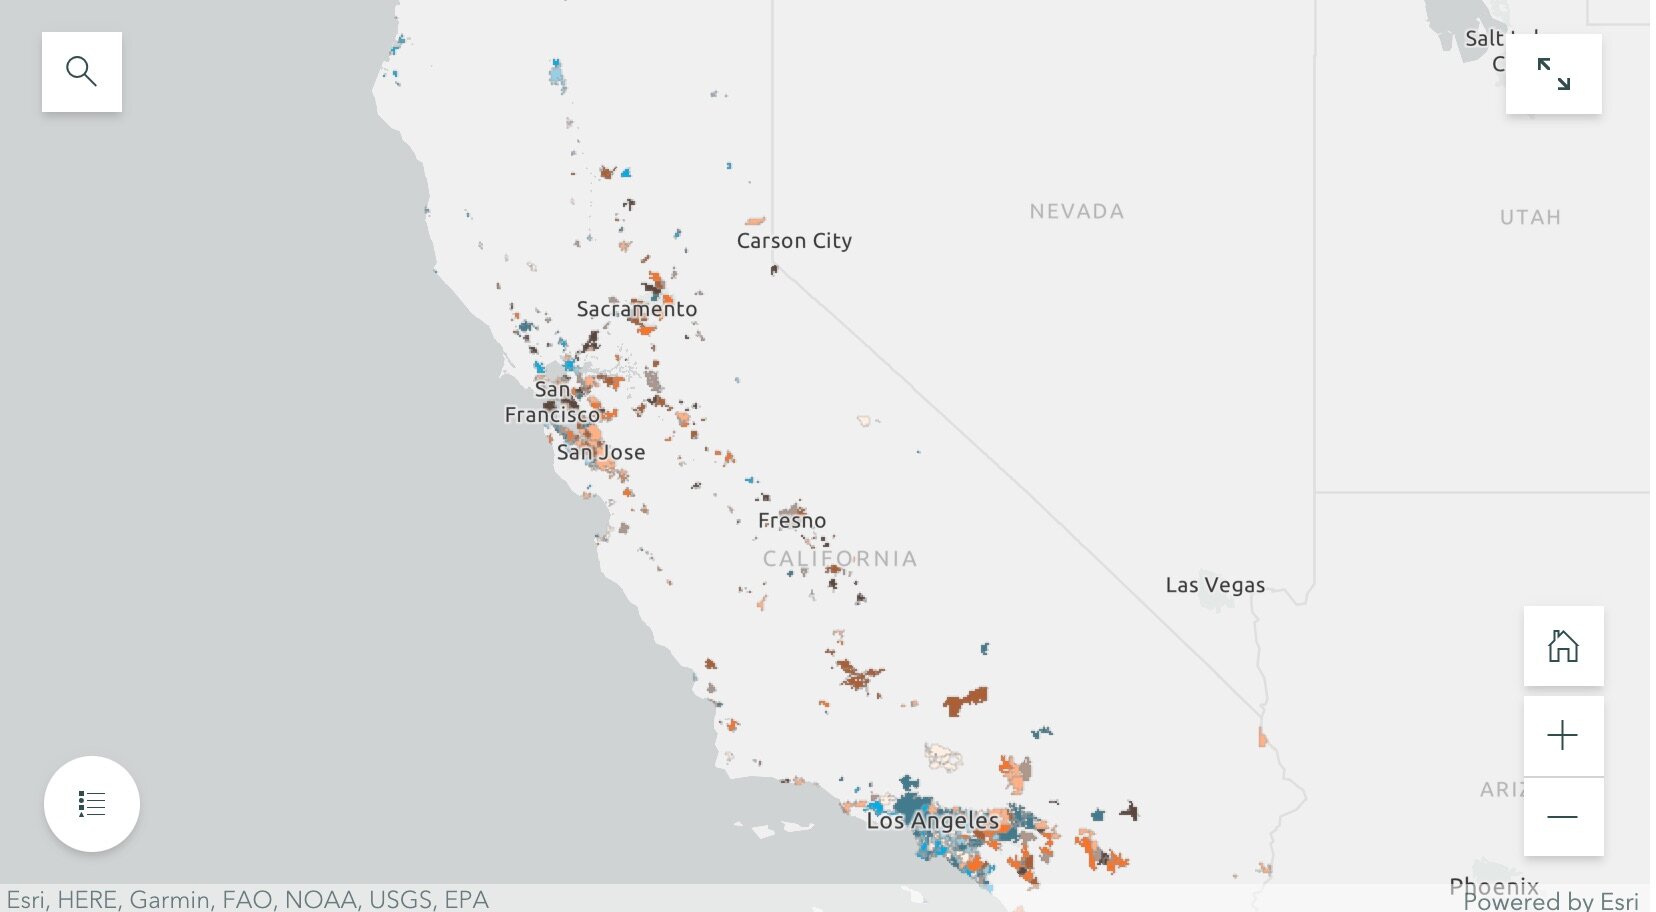
Cities that saw increases in population, but experienced little or negative change in PD spending (these are bright orange in the map);
Cities that saw increases in both PD spending and population (these are dark brown in the map); and
Cities that saw little or negative change in both PD spending and population (these are cream in the map).
They then dug into southern California and the Bay Area, and selected mid-size cities that exemplified the four trends to tell more detailed stories. These included for the Bay Area: Vallejo (increased police department (PD) spending, but saw almost no change in population), San Ramon (increases in population, but experienced little or negative change in PD spending), San Francisco (increases in both PD spending and population) and South San Francisco (little or negative change in both PD spending and population); and for southern California: Inglewood (increased police department (PD) spending, but saw almost no change in population), Irvine (increases in population, but experienced little or negative change in PD spending), Palm Desert (increases in both PD spending and population), Simi Valley (little or negative change in both PD spending and population). Check out the full Story Map here, and read more about these individual cities.
The 5-year changes in municipal police department spending are challenging to predict. Cities with high population growth from 2014 to 2019 did not consistently increase percentage police department spending. Similarly, cities that experienced low or even negative population growths varied dramatically in percentage change police department spending. The maps of annual police department spending percentages and 5-year relationships allowed us to identify these complexities, and will be an important source of future exploration.
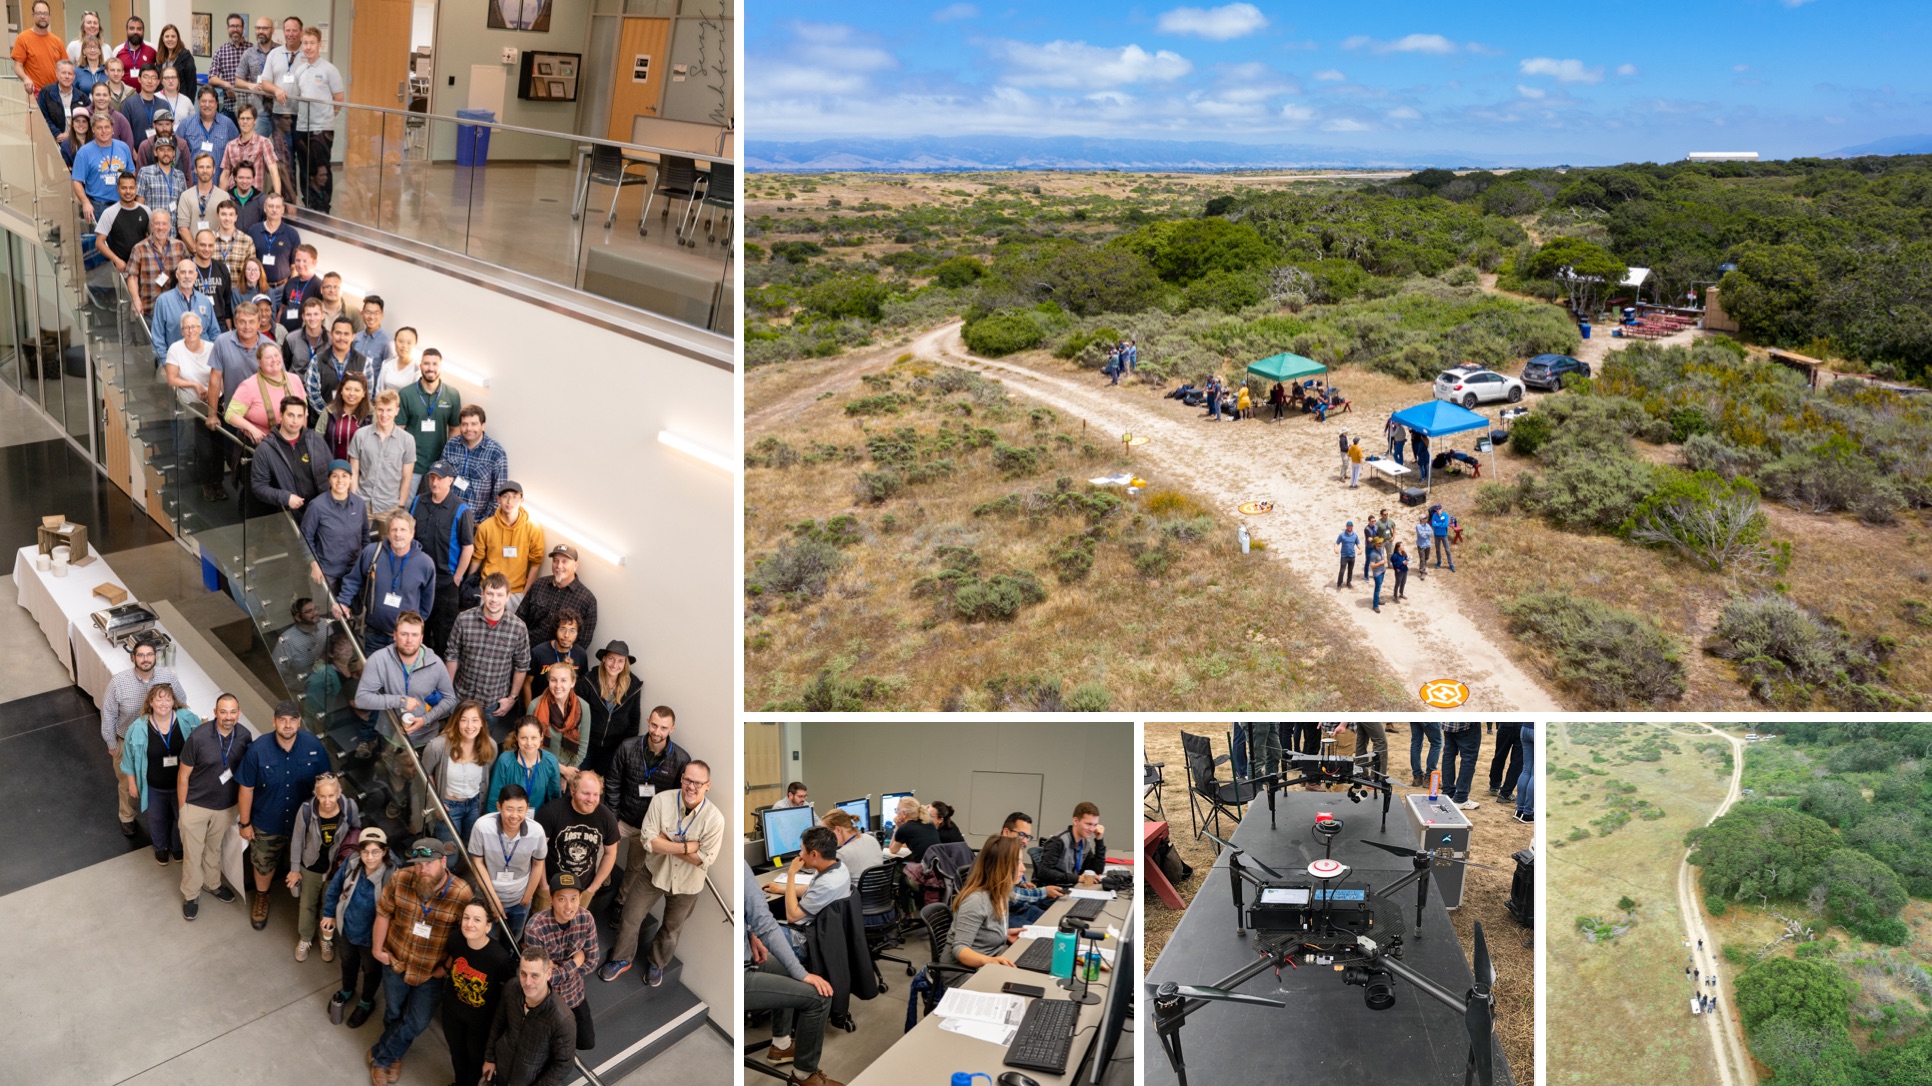
The analysts on the project were Rezahn Abraha, a UC Berkeley Society and Environment Major, and Ben Satzman, a UC Berkeley Conservation and Resource Studies Major with minors in Sustainable Environmental Design and GIS. Both worked in collaboration with MBC and the Kellylab to find, clean, visualize, and analyze statewide data. Personnel involved in the project are: from Mapping Black California - Candice Mays (Partnership Lead), Paulette Brown-Hinds (Director), Stephanie Williams (Exec Editor, Content Lead), and Chuck Bibbs (Maps and Data Lead); from the Kellylab: Maggi Kelly (Professor and CE Specialist), Chippie Kislik (Graduate Student), Christine Wilkinson (Graduate Student), and Annie Taylor (Graduate Student).
We thank the Rausser College of Natural Resources who funded this effort.
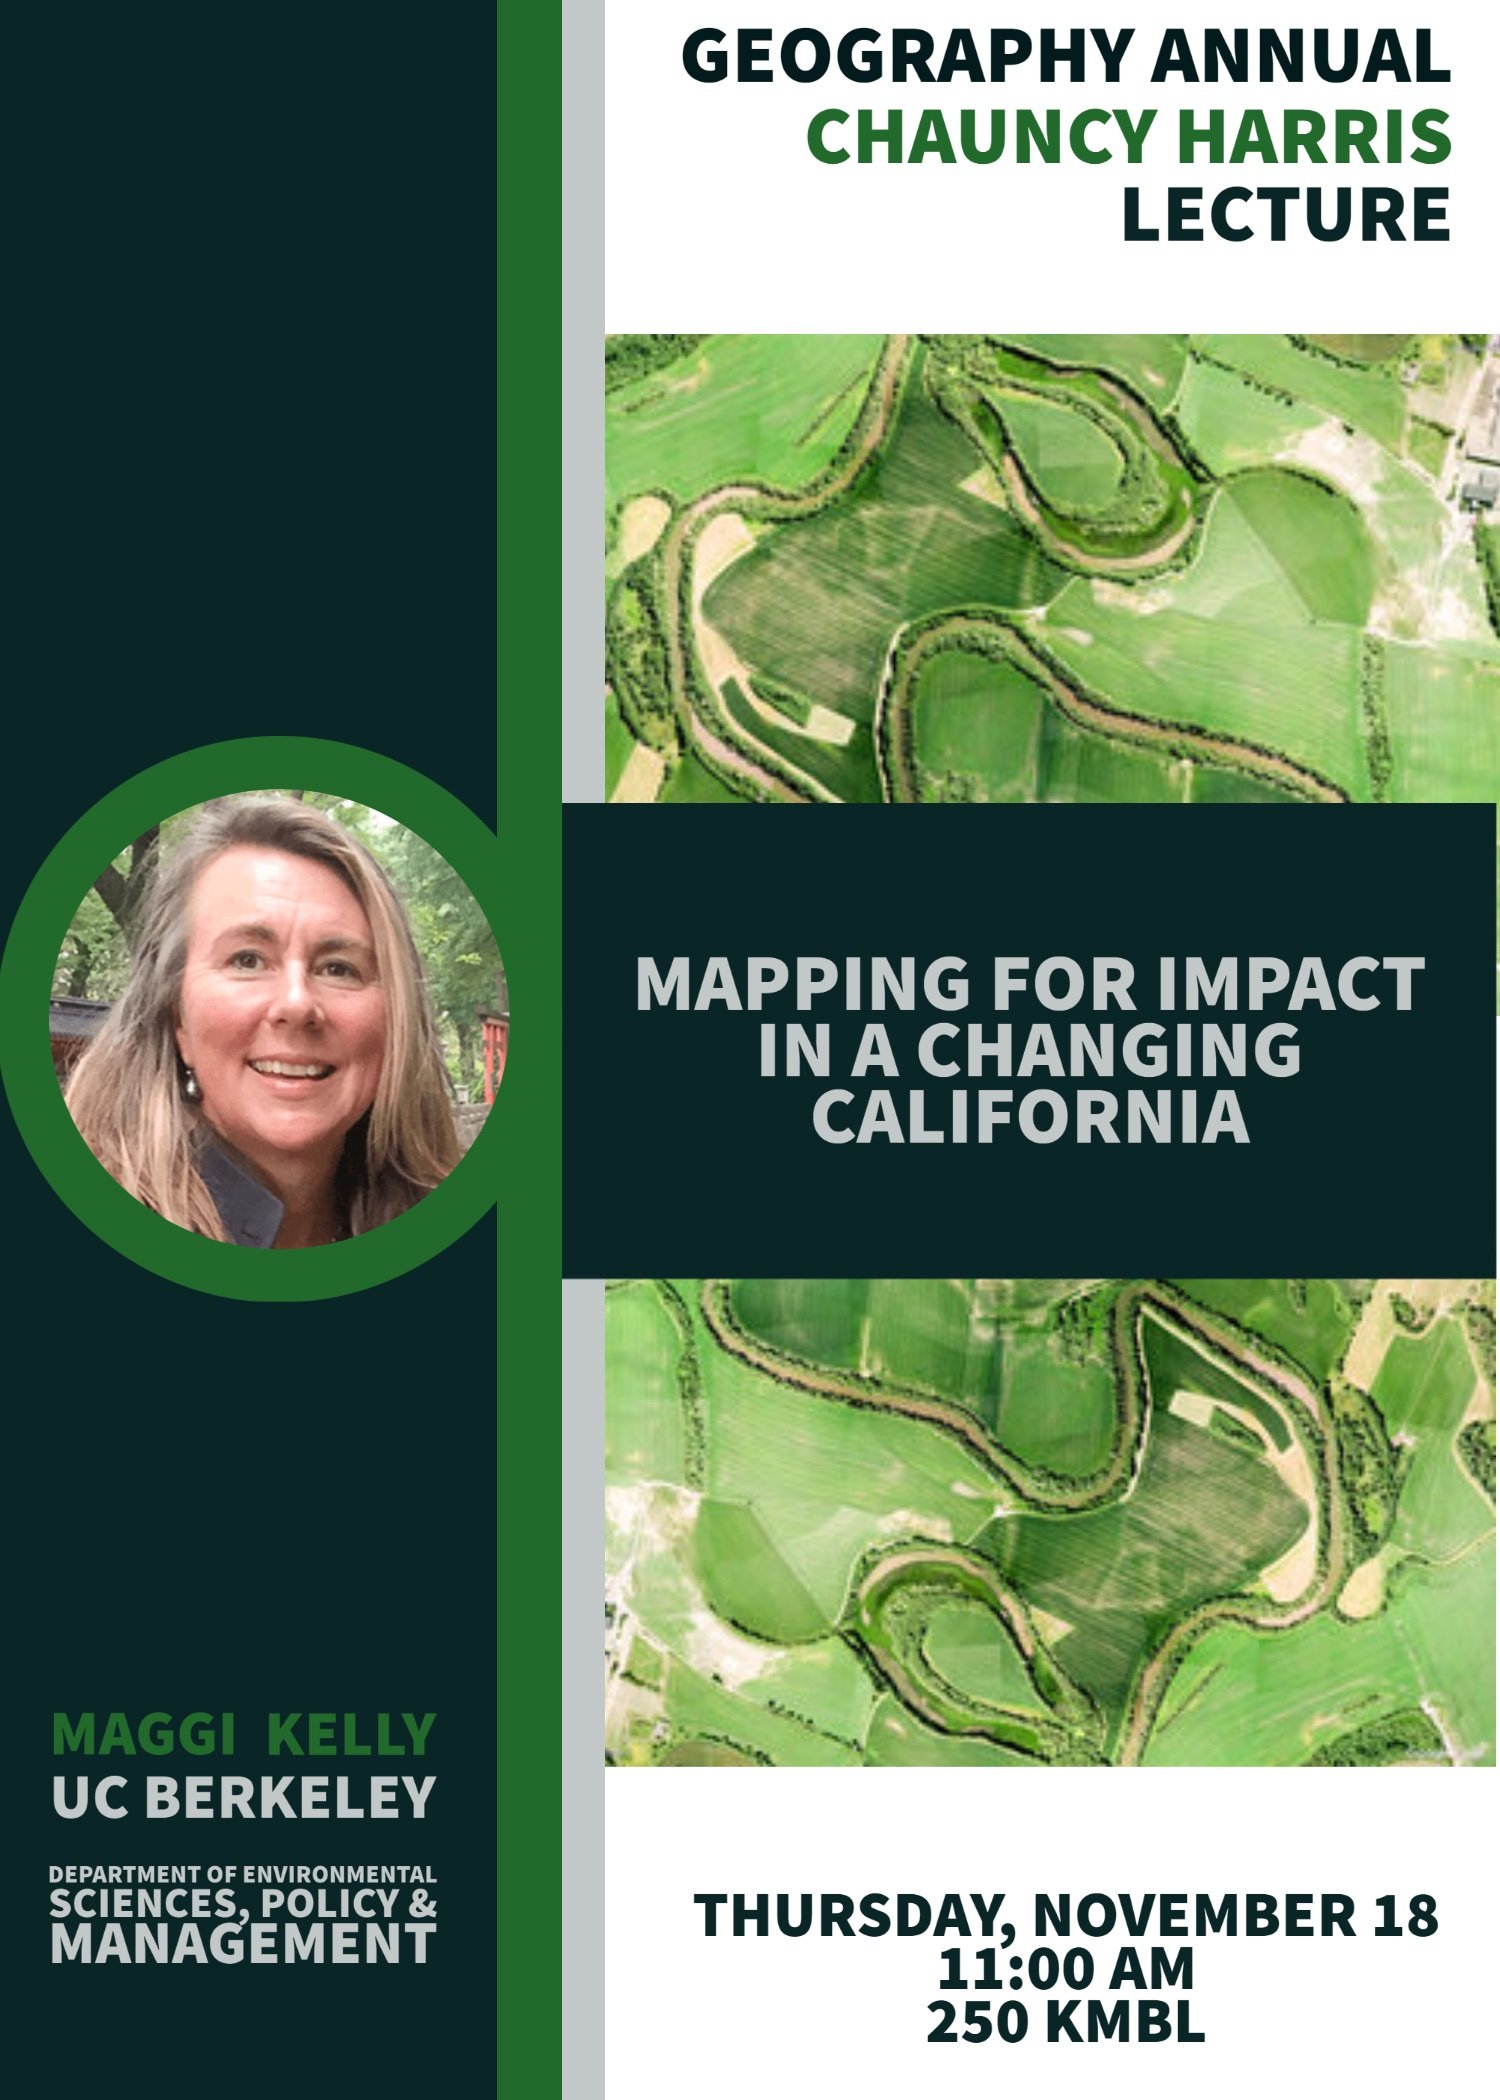
Fall 2020 Story Map: Mapping Police Spending in California Cities. Examine Southern California and the Bay Area in detail, check out a few interesting cities, or search for a city and click on it to see just how much they spent on policing in 2017.
Spring 2021 Story Map: How Do California Cities Spend Money on Policing? Mapping the variability of police spending from 2014-2019 in 476 California Cities.