forests to faucets: cool new tool from the forest service
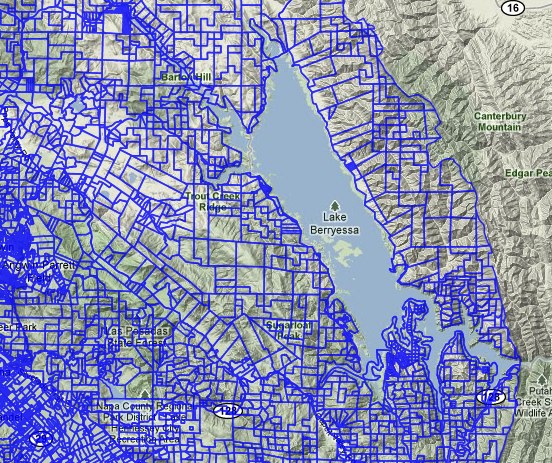
The US Forest Service has released their "forest to faucet" program last week. It looks at the importance of forests to surface water. Built in ArcGIS server, it quickly maps, by watershed:

  • Surface Drinking Water Importance Index   
  • Index of Forest Importance to Surface Drinking Water   
  • Index of insect and disease threat to forests important to surface drinking water   
  • Index of development threat to forests important to surface drinking water
  • Index of wildland fire threat to forests important to surface drinking water

Check it out: http://www.fs.fed.us/ecosystemservices/FS_Efforts/forests2faucets.shtml

Wetland restoration reduces sea level rise impacts over next 100 years in the SF Bay

sun setting on bay marshA new study led by Diana Stralberg at PRBO Conservation Science and including work done by our own Lisa Schile, projects a bleak future for San Francisco Bay’s tidal marshes under high-end sea-level rise scenarios that are increasingly likely. PRBO and colleagues found that in the worst case scenario 93% of San Francisco Bay's tidal marsh could be lost in the next 50-100 years (with 5.4 feet or 1.65 meters of sea-level rise, low sediment availability and no significant restoration). Not all marshes will be lost and restoration currently underway can keep more marshes intact as sea levels rise.

"Tidal marshes are incredibly resilient to changes in sea level, depending on how fast seas rise and how much sediment is available.  Unfortunately, marshes cannot keep up with the high-end sea-level rise predictions on their own.  They will need our help.” said Diana Stralberg, the study lead author of PRBO and the University of Alberta.

Our study was published this week in the high-impact journal PLoS ONE. To view maps of where the marshes will be under various scenarios over the next 100 years, visit www.prbo.org/sfbayslr. News coverage from SF Chronicle here. CNR coverage here.

A wrap-up of the news surrounding Supreme Court's foray into GPS + privacy

United States vs. Jones raises questions about the limits of police searches, personal privacy and the use of new technology in law enforcement. At issue is whether police need warrants to attach GPS tracking devices to a cars to monitor suspects' movements for indefinite periods of time.

Stay tuned for more analysis. From NPR, some indication that the Supreme Court was not happy with un-warranted GPS tracking. The justices were told police could slap GPS devices on their cars and track their movements, without asking a judge for advance approval.

Also an interesting take from Wired: A number of Supreme Court justices invoked the specter of Big Brother while hearing arguments Tuesday over whether the police may secretly attach GPS devices on Americans’ cars without getting a probable-cause warrant.

While many justices said the concept was unsettling, the high court gave no clear indication on how it will rule in what is arguably one of the biggest Fourth Amendment cases in the computer age. The Obama administration maintains that Americans have no privacy rights when it comes to their movements in public.

Another informative opinion piece from the Washington Post.

Google acquires facial recognition technology company

Missed this earlier, but found it in prep for my privacy and GIS lecture. The article is excerpted here:

Google has acquired a seven-year-old company that develops facial-recognition technology for images and video, though the Web-search giant didn’t say what it plans to do with it.

Regarding face recognition, the spokesman said, “We’ve said that we won’t add face recognition to our apps or product features unless we have strong privacy protections in place, and that’s still the case.”

Google has said it built facial recognition technology for smartphones into a product known as Google Goggles, but withheld it. “As far as I know, it’s the only technology that Google built and after looking at it, we decided to stop,” said Google Chairman Eric Schmidt last month at a conference. “People could use this stuff in a very, very bad way as well as in a good way.”

Google Goggles is pretty sweet, by the way.

Google Maps to charge for heavy usage

Trick or Treat! Looks like users of Google Map links for their websites will be charged for heavy usage of the service. This from the BBC:

From 1 January 2012, Google will charge for the Google Maps API service when more than the limit of 25,000 map "hits" are made in a day. Websites, especially travel firms, use Google Maps to link customers to a view of the destinations they inquire about.

Cal-Adapt featured on SmartPlanet

Smartplanet recently produced a video featuring Cal-Adapt.  See it here!

At UC Berkeley's Geospatial Innovation Facility software developers are building a Web-based mapping tool to help scientists prepare for the changing climate conditions in California. The team has culled data from various climate research organizations to get projection data of what different climates might look like over a 150-year period. SmartPlanet visits the lab to see a demo of how the tool works.

3D Street level mapping with earthmine


earthmine's Anthony Fassero visited yesterday to give a Geolunch presentation and blew us away with the amazing technology that they are employing!  Anthony, and Co-Founder John Ristevski started earthmine just a few years ago after graduating from Cal. 

earthmine has developed the camera system and engineering to take high resolution 3d street level images using only photogrammetric techniques (no lidar), as well as software tools that allow users to work with the data directly in ArcGIS and other geospatial applications. These tools allow you to not only view the data alongside a map, but to actualy make 3d measurements one the fly and edit ancillary data layers from within the phot view.

You have to see it for yourself!  Check out this video to see teh data and tools in action.

Berkeley Earthquake Visualized Through Tweets

Eric Fischer created a set of interesting animations that visualize the location and number of tweets related to the two earthquakes in Berkeley yesterday (afternoon and evening) over 12 minutes. This is technically measuring the level of discussion about the earthquakes. The animations where created with data from the Twitter streaming API.

Click here to view the video.

The left animation shows tweets about the afternoon earthquake and the right shows tweets about the evening earthquake. Green circles are tweets about the earthquakes and gray circles are tweets about everything else.

Here is one he made for the Virginia quake in August: Video.


GeoData @ Berkeley: find your Cali data here!

Search & find GIS data

GeoData@UC Berkeley: is the UC Berkeley Libraries' geoportal where users can search, preview, display, map, and download geospatial data in a variety of formats.

The Earth Sciences & Map Library collects GIS data for areas around the world, with an emphasis on the nine county San Francisco Bay Area and northern California, and makes it available for use on the GIS workstations. Library users can download freely available data to use in their projects. The library also collects licensed GIS data that is accessible by library users who are affiliated with UC Berkeley.

This example at left is a snapshot of Napa County parcel data.

http://gis.lib.berkeley.edu:8080/openGeoPortalHome.jsp

New and improved ASTER GDEM released

NASA and Japan’s Ministry of Economy, Trade and Industry released yesterday a new and improved version of their ASTER global digital elevation model (GDEM) which was first released in 2009. This new and improved version offers improved spatial resolution, horizontal and vertical accuracies, and more realistic coverage over water bodies with the ability to identify water bodies as small as 1 km in diameter. This new data is now comparable to NASA's Shuttle Radar Topography Mission DEM data. The new ASTER GDEM covers 99 percent of the Earth’s landmass at 30 meter spatial resolution. It is free to download here. For information on the improved version see here and here.

ASTER DEM of Grand Canyon National Park in northern Arizona July 14, 2011 from space.com. Credit: NASA/GSFC/METI/ERSDAC/JAROS, and U.S./Japan ASTER Science Team

To map or not to map

A recent post by Matt Ericson from the New York Times on the importance of knowing when to map geographic data and when not to. He states that we are sometimes too quick to map geographic data. In some cases a chart or table can better represent geographic information and tell a more effective story. In some cases there are no better alternatives than to map geographic data. The important thing is to remember that there are multiple avenues of presenting geographic data in which a map may or may not always be the best form to convey data and ideas. In the post he also provides examples of some cases he has run in to where a map and where a table has provided a more effective means of geographic data presentation.

See the full post here.

Cal-adapt in the news: sea level rise needs to be considered in planning

The Bay Conservation and Development Commission (BCDC) recently voted on the planning process in the bay area. They approved a first-of-its kind policy that makes sea level rise part of regional planning decisions. The new rules require developers to plan for rising sea levels in their proposals for waterfront property. Business groups and cities cried foul when the policy was first released, saying it would hurt economic development. The KQED News post features our Cal-Adapt site. More here.

India-Pakistan border as seen from space

From NASA re-posted via Bostom.com's The Big Picture photojournalist website comes this fascinating, geographically-pertinent image: "The India-Pakistan border appears as an orange line in this photograph taken by the Expedition 28 crew on the International Space Station on August 21, 2011. The fence between the two countries is floodlit for surveillance purposes. Srinagar (left), Islamabad (bottom center), Lahore (center near the border line) and Delhi (top center) can be seen as brighter spots. (NASA/Handout/Reuters)#"

Privacy and the web

An interesting article about the use of social-media, such as facebook, for employment background checks.

The article points out that "some companies are mining photo- and video-gathering sites using facial-recognition software" so a person could still be identified by potential employers in seemingly anonymous photos.

http://www.marketwatch.com/story/could-you-pass-a-facebook-background-check-2011-07-25


SOD: still spreading in the bay area

A nice article in SF Chron on Matteo's citizen science approach to mapping new SOD spread.

The article states: The deadly pathogen known as sudden oak death is spreading throughout the Bay Area, infecting more trees in more places than have ever been seen before, according to scientists tracking the disease. The Forest Pathology and Mycology Laboratory at UC Berkeley used 10,000 tree and plant samples collected by 500 citizens between April and June this year to document a dramatic increase in the infection rate from Napa to the Carmel Valley and virtually everywhere in between.

U.S. Forest Service and UC study ways to reduce wildfire severity

New article in the UC Green Blog on our SNAMP project, written by Kim Ingram. Includes some great field pics!

The University of California Cooperative Extension (UCCE) recently co-hosted a field trip with the U.S. Forest Service to view the implementation of a forest fuels reduction project on the Tahoe National Forest.

Over 45 stakeholders, including representatives of state, federal, and local government, industry and environmental groups and local residents attended to see the project, known as the "Last Chance Project," which involves thinning the forest by removing small and medium-sized trees, masticating or mowing down brush, and burning dead material through prescribed fire. The work, being done by Sierra Pacific Industries, under contract to the U.S. Forest Service, should be completed by fall 2012.

MIT releases new Urban Network Analysis Tool for ArcGIS 10

The MIT City Form Research Group recently released a new open-source plugin for ArcGIS 10 to perform advanced spatial analyses on network data such as urban street networks. The tool can give researchers a better understanding of how the spatial layout of cities and their social, economic, and environmental processes affect the way people live in it.

The tool measures reach, gravity, betweenness, closeness, and straightness on spatial networks. This means you can assess the number of services or resources within a certain walking distance and can analyze the volume of traffic along sidewalks and streets. Like other network analysis tools, the tool evaluates network element geometry and distance and distinguishes between shorter and longer links. What is unique about this tool is that it not only operates with node and edge elements like other network analysis tools, but it can also incorporate additional network elements such as buildings. Individual buildings or objects can be characterized within spatial networks and can be weighted to give more or less influence. For example, more populated buildings can be set to have a greater impact on results. The tool can also be used to assess urban growth and change.

Click here for the press release.

Travel time and housing prices map

Our Bay Area regional planning agencies have just released a new interactive map that lets you visualize your housing options given your employment location, income, and desired commute time and mode. It's all part of the regional planning efforts that are happening statewide as a result of SB 375, which requires the integration of housing and land use planning to encourage people to drive less.

The press release gives more details: "If you're in the market to buy a home in the Bay Area, wouldn't it be nice to know how long it would take to commute from neighborhoods in your price range to your work place? Well, now you can, thanks to a new mapping tool on OneBayArea.org.

The interactive map shows you approximately how far you can get from any address within the nine-county region by car, public transit, bike, or on foot, at different times of the day. You can customize your view by the travel time between areas, and the median price of homes in each area."

Animal tracking with "Smart Collars"

There is an interesting arcticle in today's New York Times about the use of a new breed of animal tracking collars that use on board computers to track valuable information about an animal, beyond location alone.  The new "smart collars" can be used to track when an animal is sleeping, when it is feeding, and lots of other metrics.  The additional data being gathered gives biologists more information to work with while trying to understand the animals habits and needs, in order to provide informed wildlife management decisons.