AAG Boston 2017 Day 1 wrap up!

Day 1: Thursday I focused on the organized sessions on uncertainty and context in geographical data and analysis. I’ve found AAGs to be more rewarding if you focus on a theme, rather than jump from session to session. But less steps on the iWatch of course. There are nearly 30 (!) sessions of speakers who were presenting on these topics throughout the conference.

An excellent plenary session on New Developments and Perspectives on Context and Uncertainty started us off, with Mei Po Kwan and Michael Goodchild providing overviews. We need to create reliable geographical knowledge in the face of the challenges brought up by uncertainty and context, for example: people and animals move through space, phenomena are multi-scaled in space and time, data is heterogeneous, making our creation of knowledge difficult. There were sessions focusing on sampling, modeling, & patterns, on remote sensing (mine), on planning and sea level rise, on health research, on urban context and mobility, and on big data, data context, data fusion, and visualization of uncertainty. What a day! All of this is necessarily interdisciplinary. Here are some quick insights from the keynotes.

Mei Po Kwan focused on uncertainty and context in space and time:

  • We all know about the MAUP concept, what about the parallel with time? The MTUP: modifiable temporal unit problem.
  • Time is very complex. There are many characteristics of time and change: momentary, time-lagged response, episodic, duration, cumulative exposure
    • sub-discussion: change has patterns as well - changes can be clumpy in space and time. 
  • How do we aggregate, segment and bound spatial-temporal data in order to understand process?
  • The basic message is that you must really understand uncertainty: Neighborhood effects can be overestimated if you don’t include uncertainty.

As expected, Michael Goodchild gave a master class in context and uncertainty. No one else can deliver such complex material so clearly, with a mix of theory and common sense. Inspiring. Anyway, he talked about:

  • Data are a source of context:
    • Vertical context – other things that are known about a location, that might predict what happens and help us understand the location;
    • Horizontal context – things about neighborhoods that might help us understand what is going on.
    • Both of these aspects have associated uncertainties, which complicate analyses.
  • Why is geospatial data uncertain?
    • Location measurement is uncertain
    • Any integration of location is also uncertain
    • Observations are non-replicable
    • Loss of spatial detail
    • Conceptual uncertainty
  • This is the paradox. We have abundant sources of spatial data, they are potentially useful. Yet all of them are subject to myriad types of uncertainty. In addition, the conceptual definition of context is fraught with uncertainty.
  • He then talked about some tools for dealing with uncertainty, such as areal interpolation, and spatial convolution.
  • He finished with some research directions, including focusing on behavior and pattern, better ways of addressing confidentiality, and development of a better suite of tools that include uncertainty.

My session went well. I chaired a session on uncertainty and context in remote sensing with 4 great talks from Devin White and Dave Kelbe from Oak Ridge NL who did a pair of talks on ORNL work in photogrammetry and stereo imagery, Corrine Coakley from Kent State who is working on reconstructing ancient river terraces, and Chris Amante from the great CU who is developing uncertainty-embedded bathy-topo products. My talk was on uncertainty in lidar inputs to fire models, and I got a great question from Mark Fonstad about the real independence of errors – as in canopy height and canopy base height are likely correlated, so aren’t their errors? Why do you treat them as independent? Which kind of blew my mind, but Qinghua Guo stepped in with some helpful words about the difficulties of sampling from a joint probability distribution in Monte Carlo simulations, etc. 

Plus we had some great times with Jacob, Leo, Yanjun and the Green Valley International crew who were showcasing their series of Lidar instruments and software. Good times for all!

GIF Bootcamp 2017 wrap up!

Our third GIF Spatial Data Science Bootcamp has wrapped!  We had an excellent 3 days with wonderful people from a range of locations and professions and learned about open tools for managing, analyzing and visualizing spatial data. This year's bootcamp was sponsored by IGIS and GreenValley Intl (a Lidar and drone company). GreenValley showcased their new lidar backpack, and we took an excellent shot of the bootcamp participants. What is Paparazzi in lidar-speak? Lidarazzi? 

Here is our spin: We live in a world where the importance and availability of spatial data are ever increasing. Today’s marketplace needs trained spatial data analysts who can:

  • compile disparate data from multiple sources;
  • use easily available and open technology for robust data analysis, sharing, and publication;
  • apply core spatial analysis methods;
  • and utilize visualization tools to communicate with project managers, the public, and other stakeholders.

At the Spatial Data Science Bootcamp we learn how to integrate modern Spatial Data Science techniques into your workflow through hands-on exercises that leverage today's latest open source and cloud/web-based technologies. 

ISECCI historical ecology working group wrap-up

Last week Kelly and I with others travelled to the Sierra Nevada Aquatic Research Lab (SNARL) in the eastern Sierra Nevada, just south of Mono Lake for a research retreat. SNARL is part of the UC's Natural Reserve System, which is comprised of nearly 40 properties across the state. These are preserves that foster research, education and collaboration. They have much in common with ANR's REC system. I've been to a few of them now, and am very pleased to make more visits. I love the east side of the Sierra, and that iconic Highway 395. 

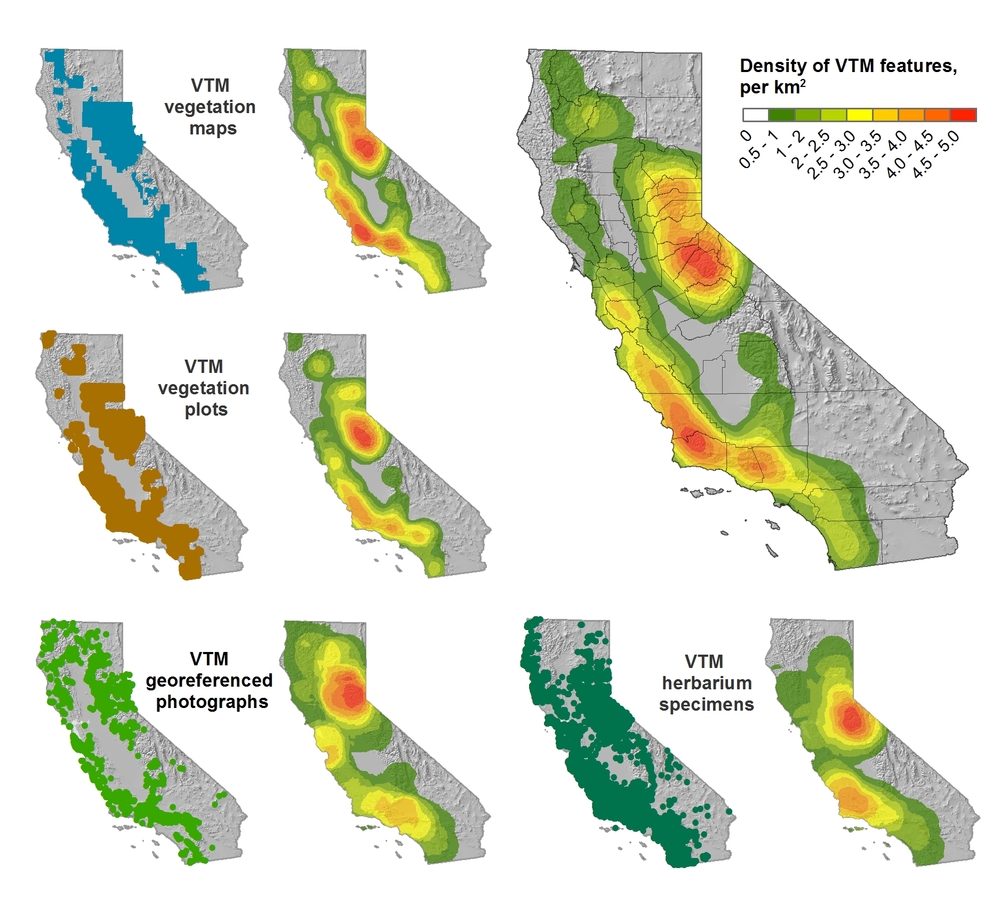
This trip was a retreat for the ISECCI historical ecology working group, led by the inspirational Peter Alagona from UCSB. We discussed our existing projects, including the VTM work (see figure below), and talked about potentials for more collaborative research and further integration between NRS and ANR. We have a list of wishes for digitization, and if anyone out there has ideas about pitching these to donors, please let me know. For example: 

  • Kelly and I want to digitize the Leiburg maps from the northern Sierra to add to the VTM stack;
  • We want to find a better way to index and view historical aerial photography state-wide. Something like this for historical maps: http://ngmdb.usgs.gov/maps/TopoView/help/

And we had a field trip looking at Mono Lake water issues. Great time spent!

Density of VTM features across the collections

I for one welcome our ESRI overloards: Wrap Up from the 2016 ESRI User Conference

What a full week! Here is my wrap-up from a great 2016 ESRI User Conference.

I haven't been here in many years, and I am glad I came. I learned much, and have some new ideas for workshops and classes, and how IGIS can be more of service to ANR, and I got started on ArcGIS Pro - ESRI's eventual replacement for ArcGIS Desktop. Pro has a completely new user interface that is very clear; you can visualize, edit, and perform analysis in both 2D and 3D; it is super fast via multithreading & 64-bit processing (finally), and it has new icons and a bunch of new processing tools. A bunch of very cool stuff comes with 1.3 soon. 

Day 1: Monday was spent in big-picture, inspirational talks from camera beautiful GIS people. 15,000 in the audience, 10 massive screens. I loved it, I felt like I was at a really intense but sedate rock concert. Note to ESRI: could you put the chairs any closer together? The highlight was speaker keynote Andrea Wulf, talking about her obsession with Alexander Von Humboldt.  Note to self: get the book. In addition to the big picture stuff, Day 1 is ESRI's chance to highlight this year's software improvements as we continue the voyage away from the desktop workflow: Pro, integrated 3D, green design, Apps, seamless integration with the web. 

Day 2: Tuesday focused on workshops. I picked four workshops from the Spatial Statistics Team at ESRI. These were led by Lauren Bennett and her crew (Flora Vale, Jenora D'Acosta). Uniformly fantastic. I had downloaded Pro the night before, and with some trepidation got started and followed along. I am happy to report that it seems very intuitive. I have read elsewhere about worries that there is loss of cartographic control, and I will look into that. I learned about the Spatial Stats toolbox in Pro, and some very new capacity in optimization of pattern analysis (you know how difficult it is to pick that distance kernel), and in the new space-time cube capabilities. The space-time capabilities make very complex analyses doable, and are very exciting, but still a bit constraining if you don't know how to update the code. Oh yeah, and space-time uses netCDF format. 

Day 3: For Wednesday's workshops I chose workshops that would help me update class labs: Python + Raster analysis; Site suitability in Pro; Cost Connectivity in Pro; and some crazy cool prediction tool called Empirical Baysien Kriging, which I will be checking out.  I guess EBK has been around for awhile, but now implemented in ESRI software. The new suite of tools in site suitability + connectivity are going to be key. Kevin M. Johnston and Elizabeth Graham led the Site Suitability and Connectivity, and Eric Krause led the Kriging workshop. 

Day 4: All day was spent in Pix4D immersion with the excellent Pix4D support/training team. Pix4D is the gold standard for drone imagery workflow; it also serves as the backend engine for ESRI's Drone2Map application, which I have not tried. Most of the morning was spent in basics: workflow basics, application domains, super wow factor examples like 0.5cm resolution imagery processing. We also looked at workflow and best practices, accuracy, and some example projects. The room was full of 50+ people, many with specific questions about a range of projects. Got to hang out a bit with Greg Crustinger, who is now at Parrot. Even more excited now about our new Sequoia cameras. 

Thoughts:

  • Little Italy has some great restaurants. 
  • We need to move to Pro soon. Probably not in time for Fall's class, but soon. GIF and IGIS workshops are going to have to get updated. 
  • I need to get more in touch with imagery analysis in Pro. Especially with the segmentation and classification part. 
  • I want to recreate the workflow for site suitability + locate regions + cost connectivity soon. 
  • The ability to perfom complex analyses in a GUI is increasingly easy, but is that a good thing? We have to be increasingly vigilant about training the fundamentals as well. 
  • One frustration about these workshops that I bet my workshop participants share - the data all is perfect, and ready to go. We need to keep talking about where to get data, and how to wrangle it into shape. 
  • Could drones mean the resurrection of photogrammetry? At least in the classroom?

Trends: 

  • Hyper granularity: how do we processes these increasingly fine resolution datasets? 
  • Global to local focus in modeling: GWR, optimized Getis-Ord, empirical baysien kriging all try to deal with and model local variability across a complex study area;
  • Incorporation of permutations and distribution functions in modeling has been made way easier;
  • Big Data, multidimensional data, temporal data: ESRI is really trying to be a better informatics platform for research;
  • ESRI seems to be increasingly relying on external and open standards for new data formats/products; this is a great trend;
  • Decision-making: all these analyses need to support decision-making; communication remains critical, tools for web-based interaction continue to expand.

AAG 2016 wrap up

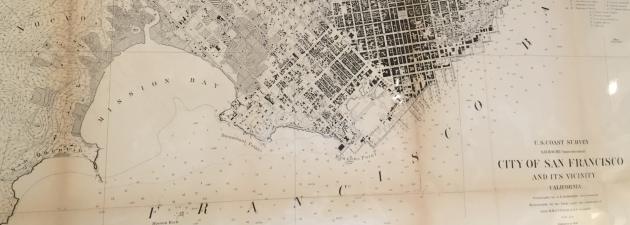
1870s-ish map of SFAside from all the sunshine, architecture, maps, and food, at the 2016 AAG conference Kelly and I participated in four organized sessions on Historical Ecology. On Saturday, we heard from a number of fantastic researchers, and here is my wrap-up.  (Alas, these sessions overlapped with sessions on CyberGIS, Who says you can't be interestd in both? cyber-historical-environmental-spatial-data-science.)
  • History: We heard from researchers working on data from the Holocene, to pre-history, to the 20th century.
  • Focus: Ecosystems included prairie, forests (Maryland, New York, California, Florida, Ohio); and Wetlands (China, California, etc.); Land Use and Agriculture (Mexico, Brazil); Fire (Arizona); and biological collections. 
  • Data included inventory (PLS system: land appraisal value; Cadastral surveys); Imagery (Landsat, aerial imagery); and biological (paleo; tree ring; resurveys; pollen records; bird census; and PLS system: witness trees, survey lines, FIA data). 
  • Methods: Comparison between past and present from existing inventory data, as well as comparison between historic and modern resurveys; digitization of multiple data sources; narrative analysis; ecological modeling; ecosystem services modeling; fire behavior modeling; OBIA of historic imagery; and some really neat modeling work. 
  • Emerging Themes from the sessions included: 
    • Data. Most people used digital data from an existing source - websites, clearinghouse, existing digital source. Many digitized their data. One person used an API. 
    • Accuracy. About half of speakers have thought about, or incorporated understanding of data quality or uncertainty in your work; but this is difficult to do quantitatively. Some people use the 'Multiple lines of evidence' from diverse datasets to increase confidence in results. 
    • Tools. We heard about a number of tools, including GIS as desktop tool, Open tools, Backcasting with landcover models, Complex modeling approaches, One paper used OBIA methods, and one paper discussed Big historic data (maybe moving toward the cyberGIS overlap). 
    • Theoretical frameworks: A few papers used resilience as a framework, social, ecological and coupled; and several papers used a landscape ecology framework. 
    • New terms: I learned a new term: “Terrageny”: a record of how a landscape became fragmented through time, containing information on the ‘ancestry’ of fragments and showing how an initially continuous landscape was progressively divided into fragments of decreasing size. Ewers et al. 2013. Gorgeous word. Must incorporate into cocktail party discussion. 

We also sent out a survey to the speakers prior to the talks, and here are some preliminary results. 

Question: What are the three top challenges that you see for historical ecology research?
  • Data/Logistical/Availability
    • The further back in time we look, the more sparse the data. 
  • Technical 
    • Lack of metadata: Current data deluge may attract attention/urgency away from the discovery and digitization of historical data;
    • Few models capable of incorporating human and environment interactions over long time scales. 
  • Theoretical
    • Maintaining perceived relevance in the context of the novel ecosystem/no-analog system conversation - not having historical ecology be the baby that is thrown out with the bathwater.
  • Operational 
    • Many respondants mentioned issues with funding - these projects are by nature interdisciplinary, often require large programs to fund at achievable levels, and not many funding sources exist.
  • Communication
    • We need to focus on communicating the importance of understanding past conditions to inspire and guide current design proposals. 
Question: What exciting future directions do you envision for historical ecology research?
  • The importance of historical data and analysis:
    • Historical data is essential: Multi- Inter-disciplinary research needs historical research, particularly so that we can understand 1) historical reference conditions, but also so that we can understand 2) when we might have novel interactions between species and ecosphere. 
  • Practicality of historical data and analysis: 
    • Historical ecology is critical for restoration projects and for studying climate change, and for its power to communicate through environmental education with the public.
  • New data/Big data/Data Fusion: 
    • Increase in digitally available historical sources (longer ecological and climate records and reconstructions), plus the availability of large, high-resolution datasets to assess change (thinking LiDAR, government reports, survey data...)  
    • There is also increasing sophistication of analysis and visualization tools.
    • But, the current data deluge may attract attention/urgency away from the discovery and digitization of historical data.

A fantastic time was had by all!

Spatial Data Science Bootcamp 2016!

Last week we held another bootcamp on Spatial Data Science. We had three packed days learning about the concepts, tools and workflow associated with spatial databases, analysis and visualizations. Our goal was not to teach a specific suite of tools but rather to teach participants how to develop and refine repeatable and testable workflows for spatial data using common standard programming practices.

2016 Bootcamp participants

On Day 1 we focused on setting up a collaborative virtual data environment through virtual machines, spatial databases (PostgreSQL/PostGIS) with multi-user editing and versioning (GeoGig). We also talked about open data and open standards, and moderndata formats and tools (GeoJSON, GDAL).  On Day 2 we focused on open analytical tools for spatial data. We focused on Python (i.e. PySAL, NumPy, PyCharm, iPython Notebook), and R tools.  Day 3 was dedicated to the web stack, and visualization via ESRI Online, CartoDB, and Leaflet. Web mapping is great, and as OpenGeo.org says: “Internet maps appear magical: portals into infinitely large, infinitely deep pools of data. But they aren't magical, they are built of a few standard pieces of technology, and the pieces can be re-arranged and sourced from different places.…Anyone can build an internet map."

All-in-all it was a great time spent with a collection of very interesting mapping professionals from around the country. Thanks to everyone!

It's AAG time again!

The annual AAG conference is rolling into town next week, and several of us will be there. 

  • Kelly and Jenny will be presenting; 
    • Kelly: Disentangling drivers of change in California Forests: management and climate 
    • Jenny: Spatial Data Science for Collaborative Geospatial Research
  • Alice is a discussant on THREE panels; and 
  • I am a discussant on the Historical Ecology session. 

Former kellylabbers will also be in force: 

  • John Connors is presenting (and organizing, and morderating, and all kinds of things): 
    • Disentangling Diversity: Agrobiodiversity, Livelihoods, and Food Security in the Kilombero Valley, Tanzania
  • Desheng Liu will be there: 
    • Reconstructing Land Cover Trajectories from Dense MODIS Time Series
  • Ellen Kersten will be presenting:
    • Got health? Using spatial and temporal analysis to achieve health equity for children 

 Have a great time everyone! (If I have missed anyone, let me know!)

ESRI @ GIF Open GeoDev Hacker Lab

We had a great day today exploring ESRI open tools in the GIF. ESRI is interested in incorporating more open tools into the GIS workflow. According to www.esri.com/software/open, this means working with:

  1. Open Standards: OGC, etc.

  2. Open Data formats: supporting open data standards, geojson, etc.

  3. Open Systems: open APIs, etc.

We had a full class of 30 participants, and two great ESRI instructors (leaders? evangelists?) John Garvois and Allan Laframboise, and we worked through a range of great online mapping (data, design, analysis, and 3D) examples in the morning, and focused on using ESRI Leaflet API in the afternoon. Here are some of the key resources out there.

Great Stuff! Thanks Allan and John

Spatial Data Science Bootcamp March 2016

Register now for the March 2016 Spatial Data Science Bootcamp at UC Berkeley!

We live in a world where the importance and availability of spatial data are ever increasing. Today’s marketplace needs trained spatial data analysts who can:

  • compile disparate data from multiple sources;
  • use easily available and open technology for robust data analysis, sharing, and publication;
  • apply core spatial analysis methods;
  • and utilize visualization tools to communicate with project managers, the public, and other stakeholders.

To help meet this demand, International and Executive Programs (IEP) and the Geospatial Innovation Facility (GIF) are hosting a 3-day intensive Bootcamp on Spatial Data Science on March 23-25, 2016 at UC Berkeley.

With this Spatial Data Science Bootcamp for professionals, you will learn how to integrate modern Spatial Data Science techniques into your workflow through hands-on exercises that leverage today's latest open source and cloud/web-based technologies. We look forward to seeing you here!

To apply and for more information, please visit the Spatial Data Science Bootcamp website.

Limited space available. Application due on February 19th, 2016.

GIS Day Wrap Up (a bit late...)

GIS Day 2015! Happy 10th Birthday to the GIF! 

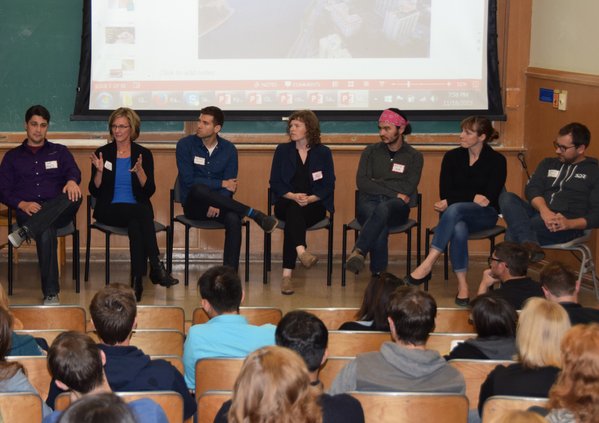
Panel of mapping innovators @ GIS Day 2015

A quick look at the past decade:

The GIF began in November 2015 on a wave of excitement around geospatial technology. In the months leading up to our first GIS Day in 2005, Google Maps launched, then went mobile; Google Earth launched in the summer; and NASA Blue Marble arrived. Hurricane Katrina changed the way we map disasters in real time. The opening up of the Landsat archive at no-cost by the USGS revolutionized how we can monitor the Earth's surface by allowing dense time-series analysis. These and other developments made viewing our world with detail, ease, and beauty commonplace, but these were nothing short of revolutionary - spurring new developments in science, governance and business. The decade since then has been one of intense innovation, and we have seen a rush in geospatial technologies that have enriched our lives immeasurably.

As 2015 ends we can recognize a similar wave of excitement around geospatial technology as we experienced a decade ago, yet one that is more diverse and far reaching than in 2005. This GIS Day we sought to highlight the societal benefit derived from innovators across academia, non-profits, government, and industry. 

GIS Day/GIF 10th Anniversary

On November 18 we co-hosted GIS Day with BayGeo (formerly BAAMA) as we have in the past and had well over 180 attendees. Our GIS Day featured posters, lightening talks, presentations, and a panel session that included local innovators from Bay Area Industry, Government, and Non-Profits. Our panel speakers included: Cindy Schmidt (NASA); Gregory Crutsinger (3D Robotics); Karin Tuxen-Bettman (Google); Ken-ichi Ueda (iNaturalist); Sara Dean (Stamen Designs); Jeffrey Miller (GeoWing); and Kyle Brazil (Urthecast). The discussion included what skills they look for in recruiting and where they see the geospatial world going in the next 5 years. It was a fun evening and personally, I learned a ton. Many levels of appreciation go out to those who spoke, those who came, and those who helped make the day happen. 

California Economic Summit wrap-up

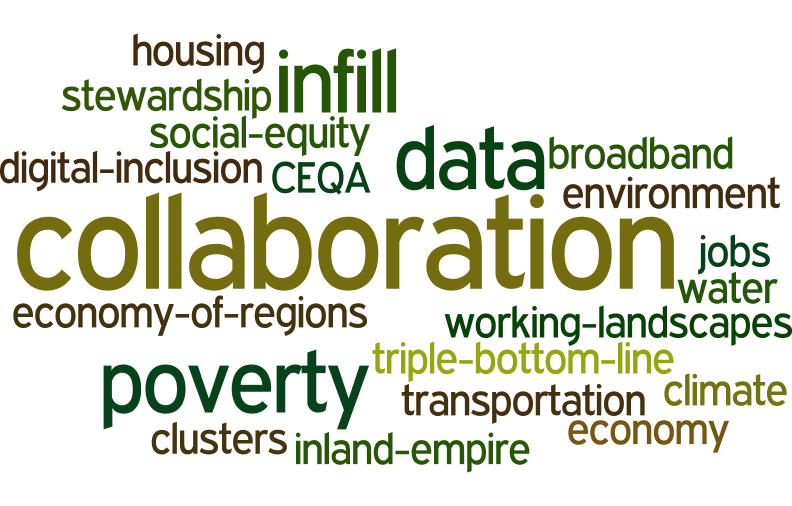
my wordle cloud on topics commonly discussed at the summit

I spent two days at the California Economic Summit, held this year in Ontario, heart of the "inland empire". I learned much about this region of the state that I know mostly as freeways connecting water polo games, or as endless similar roads through malls and housing developments. It is more populous, diverse, and vibrant than I had realized. The conference itself was very different from any that I have been to. Hardly any presentations, but break-out groups, passionate, inspiring panelists, tons of networking, good overviews, multiple perspectives, and no partisanship.

Here are some interesting facts about California that I did not know: 

  • 80% of CEQA lawsuits are related to urban infill development. Shocking. We need infill development as a sensible solution to a growing California. 
  • 1 in 3 children in the Central Valley live in poverty. 1 in 4 kids live in poverty in the inland empire. These rates are WORSE than they have been ever. 
  • The Bay Area is an anomaly in terms of education, income, health, voting rates, broadband adoption. The Bay Area is not representative of the state!
  • Think of a west-east line drawn across the state to demark the population halfway line. Where might it be? No surprise it is moving south. Now it runs almost along Wilshire Blvd in LA!
  • Empowering the Latino community in the state is going to be key in continued success. 
  • Broadband adoption around the state is highly variable: Latino, poor and disabled communities are far below other communities in terms of adoption. 
  • The first beer made with recyled water has been made by Maverick's Brewing Company. 
  • Dragon Fruit might be the new water-wise avocado. Good anti-oxidents, massive vitamin C, good fiber, etc. They taste a bit like a less sweet kiwi, with a bit of texture from the seeds. I don't think I'd like the quac, however. 
  • In 15 years, the state will be in a deficit of college graduates needed to meet skilled jobs. Those 2030 graduates are in 1st grade now, so we can do some planning. 
  • Access, affordability, and attainability are the cornerstones of our great UC system. 

In every session I attended I heard about the need for, and lack of collaboration between agencies, entities, people, in order to make our future better. Here is my wordle cloud of discussion topics, from my biased perspective, or course. 

Spatial Data Science @ Berkeley May 2015

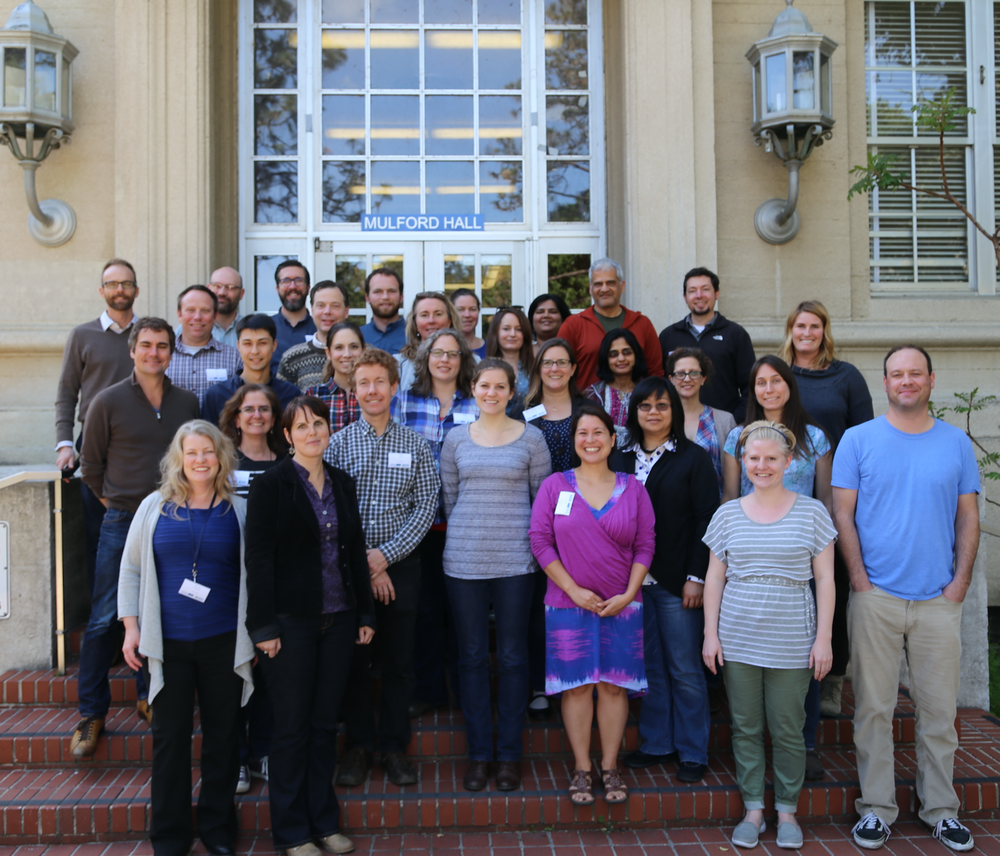
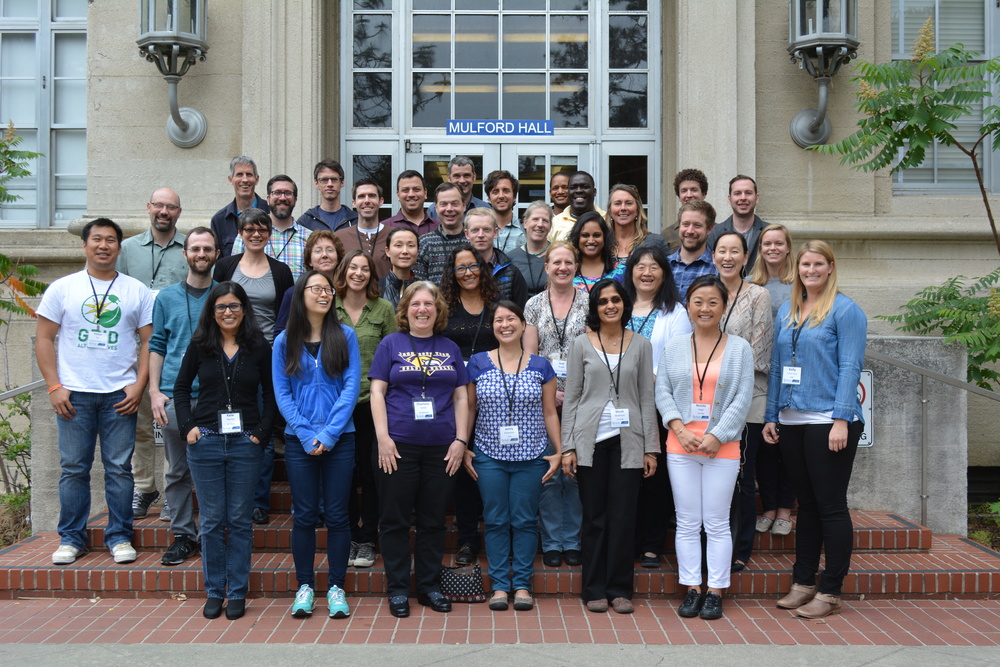
Bootcamp participants outside historic Mulford HallOur bootcamp on Spatial Data Science has concluded. We had three packed days learning about the concepts, tools and workflow associated with spatial databases, analysis and visualizations. 

Our goal was not to teach a specific suite of tools but rather to teach participants how to develop and refine repeatable and testable workflows for spatial data using common standard programming practices.

On Day 1 we focused on setting up a collaborative virtual data environment through virtual machines, spatial databases (PostgreSQL/PostGIS) with multi-user editing and versioning (GeoGig). We also talked about open data and open standards, and modern data formats and tools (GeoJSON, GDAL).

Analyzing spatial data is the best part! On Day 2 we focused on open analytical tools for spatial data. We focused on one particular class of spatial data analysis: pattern analysis, and used Python (i.e. PySAL, NumPy, PyCharm, iPython Notebook), and R Studio (i.e. raster, sp, maptools, rgdal, shiny) to look at spatial autocorrelation and spatial regression. 

Wait, visualizing spatial data is the best part! Day 3 was dedicated to the web stack, and visualization. We started with web mapping (web stack, HTML/CSS, JavaScript, Leaflet), and then focused on web-based visualizations (D3).  Web mapping is great, and as OpenGeo.org says: “Internet maps appear magical: portals into infinitely large, infinitely deep pools of data. But they aren't magical, they are built of a few standard pieces of technology, and the pieces can be re-arranged and sourced from different places.…Anyone can build an internet map."

All-in-all it was a great time spent with a collection of very interesting mapping professionals from around the country (and Haiti!). Thanks to everyone!

AAG wrap up 2015

Photo of Chicago from Frank Kehren, Flickr Creative Commons LicenseI focused on a series of CyberGIS sessions at AAG this year. This was partly to better situate our spatial data science ideas within the  terminology and discipline of Geography, and partly to focus on a new topic for me in AAG conferences. There were a number of organized sessions over three days, including a plenary by Timothy Nyerges from UW.  Talks ranged in topic: online collaboration, participatory analytics, open tool development such as python-based tools for parallelization of GIS operations, case studies of large area computation, introduction to languages that might be less familiar to geographers (e.g., Julia, R).

There was a session that focused on education in which ideas about challenging in teaching “cyberGIS” to undergraduate students, among other things. Additionally, Tim Nyerges gave the CyberGIS plenary: "Computing Complex Sustainable Systems Resilience" in which he made the case that CyberGIS is a framework for studying socio-economic systems, resilience, and system feedbacks.

About the term Cyber. I am not alone in my dislike of the term "CyberGIS" (Matrix 4, anyone?), but it seems to have stuck here at AAG. In many of the talks “cyber” meant “bigger". There were mentions of the “cyber thing”, which I took to be a placeholder for cluster computing. However, there are many other terms that are being used by the speakers. For example, I saw talks that focused on participatory, structured, analytic-deliberation from UW, or high performance geocomputation from ORNL; the latter term I think better captures what earth system science people might recognize. Many talks used as their entry point to Cyber the proliferation of data that characterizes modern geography and life.

These sessions were organized through an NSF-funded center: The CyberGIS Center for Advanced Digital and Spatial Studies http://cybergis.illinois.edu/.  Their formal definition of CyberGIS is:  “geographic information science and systems (GIS) based on advanced infrastructure of computing, information, and communication technologies (aka cyberinfrastructure)". They say it "has emerged over the past several years as a vibrant interdisciplinary field and played essential roles in enabling computing-, data- and collaboration-intensive geospatial research and education across a number of domains with significant societal impact."

And of course, we had excellent talks by the Kellys: Kelly presented on our VTM work: "Quantifying diversity and conservation status of California's Oak trees using the historic Vegetation Type Mapping (VTM) dataset” as part of an organized Historical Ecology session. Alice presented her paper: "Policing Paradise: The Evolution of Law Enforcement in US National Parks" as part of the session on Green Violence 2: Interrogating New Conflicts over Nature and Conservation.

Goodbye Chicago! You provided a wonderful venue, despite the cold!

print 'Hello World (from FOSS4G NA 2015)'

FOSS4G NA 2015 is going on this week in the Bay Area, and so far, it has been a great conference.

Monday had a great line-up of tutorials (including mine on PySAL and Rasterio), and yesterday was full of inspiring talks.  Highlights of my day: PostGIS Feature Frenzy, a new geoprocessing Python package called PyGeoprocessing, just released last Thurs(!) from our colleagues down at Stanford who work on the Natural Capital Project, and a very interesting talk about AppGeo's history and future of integrating open source geospatial solutions into their business applications. 

The talk by Michael Terner from AppGeo echoed my own ideas about tool development (one that is also shared by many others including ESRI) that open source, closed source and commercial ventures are not mutually exclusive and can often be leveraged in one project to maximize the benefits that each brings. No one tool will satisfy all needs.

In fact, at the end of my talk yesterday on Spatial Data Analysis in Python, someone had a great comment related to this: "Everytime I start a project, I always wonder if this is going to be the one where I stay in Python all the way through..."  He encouraged me to be honest about that reality and also about how Python is not always the easiest or best option.

Similarly, in his talk about the history and future of PostGIS features, Paul Ramsey from CartoDB also reflected on how PostGIS is really great for geoprocessing because it leverages the benefits of database functionality (SQL, spatial querying, indexing) but that it is not so strong at spatial data analysis that requires mathematical operations like interpolation, spatial auto-correleation, etc. He ended by saying that he is interested in expanding those capabilities but the reality is that there are so many other tools that already do that.  PostGIS may never be as good at mathematical functions as those other options, and why should we expect one tool to be great at everything?  I completely agree.

GIS Day 2014!

Discovering the World Through GIS

November 19, 2014, 5PM-8:30PM

UC Berkeley, Mulford Hall

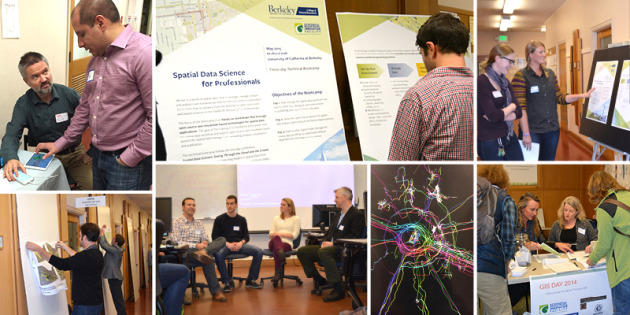
GIS Day took place in Mulford Hall Wednesday Nov 19th from 5-8:30pm. We had about 200 attendees who participated in workshops, listened to talks, saw posters, and networked with other like-minded GIS-enthusiasts.

Some of the activity at 2014 GIS Day in Mulford Hall

See the agenda here: http://gif.berkeley.edu/gisday.html.

Patty's update from the Geospatial Computational Social Sciences conference at Stanford

Patty Frontiera from the D-Lab went to the Geospatial Computational Social Sciences conference at Stanford on Monday 10/20 (https://css-center.stanford.edu/geospatial-computational-social-science-conference).

Here is her summary:

1. GIS for Exploratory Data Analysis

  • The presentations showed that geospatial analysis and mapping using desktop GIS, R and python are an extremely important part of exploratory data analyses in the social sciences.

2. GIS for Communication / Visualization

  • Digital maps and web maps are an important part of communicating the results of scientific analysis. However effective communication with any kind of graphic / visualization tool may require additional funding for design professionals which researchers typically are not.

3. Garbage in Garbage out - or good computational tools don't replace good thinking.

  • Ed Chi a research scientist at Google gave a great talk on the analysis of implicit location data in twitter content. One point he made is that there are great tools for parsing and analyzing these data but bad data can creep in when the tools are used without thoughtful consideration of the data inputs and outputs. For example, just because someone entered "Donkey-Kong, Texas" as their home town and a geocoder parsed that and returned a valid coordinate pair does not mean that that town exists. He would be a great speaker to get at Berkeley.

4. Uses of GIS in Social Science

  • A panel discussed the uses of GIS in social science research. The key points they made were:
    • GIS is an important tool for linking social and environmental data.
    • GIS is important for exploring data at different geographic and temporal scales.
    • The use of GIS in social science research requires and benefits from an interdisciplinary approach.

5. Academia-Industry Collaboration

  • There were three industry speakers, one each from Facebook, Google, and EBay. They discussed collaboration with academia, making the following points:
    • Because it takes so long to establish a working relationship and because a tremendous amount of effort goes into creating data sets that can be made available for social science research, universities should work on developing long term relationships with industry rather than come ask for data for one-off projects.
    • Academia should participate in the development of open standards for space-time geospatial data formats.
    • Academia should not insist on overly restrictive licensing terms.
    • Industry likes collaborating with social scientists (as opposed to computer scientists) because they have different goals from industry and thus it is more of a mutually beneficial rather than competitive relationship.

6. Social Science Research Needs with regard to Geospatial computational Analysis:

  1. Social scientists need training in the following areas: GIS, R, Python, SQL, data cleaning, geospatial data file formats, and computing infrastructure.
  2. Data reuse and research replication: because of how long it takes to obtain and clean data, social scientists need infrastructure to facilitate data sharing and reuse.
  3. Academia needs to recognize the value of data intensive social science though the use of alt metrics. Stanford Press just received a Mellon grant to explore alt metrics movement.

7. Social scientist..data scientist..computer scientist?

  • There was a heated discussion on whether or not a social scientist needs to become a computer scientist and what the nature of the relationship should be between these two fields.  This was a really good discussion which may be worth having at Berkeley.
    • Do social scientists need to become data scientists?
    • What level of computational training is enough?
    • Do computer scientists need social scientists too?
    • There is a tension in the disciplines of applied computer science (maker culture) and social sciences/humanities (idea culture).


Workshop on Oct 19: Planet Mapping: The Science of 3D Maps

swissnex San Francisco
730 Montgomery St., San Francisco, 94111
- See more at: http://www.swissnexsanfrancisco.org/event/planetmapping/#sthash.G5iIInIJ.dpuf
swissnex San Francisco
730 Montgomery St., San Francisco, 94111
- See more at: http://www.swissnexsanfrancisco.org/event/planetmapping/#sthash.G5iIInIJ.dpuf

Planet Mapping: The Science of 3D Maps. Find out what tools and techniques are enabling today’s modern cartographers to render 3D maps.

Location: swissnex San Francisco
730 Montgomery St., San Francisco, 94111

Our world is constantly being captured through GPS, cameras, satellites, and scanners and rendered by algorithms into navigable maps of Planet Earth. But how are 3D maps really made? How is the data collected?
Hear from some of the hottest startups in the field about the science and technology behind 3D map making—from data collection, to processing, to display—and discover how you can make your own 3D maps.
During the event, enjoy the visual stimulation of the PLACEMAKERS exhibit on view at swissnex San Francisco.

Program:

  • 6:30 pm doors open
  • 7:00 pm intro
  • 7:10 pm talks + Q&A
  • 8:45 pm networking reception

See more at: http://www.swissnexsanfrancisco.org/event/planetmapping/#sthash.G5iIInIJ.dpuf

Our world is constantly being captured through GPS, cameras, satellites, and scanners and rendered by algorithms into navigable maps of Planet Earth. But how are 3D maps really made? How is the data collected?

Hear from some of the hottest startups in the field about the science and technology behind 3D map making—from data collection, to processing, to display—and discover how you can make your own 3D maps.

During the event, enjoy the visual stimulation of the PLACEMAKERS exhibit on view at swissnex San Francisco.

Program

6:30 pm doors open
7:00 pm intro
7:10 pm talks + Q&A
8:45 pm networking reception

- See more at: http://www.swissnexsanfrancisco.org/event/planetmapping/#sthash.G5iIInIJ.dpuf

Upcoming local conferences of interest

IMAGE as LOCATION

Wednesday, October 22, 9:00 AM – 5:30 PM. Banatao Auditorium, 310 Sutardja Dai Hall, UC Berkeley

Tickets available online: http://www.eventbrite.com/e/image-as-location-conference-tickets-12860529189

When man-made images constitute the evidence of our environment and even our existence, how is our perception of the world manipulated and shaped?  The IMAGE as LOCATION conference brings together artists, technologists, and theorists to discuss how images define our understanding of our environment by allowing us to access the inaccessible. Beginning at the microscopic scale and moving through our human dimensions into planetary orbits, we will discover what it means to wrap our world in visual artifacts both from a cultural and public policy perspective.

Stanford’s Geospatial Computational Social Science Conference

Monday, October 20, 2014, 8:30 - 5:15, Mackenzie Room (#300), Huang Engineering Center, 475 Via Ortega, Stanford, CA 94305

Speakers join us from Airbnb, Facebook, Google, and more. 

Measuring Development: Energy & Environment

I spoke yesterday at the CEGA-DIME* co-sponsored event: Measuring Development: Energy & Environment.  This was a terrific day of interesting talks, thoughtful conversations and great networking.

This workshop brought together engineers, social scientists, donors, and practitioners to discuss the use of novel measurement tools--including sensors, sensor networks, microsatellite imaging, and other remote sensing technologies--in energy and environment research. 

I presented an "ignite" talk on some of our mapping work and talked about the idea of "Spatial Data Science". There were a number of highlights. Matt Hancher from Google gave a great overview of Google Earth Engine and asked: "What if the micro-satellite imagery revolution works. What will you do with the data?” Great and timely question. Big Spatial Data workshop to the rescue! We heard from people at the Energy Institute at Haas who are looking at smart sensors, iButtons and billing networks to understand energy usage around the world; Ronald Cohen from the Climate Readiness Institute spoke; there was tons of discussion about low earth orbit micro-satellites from Skybox and the Spire company (they monitor AIS beacons on ships yet they also can still find them as they move back and forth through fishing zones and turn off their beacons); there was a great idea from Tony Vodacek from RIT on the need to develop “a remote sensing playbook”: What are the sensors, resolutions, bands that are needed for a particular task?. David Lobell from Stanford highlighted some of his great work in remote sensing of crop yields; and Sol Hsiang from the Goldman School outlined his fascinating work on natural disasters, economies and violence.

Background: Technologies for measuring the adoption and impact of development interventions have seen substantial innovation over the past several years—examples include the use of microsatellite data for mapping weather patterns and agricultural yields, sensors for tracking behavior change, smart meters for recording real-time energy use, continuous emissions monitoring systems for measuring particulate matter, and platforms for smartphone- and tablet-based survey data collection. At the same time, network protocols for data management, visualization, and analysis have drastically improved.

*CEGA =UC Berkeley's Center for Effective Global Action; DIME = World Bank's Development Impact Evaluation Initiative

Google Geo for Higher Education Summit 2014


Just got back from an amazing workshop with the Google Earth Outreach Geo Team and 50+ geospatial educators, researchers, and lab managers! 

In between stealing off on the colorful google bikes  and spending time wandering the amazing Google campus, we engaged each other in discussions of integrating Google tools into higher education and learning and attended workshops introducing the plethora of Google mapping tools.

We had a warm welcome from Brian McClendon (VP of Engineering, Geo at Google, mastermind behind Google Earth, and creator of KML) who gave a great history of the program and the creation of Google Geo and gave an exciting announcement that Google; with the acquisition of Skybox is now taking to the sky with their own satellites in hand (contrary to popular belief, Google has not to this point owned any Satellites).  With this acquisition, near-real live time imagery on Google platforms seems to be closer than ever before.

Rebecca Moore (Engineering Manager, Google Earth Outreach and Earth Engine) also gave a great history of the importance of Google Earth and its transformation over the years highlighting a number of exiting things to come and products not yet released to the public including

1. A new MODIS time-lapse!

From Maggi’s blog post last year on timelapse created from LANDSAT imagery we saw the amazing capabilities to see transformations over time with the click of a button. Now Google will soon release MODIS time-lapse which having a quicker repeat interval will be able to show seasonal changes .

Check out this example here showing fires across the world, and more targeted video here! Awesome!

2. Also great news for those of you tired of the coarse resolution SRTM 90 DEM, Google is currently working to produce a much higher resolution global DEM product…stay tuned!

Throughout the 3 days, I had the opportunity to attend a variety of different workshops and came away absolutely jazzed! See below for a summary of the latest and greatest from the Google Geo team with links attached if you’re interested and want more information….. Also stay tuned for some of my renderings and products from the training!

Google’s “Ecosystem” of Technologies

Mapping:

Google Maps Engine (GME): hosting data and publishing maps online, and ability to build applications and connect Google’s data with your own.

GME Pro&Lite: simple map making in the cloud, visualize, draw, import a csv, and style your maps

Maps Gallery: A new way for organizations and public institutions to publish and share their maps online through the Google maps Engine

Google Crisis Map: a map interface initially used for emergency alerts, however it’s not entirely dedicated to crisis as you can easily integrate and create your own map mashup and community awareness map here

Maps Engine API (application program interface): to access Maps Engine data, create a new applications utilizing the data, stylize and create beautiful maps

Analysis

Google Earth Engine: (EE), Google’s geospatial analysis platform. Earth Engine brings together the world's satellite imagery — trillions of scientific measurements dating back almost 40 years — and makes it available online with tools for scientists, independent researchers, and nations to mine this massive warehouse of data to detect changes, map trends and quantify differences on the Earth's surface.

Earth Engine API (application programming interface) provides the ability to create your own algorithms to process raster and vector imagery.

Timelapse builds on Earth Engine to show decades of planetary change, both man-made and natural

Data Collection

Streetview: in Google Maps and Earth provides over five millions miles of interactive 360-degree panoramas across all seven continents; it’s the closest thing to teleportation, allowing teachers and students to virtually walk almost anywhere they dream of going. Street View began on the roads, but new technologies like theTrekker backpack or an underwater rig can take you almost everywhere.

                -Treks: Street view special collections (museums, up a mountain,etc..)

                -Views: streetview imagery crowd-sourced from user generated 360 degree photospheres. You can now connect your photospheres to create your own street view using constellations

Mobile Data Collection using Open Data Kit allows you to collect field data, such as text, photos/videos, and GPS location from an Android device where there's no internet connection and then publish that data to the web when you're back online. You can then export your data into Google Earth Engine for mapping and Google Fusion Tables for graphing, mapping and visualization. 

Visualization/ Story Telling

Tour Builder: Tour Builder is a new way to show people the places you've visited and the experiences you had along the way using Google Earth. It lets you pick the locations right on the map, add in photos, text, and video, and then share your creation. The new geo-enabled Powerpoint!


Thanks to Maggi for the opportunity to attend and the talented, enthusiastic Google Geo staff (including: Karin Tuxen-Bettman, John Bailey, David Thau, Christiaan Adams, and all the other workshop leads and those behind the scenes!) for developing such an action packed workshop!