Mapping COVID19: a technology overview

Hello everyone, I hope you are all healthy, safe, sane, and if possible, being productive.

Here I provide a summary of some of the mapping technology that has been used in the past few weeks to understand the COVID-19 pandemic. This is not exhaustive! I pick three areas that I am personally focusing on currently: map-based data dashboards, disease projections, and social distancing scorecards. I look at where the data comes from and how the sites are built. More will come on the use of remote sensing and earth observation data in support of COVID-19 monitoring, response or recovery, and some of the cool genome evolution and pandemic spread mapping work going on.

COVID-19 map-based data dashboards. You have seen these: lovely dashboards displaying interactive maps, charts, and graphs that are updated daily. They tell an important story well. They usually have multiple panels, with the map being the center of attention, and then additional panels of data in graph or tabular form. There are many many data dashboards out there. My two favorites are the Johns Hopkins site, and the NYTimes coronavirus outbreak hub.

Where do these sites get their data?

  • Most of these sites are using data from similar sources. They use data on number of cases, deaths, and recoveries per day. Most sites credit WHO, US CDC (Centers for Disease Control and Prevention), ECDC (European Centre for Disease Prevention and Control), Chinese Center for Disease Control and Prevention (CCDC), and other sources. Finding the data is not always straightforward. An interesting article came out in the NYTimes about their mapping efforts in California, and why the state is such a challenging case. They describe how “each county reports data a little differently. Some sites offer detailed data dashboards, such as Santa Clara and Sonoma counties. Other county health departments, like Kern County, put those data in images or PDF pages, which can be harder to extract data from, and some counties publish data in tabular form”. Alameda County, where I live, reports positive cases and deaths each day, but they exclude the city of Berkeley (where I live), so the NYTimes team has to scrape the county and city reports and then combine the data.

  • Some of the sites turn around and release their curated data to us to use. JH does this (GitHub), as does NYTimes (article, GitHub). This is pretty important. Both of these data sources (JH & NYTimes) have led to dozens more innovative uses. See the Social Distancing Scorecard discussed below, and these follow-ons from the NYTimes data: https://chartingcovid.com/, and https://covid19usmap.com/.

  • However… all these dashboards are starting with simple data: number of patients, number of deaths, and sometimes number recovered. Some dashboards use these initial numbers to calculate additional figures such as new cases, growth factor, and doubling time, for example. All of these data are summarized by some spatial aggregation to make them non-identifiable, and more easily visualized. In the US, the spatial aggregation is usually by county.

How do these sites create data dashboards?

  • The summarized data by county or country can be visualized in mapped form on a website via web services. These bits of code allow users to use and display data from different sources in mapped form without having to download, host, or process them. In short, any data with a geographic location can be linked to an existing web basemap and published to a website; charts and tables are also done this way. The technology has undergone a revolution in the last five years, making this very doable. Many of the dashboards out there use ESRI technology to do this. They use ArcGIS Online, which is a powerful web stack that quite easily creates mapping and charting dashboards. The Johns Hopkins site uses ArcGIS Online, the WHO does too. There are over 250 sites in the US alone that use ArcGIS Online for mapping data related to COVID-19. Other sites use open source or other software to do the same thing. The NYTimes uses an open source mapping platform called MapBox to create their custom maps. Tools like MapBox allow you to pull data from different sources, add those data by location to an online map, and customize the design to make it beautiful and informative. The NYTimes cartography is really lovely and clean, for example.

An open access peer reviewed paper just came out that describes some of these sites, and the methods behind them. Kamel Boulos and Geraghty, 2020.

COVID-19 disease projections. There are also sites that provide projections of peak cases and capacity for things like hospital beds. These are really important as they can help hospitals and health systems prepare for the surge of COVID-19 patients over the coming weeks. Here is my favorite one (I found this via Bob Watcher, @Bob_Wachter, Chair of the UCSF Dept of Medicine):

  • Institute for Health Metrics and Evaluation (IHME) provides a very good visualization of their statistical model forecasting COVID-19 patients and hospital utilization against capacity by state for the US over the next 4 months. The model looks at the timing of new COVID-19 patients in comparison to local hospital capacity (regular beds, ICU beds, ventilators). The model helps us to see if we are “flattening the curve” and how far off we are from the peak in cases. I’ve found this very informative and somewhat reassuring, at least for California. According to the site, we are doing a good job in California of flattening the curve, and our peak (projected to be on April 14), should still be small enough so that we have enough beds and ventilators. Still, some are saying this model is overly optimistic. And of course keep washing those hands and staying home.

Where does this site get its data?

  • The IHME team state that their data come from local and national governments, hospital networks like the University of Washington, the American Hospital Association, the World Health Organization, and a range of other sources.

How does the model work?

  • The IHME team used a statistical model that works directly with the existing death rate data. The model uses the empirically observed COVID-19 population and calculates forecasts for population death rates (with uncertainty) for deaths and for health service resource needs and compare these to available resources in the US. Their pre-print explaining the method is here.

On a related note, ESRI posted a nice webinar with Lauren Bennet (spatial stats guru and all-around-amazing person) showing how the COVID-19 Hospital Impact Model for Epidemics (CHIME) model has been integrated into ArcGIS Pro. The CHIME model is from Penn Medicine’s Predictive Healthcare Team and it takes a different approach than the IHME model above. CHIME is a SIR (susceptible-infected-recovery) model. A SIR model is an epidemiological model that estimates the probability of an individual moving from a susceptible state to an infected state, and from an infected state to a recovered state or death within a closed population. Specifically, the CHIME model provides estimates of how many people will need to be hospitalized, and of that number how many will need ICU beds and ventilators. It also factors social distancing policies and how they might impact disease spread. The incorporation of this within ArcGIS Pro looks very useful, as you can examine results in mapped form, and change how variables (such as social distancing) might change outcomes. Lauren’s blog post about this and her webinar are useful resources.

Social distancing scorecards. This site from Unicast got a lot of press recently when it published a scoreboard for how well we are social distancing under pandemic rules. It garnered a lot of press because it tells and important story well, but also, because it uses our mobile phone data (more on that later). In their initial model, social distancing = decrease in distance traveled; as in, if you are still moving around as you were before the pandemic, then you are not socially distancing. There are some problems with this assumption of course. As I look out on my street now, I see people walking, most with masks, and no one within 10 feet of another. Social distancing in action. These issues were considered, and they updated their scorecard method. Now, in addition to a reduction in distance traveled, they also include a second metric to the social distancing scoring: reduction in visits to non-essential venues. Since I last blogged about this site nearly two weeks ago, California’s score went from an A- to a C. Alameda County, where I live, went from an A to a B-. They do point out that drops in scores might be a result of their new method, so pay attention to the score and the graph. And stay tuned! Their next metric is going to be the change rate for the number of person-to-person encounters for a given area. Wow.

Where do these sites get their data?

  • The data on reported cases of COVID-19 is sourced from the Corona Data Scraper (for county-level data prior to March 22) and the Johns Hopkins Github Repository (for county-level data beginning March 22 and all state-level data).

  • The location data is gathered from mobile devices using GPS, Bluetooth, and Wi-Fi connections. They use mobile app developers and publishers, data aggregation services, and providers of location-supporting technologies. They are very clear on their privacy policy, and they do say they are open to sharing data via dataforgood@unacast.com. No doubt, this kind of use of our collective mobile device location data is a game-changer and will be debated when the pandemic is over.

How does Unicast create the dashboard?

  • They do something similar to the dashboard sites discussed above. They pull all the location data together from a range of sites, develop their specific metrics on movement, aggregate by county, and visualized on the web using custom web design. They use their own custom basemaps and design, keeping their cartography clean. I haven’t dug into the methods in depth yet, but I will.

Please let me know about other mapping resources out there. Stay safe and healthy. Wash those hands, stay home as much as possible, and be compassionate with your community.

Day 2 Wrap Up from the NEON Data Institute 2017

First of all, Pearl Street Mall is just as lovely as I remember, but OMG it is so crowded, with so many new stores and chains. Still, good food, good views, hot weather, lovely walk.

Welcome to Day 2! http://neondataskills.org/data-institute-17/day2/
Our morning session focused on reproducibility and workflows with the great Naupaka Zimmerman. Remember the characteristics of reproducibility - organization, automation, documentation, and dissemination. We focused on organization, and spent an enjoyable hour sorting through an example messy directory of misc data files and code. The directory looked a bit like many of my directories. Lesson learned. We then moved to working with new data and git to reinforce yesterday's lessons. Git was super confusing to me 2 weeks ago, but now I think I love it. We also went back and forth between Jupyter and python stand alone scripts, and abstracted variables, and lo and behold I got my script to run. All the git stuff is from http://swcarpentry.github.io/git-novice/

The afternoon focused on Lidar (yay!) and prior to coding we talked about discrete and waveform data and collection, and the opentopography (http://www.opentopography.org/) project with Benjamin Gross. The opentopography talk was really interesting. They are not just a data distributor any more, they also provide a HPC framework (mostly TauDEM for now) on their servers at SDSC (http://www.sdsc.edu/). They are going to roll out a user-initiated HPC functionality soon, so stay tuned for their new "pluggable assets" program. This is well worth checking into. We also spent some time live coding with Python with Bridget Hass working with a CHM from the SERC site in California, and had a nerve-wracking code challenge to wrap up the day.

Fun additional take-home messages/resources:

Thanks to everyone today! Megan Jones (our fearless leader), Naupaka Zimmerman (Reproducibility), Tristan Goulden (Discrete Lidar), Keith Krause (Waveform Lidar), Benjamin Gross (OpenTopography), Bridget Hass (coding lidar products).

Day 1 Wrap Up
Day 2 Wrap Up 
Day 3 Wrap Up
Day 4 Wrap Up

Our home for the week

Our home for the week

Day 1 Wrap Up from the NEON Data Institute 2017

I left Boulder 20 years ago on a wing and a prayer with a PhD in hand, overwhelmed with bittersweet emotions. I was sad to leave such a beautiful city, nervous about what was to come, but excited to start something new in North Carolina. My future was uncertain, and as I took off from DIA that final time I basically had Tom Petty's Free Fallin' and Learning to Fly on repeat on my walkman. Now I am back, and summer in Boulder is just as breathtaking as I remember it: clear blue skies, the stunning flatirons making a play at outshining the snow-dusted Rockies behind them, and crisp fragrant mountain breezes acting as my Madeleine. I'm back to visit the National Ecological Observatory Network (NEON) headquarters and attend their 2017 Data Institute, and re-invest in my skillset for open reproducible workflows in remote sensing. 

Day 1 Wrap Up from the NEON Data Institute 2017
What a day! http://neondataskills.org/data-institute-17/day1/
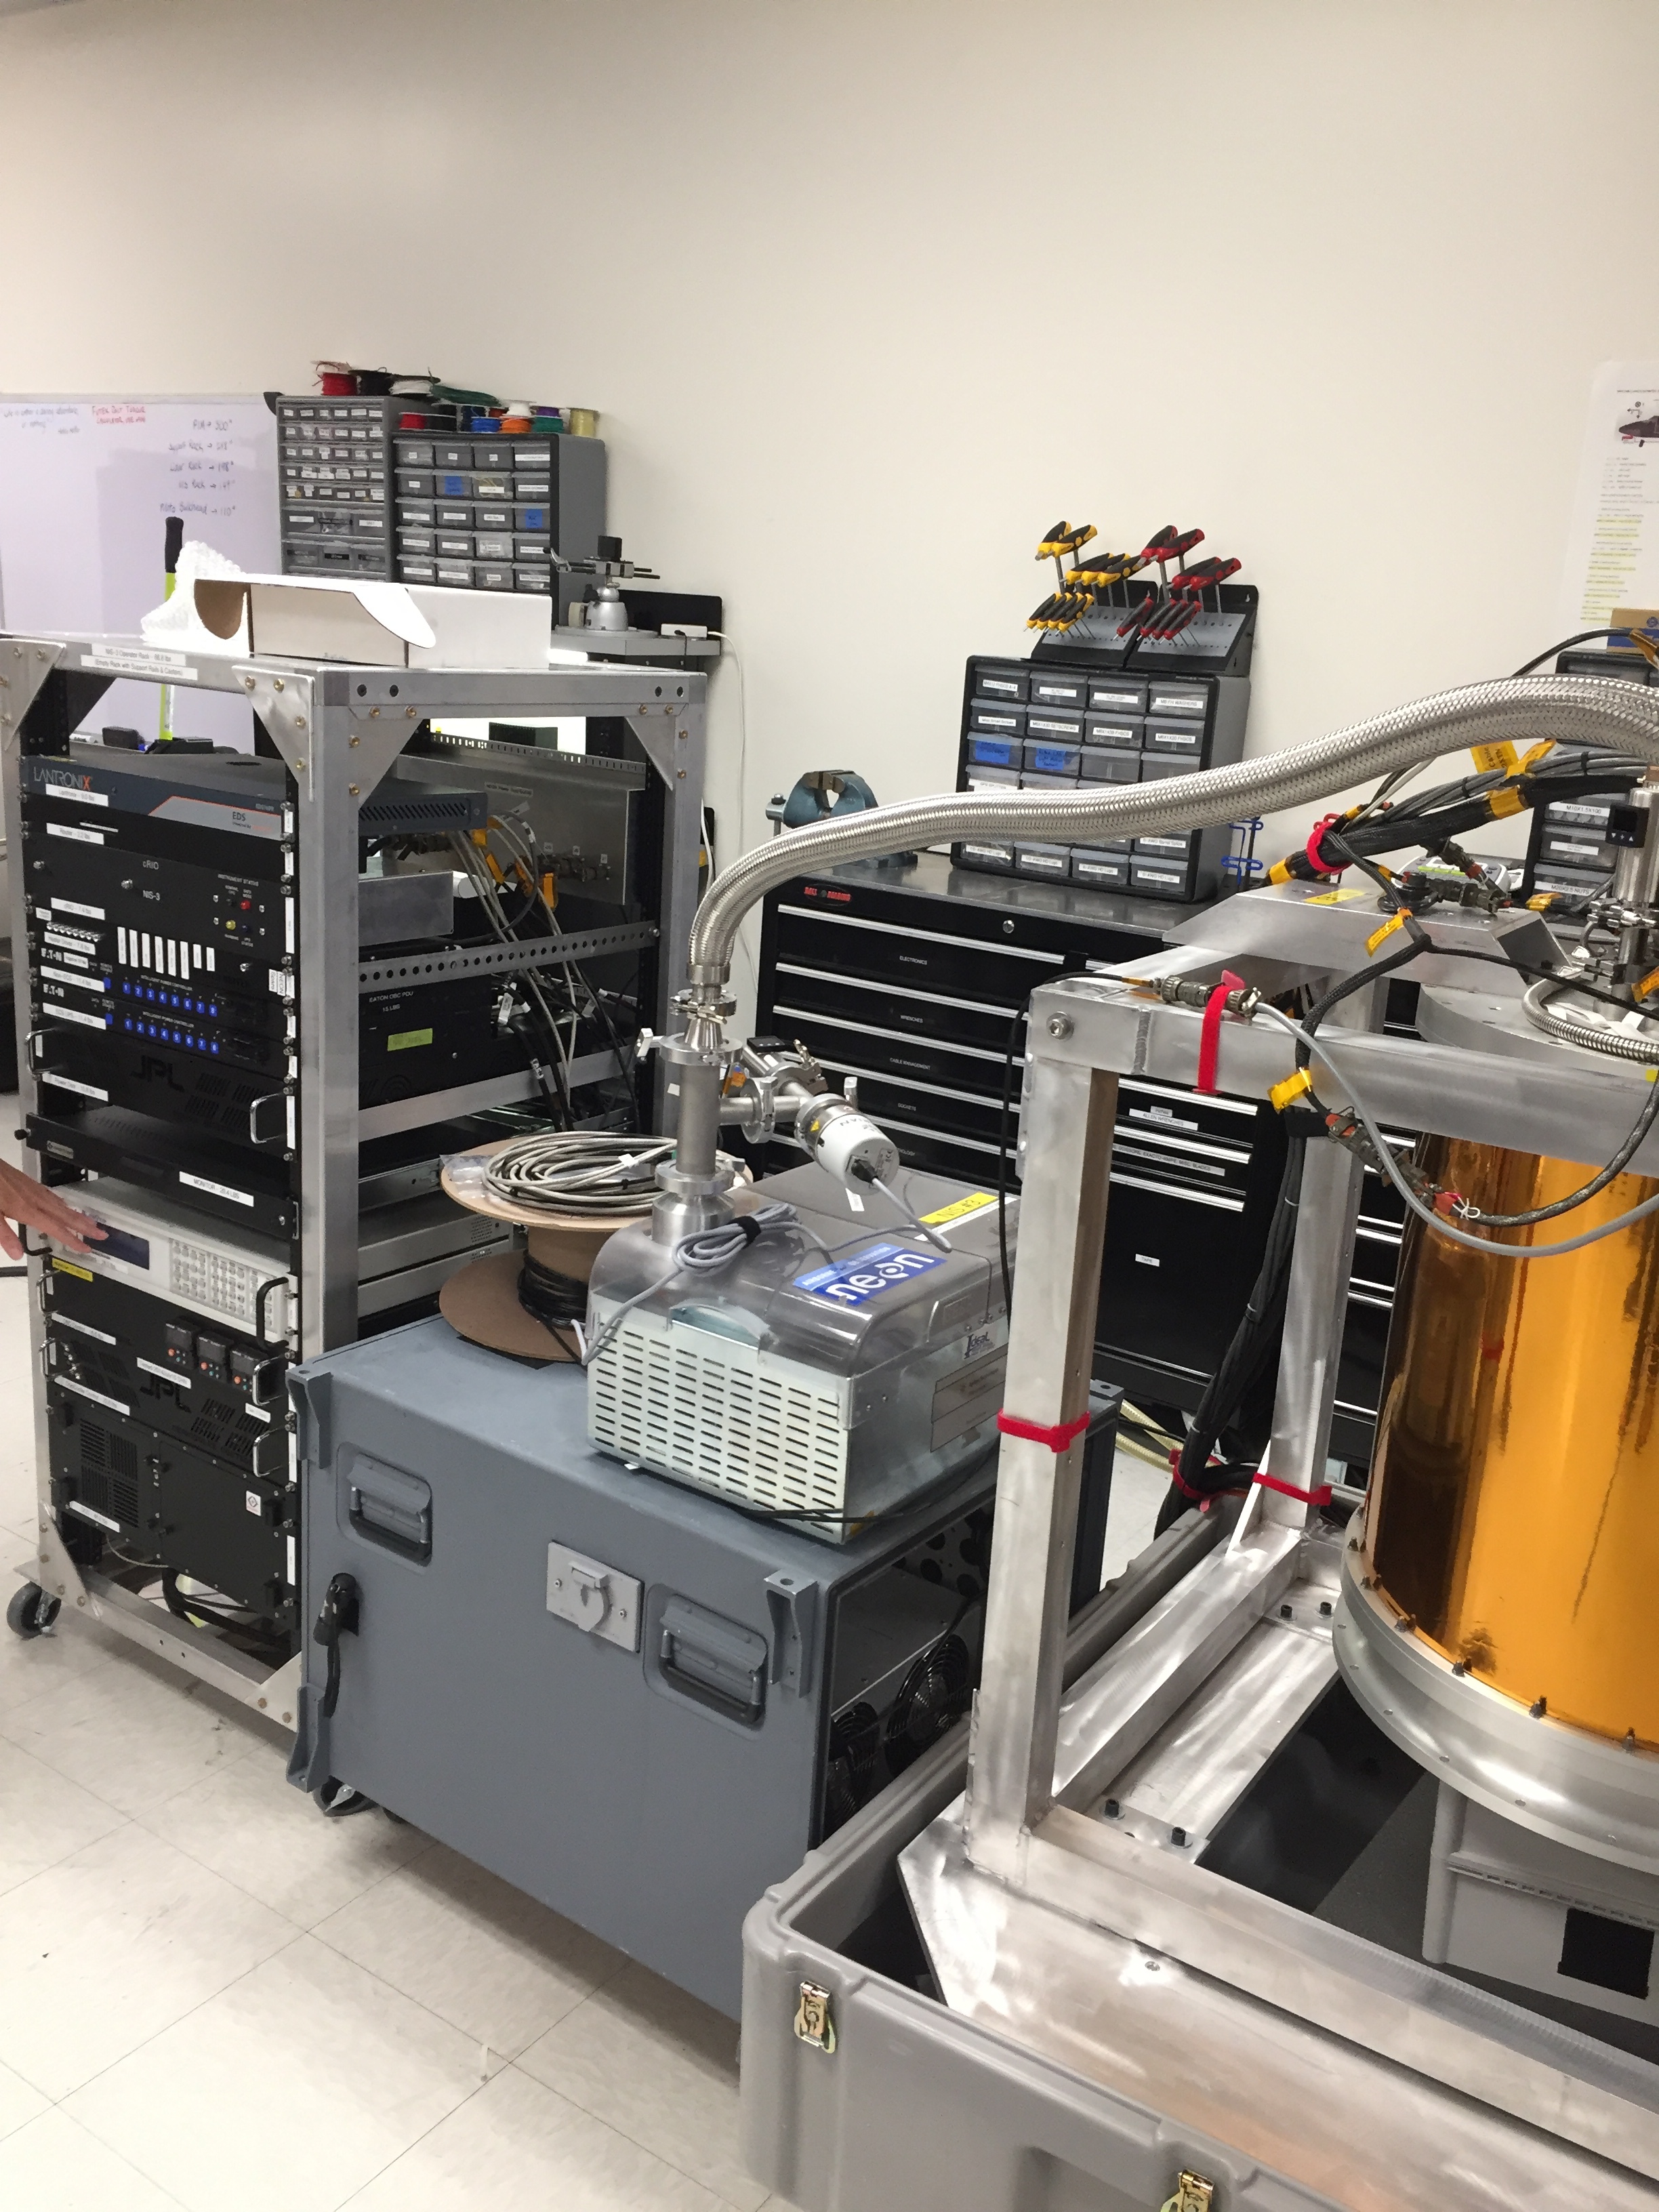
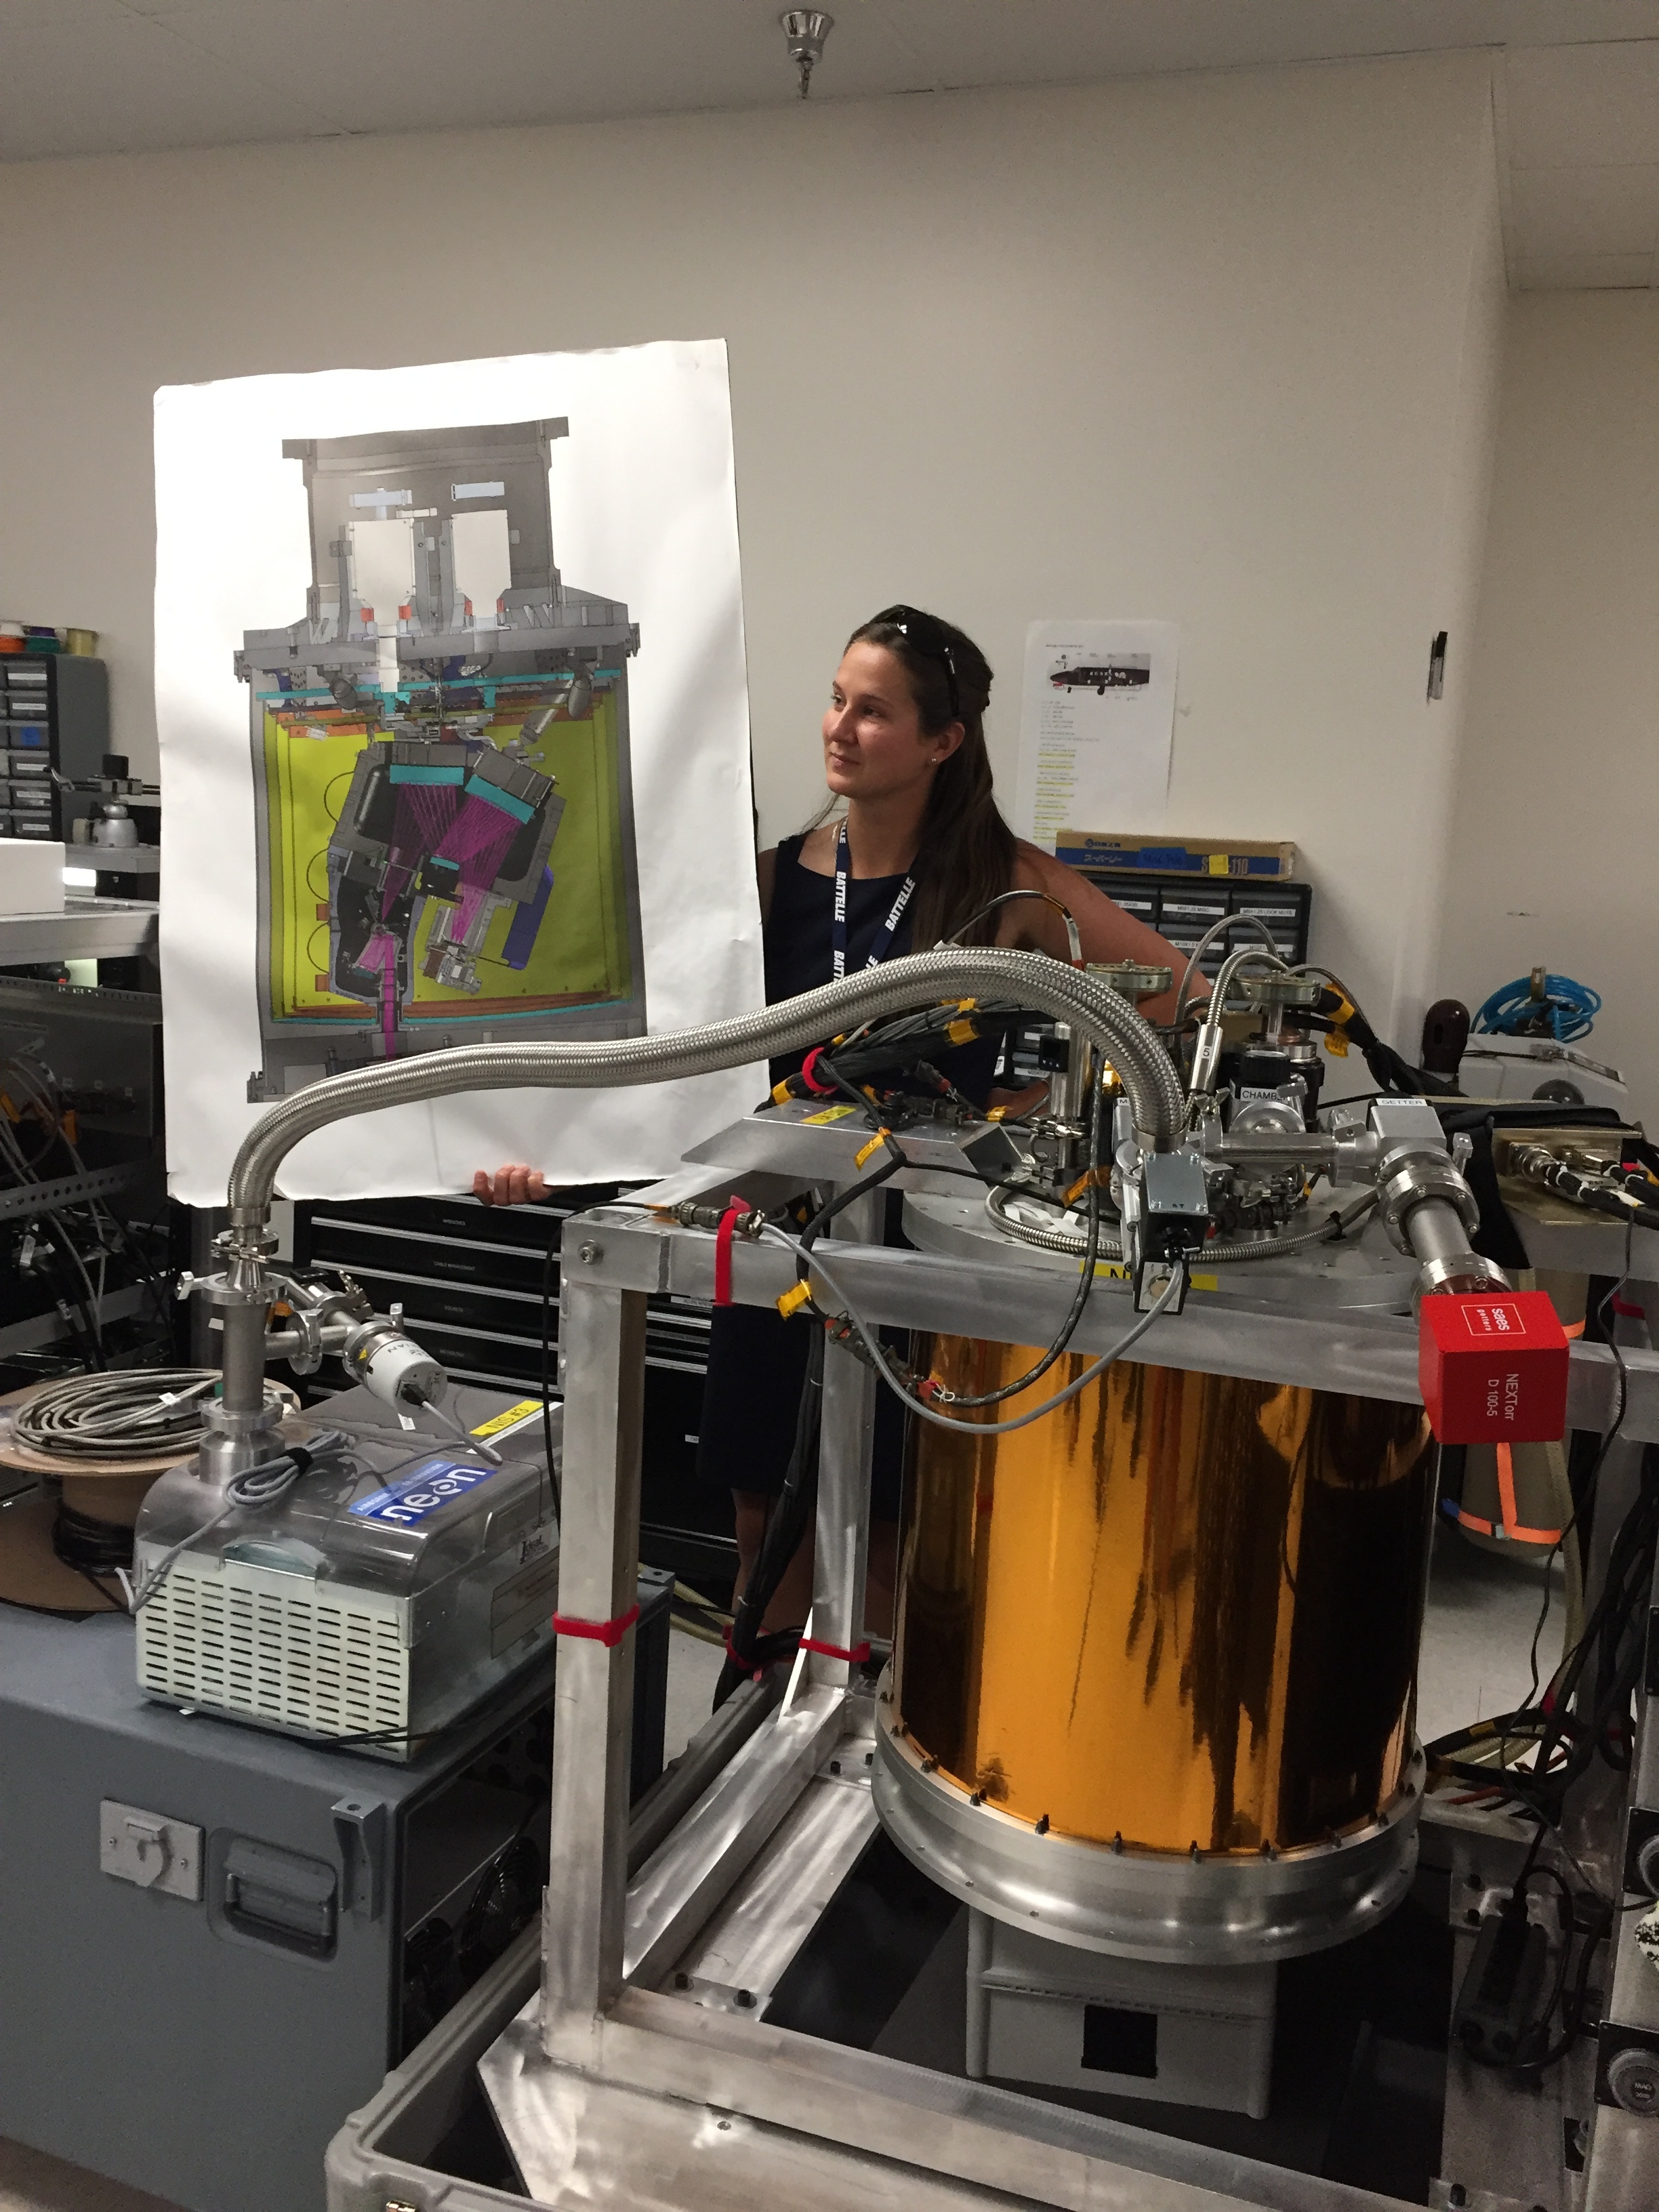
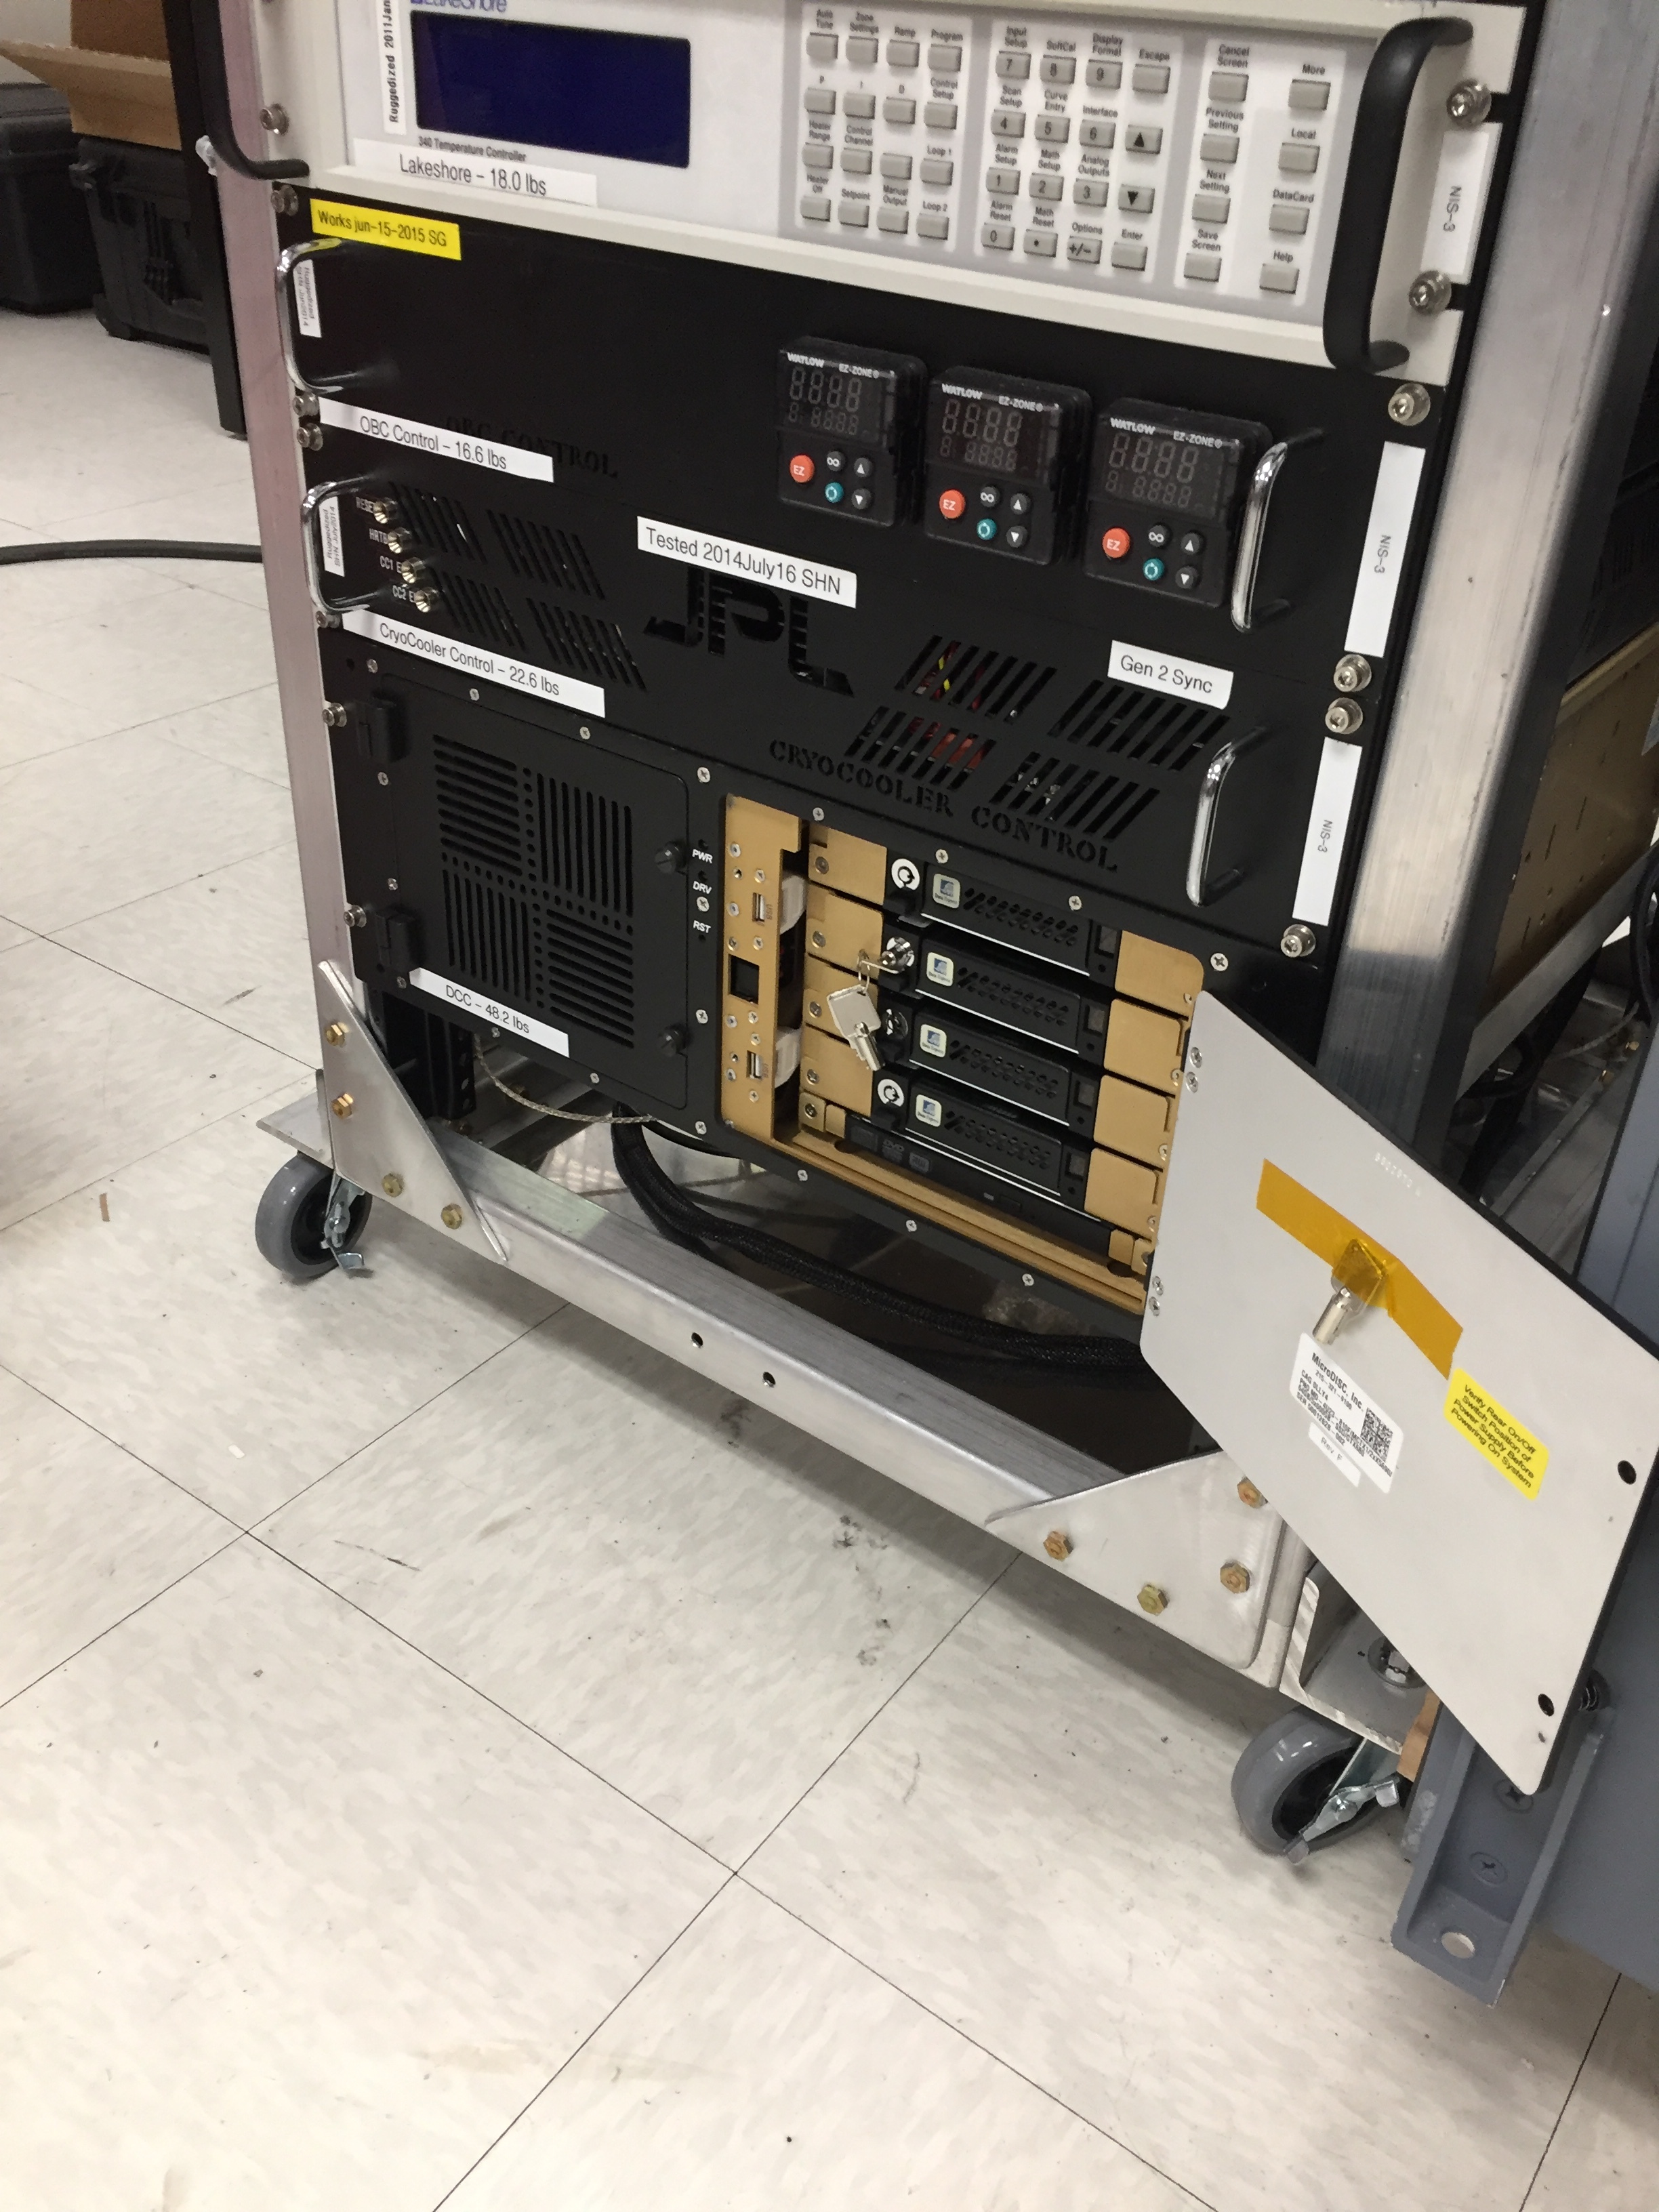
Attendees (about 30) included graduate students, old dogs (new tricks!) like me, and research scientists interested in developing reproducible workflows into their work. We are a pretty even mix of ages and genders. The morning session focused on learning about the NEON program (http://www.neonscience.org/): its purpose, sites, sensors, data, and protocols. NEON, funded by NSF and managed by Battelle, was conceived in 2004 and will go online for a 30-year mission providing free and open data on the drivers of and responses to ecological change starting in Jan 2018. NEON data comes from IS (instrumented systems), OS (observation systems), and RS (remote sensing). We focused on the Airborne Observation Platform (AOP) which uses 2, soon to be 3 aircraft, each with a payload of a hyperspectral sensor (from JPL, 426, 5nm bands (380-2510 nm), 1 mRad IFOV, 1 m res at 1000m AGL) and lidar (Optech and soon to be Riegl, discrete and waveform) sensors and a RGB camera (PhaseOne D8900). These sensors produce co-registered raw data, are processed at NEON headquarters into various levels of data products. Flights are planned to cover each NEON site once, timed to capture 90% or higher peak greenness, which is pretty complicated when distance and weather are taken into account. Pilots and techs are on the road and in the air from March through October collecting these data. Data is processed at headquarters.

In the afternoon session, we got through a fairly immersive dunk into Jupyter notebooks for exploring hyperspectral imagery in HDF5 format. We did exploration, band stacking, widgets, and vegetation indices. We closed with a fast discussion about TGF (The Git Flow): the way to store, share, control versions of your data and code to ensure reproducibility. We forked, cloned, committed, pushed, and pulled. Not much more to write about, but the whole day was awesome!

Fun additional take-home messages:

Thanks to everyone today, including: Megan Jones (Main leader), Nathan Leisso (AOP), Bill Gallery (RGB camera), Ted Haberman (HDF5 format), David Hulslander (AOP), Claire Lunch (Data), Cove Sturtevant (Towers), Tristan Goulden (Hyperspectral), Bridget Hass (HDF5), Paul Gader, Naupaka Zimmerman (GitHub flow).

Day 1 Wrap Up
Day 2 Wrap Up 
Day 3 Wrap Up
Day 4 Wrap Up

Great links from class today

Today was WebGIS and the Geoweb (I know, we could do a whole semester), and rounded up some nice resources. 

  1. Open Street Map interactions (from Vanessa):
    1. Here is Overpass Turbo, the OSM data filtering site. https://overpass-turbo.eu
    2. Here is Tag Info, where you can find the keys to query information on Overpass Turbo. https://taginfo.openstreetmap.org/
  2. Privacy (from Wyeth): Radiolab did a great piece on the intersection between GIS data and privacy.
    1. Link to the article: http://www.radiolab.org/story/update-eye-sky/ (this is the updated article after changes from the original broadcast in June 2015 [http://www.radiolab.org/story/eye-sky/] ) 
    2. Also, the company that developed from this: http://www.pss-1.com/

ASTER Data Open - No April Fools!

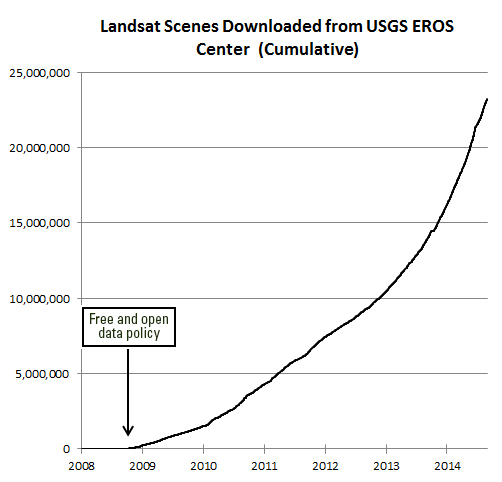
We know about the amazing success for science, education, government, and business that has resulted from the opening of the Landsat archive in 2008. Now more encouraging news about open data:

On April 1, 2016, NASA's Land Processes Distributed Active Archive Center (LP DAAC) began distributing ASTER Level 1 Precision Terrain Corrected Registered At-Sensor Radiance (AST_L1T) data products over the entire globe at no charge. Global distribution of these data at no charge is a result of a policy change made by NASA and Japan.

The AST_L1T product provides a quick turn-around of consistent GIS-ready data as a multi-file product, which includes a HDF-EOS data file, full-resolution composite images (FRI) as GeoTIFFs for tasked telescopes (e.g., VNIR/SWIR and TIR ), and associated metadata files. In addition, each AST_L1T granule contains related products including low-resolution browse and, when applicable, a Quality Assurance (QA) browse and QA text report.

More than 2.95 million scenes of archived data are now available for direct download through the LP DAAC Data Pool and for search and download through NASA‘s Earthdata Search Client and also through USGS‘ GloVis , and USGS‘ EarthExplorer . New scenes will be added as they are acquired and archived.

ASTER is a partnership between NASA, Japan‘s Ministry of Economy, Trade and Industry (METI), the National Institute of Advanced Industrial Science and Technology (AIST) in Japan, and Japan Space Systems (J-spacesystems ).

Visit the LP DAAC ASTER Policy Change Page to learn more about ASTER. Subscribe to the LP DAAC listserv for future announcements.

Spatial Data Science Bootcamp March 2016

Register now for the March 2016 Spatial Data Science Bootcamp at UC Berkeley!

We live in a world where the importance and availability of spatial data are ever increasing. Today’s marketplace needs trained spatial data analysts who can:

  • compile disparate data from multiple sources;
  • use easily available and open technology for robust data analysis, sharing, and publication;
  • apply core spatial analysis methods;
  • and utilize visualization tools to communicate with project managers, the public, and other stakeholders.

To help meet this demand, International and Executive Programs (IEP) and the Geospatial Innovation Facility (GIF) are hosting a 3-day intensive Bootcamp on Spatial Data Science on March 23-25, 2016 at UC Berkeley.

With this Spatial Data Science Bootcamp for professionals, you will learn how to integrate modern Spatial Data Science techniques into your workflow through hands-on exercises that leverage today's latest open source and cloud/web-based technologies. We look forward to seeing you here!

To apply and for more information, please visit the Spatial Data Science Bootcamp website.

Limited space available. Application due on February 19th, 2016.

print 'Hello World (from FOSS4G NA 2015)'

FOSS4G NA 2015 is going on this week in the Bay Area, and so far, it has been a great conference.

Monday had a great line-up of tutorials (including mine on PySAL and Rasterio), and yesterday was full of inspiring talks.  Highlights of my day: PostGIS Feature Frenzy, a new geoprocessing Python package called PyGeoprocessing, just released last Thurs(!) from our colleagues down at Stanford who work on the Natural Capital Project, and a very interesting talk about AppGeo's history and future of integrating open source geospatial solutions into their business applications. 

The talk by Michael Terner from AppGeo echoed my own ideas about tool development (one that is also shared by many others including ESRI) that open source, closed source and commercial ventures are not mutually exclusive and can often be leveraged in one project to maximize the benefits that each brings. No one tool will satisfy all needs.

In fact, at the end of my talk yesterday on Spatial Data Analysis in Python, someone had a great comment related to this: "Everytime I start a project, I always wonder if this is going to be the one where I stay in Python all the way through..."  He encouraged me to be honest about that reality and also about how Python is not always the easiest or best option.

Similarly, in his talk about the history and future of PostGIS features, Paul Ramsey from CartoDB also reflected on how PostGIS is really great for geoprocessing because it leverages the benefits of database functionality (SQL, spatial querying, indexing) but that it is not so strong at spatial data analysis that requires mathematical operations like interpolation, spatial auto-correleation, etc. He ended by saying that he is interested in expanding those capabilities but the reality is that there are so many other tools that already do that.  PostGIS may never be as good at mathematical functions as those other options, and why should we expect one tool to be great at everything?  I completely agree.

Landsat Seen as Stunning Return on Public Investment

Undersanding the value of Landsat program to the U.S. economy has been the ambitious goal of the Landsat Advisory Group of the National Geospatial Advisory Committee. This team of commercial, state/local government, and NGO geospatial information experts recently updated a critical review of the value of Landsat information that has recently been released to the public.

They found that the economic value of just one year of Landsat data far exceeds the multi-year total cost of building, launching, and managing Landsat satellites and sensors.  This would be considered a stunning return on investment in any conventional business setting.

Full article by Jon Campbell, U.S. Geological Survey found here.

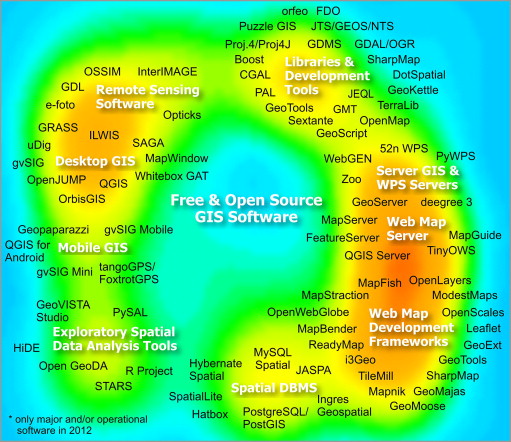
Map of open source map resources (as of 2012)

From this great paper I just came across (already much has changed in 2 years, but still cool):

Stefan Steiniger and Andrew J.S. Hunter, 2013. The 2012 free and open source GIS software map – A guide to facilitate research, development, and adoption. Computers, Environment, and Urban Systems. Volume 39: 136–150.

From the paper: "Over the last decade an increasing number of free and open source software projects have been founded that concentrate on developing several types of software for geographic data collection, storage, analysis and visualization. We first identify the drivers of such software projects and identify different types of geographic information software, e.g. desktop GIS, remote sensing software, server GIS etc. We then list the major projects for each software category. Afterwards we discuss the points that should be considered if free and open source software is to be selected for use in business and research, such as software functionality, license types and their restrictions, developer and user community characteristics, etc. Finally possible future developments are addressed."

Web mapping of high res imagery helps conservation

One of our collaborators on the Sonoma Vegetation Mapping Project has sent work on how web mapping and high resolution imagery has helped them do their job well. These are specific comments, but might be more generally applicable to other mapping and conservation arenas.

  1. Communicating with partnering agencies.
    • In the past year this included both large wetland restoration projects and the transfer of ownership of several thousands of acres to new stewards.
  2. Articulating to potential donors the context and resources of significant properties that became available for purchase.
    • There are properties that have been identified as high priority conservation areas for decades and require quick action or the opportunity to protect would pass.
  3. Internal communication to our own staff.
    • We have been involved in the protection of over 75 properties, over 47,000 acres. At this time we own 18 properties (~6500 acres) and 41 conservation easements (~7000  acres). At this scale high quality aerial imagery is essential to the size of land we steward and effective broad understanding. The way it is served as a seamless mosaic means it is available to extremely experienced and intelligent people who find the process of searching and joining orthorectified imagery by the flight path and row cumbersome or inefficient.
  4. Researching properties of interest.
    • Besides our own internal prioritization of parcels to protect, I understand that we receive a request a week for our organization’s attention towards some property in Sonoma. Orienting ourselves to the place always includes a map with the property boundary using the most recent and/or high quality imagery for the parcel of interest and its neighbors.  This is such a regular part of our process that we created a ArcGIS Server based toolset that streamlines this research task and cartography. The imagery service we consume as the basemap for all these maps is now the 2011 imagery service.  This imagery is of high enough resolution that we can count on it for both regional and parcel scale inspection to support our decisions to apply our resources.
  5. Orienting participants to site.
    • Our On the Land Program uses the imagery in their introduction maps to help visitors on guided hikes quickly orient to the place they are visiting and start folding their experience and sense of place into their visit.
  6. Complementing grant applications.
    • Grants are an important part of the funding for major projects we undertake. High quality imagery facilitates our ability to orient the grant reviewer and visually support the argument we are making which is that our efforts will be effective and worthy of funds that are in short supply.
  7. Knowing what the resources on a property are is an essential part of thoughtfully managing them.
    • In one example we used the aerial imagery (only a year old at the time) as a base map for botanists to classify the vegetation communities. These botanists are not experts in GIS, but by using paper maps with high resolution prints in the field they were easily able to delineate what they were observing on the ground on features interpreted in the photo.  We then scanned and confidently registered their hand annotations to the same imagery, allowing staff to digitized the polygons that represent the habitat observed. These vegetation observations are shared with Sonoma County and its efforts to map all the vegetation of Sonoma County.
  8. Conservation easement monitoring makes extensive use of aerial imagery.
    • In some cases we catch violations of our easements that are difficult to view on the ground, for example unpermitted buildings by neighbors on the lands we protect, illegal agriculture or other encroachment. It is often used to orient new and old staff to a large property before walking their and planning for work projects that might be part of prescribed management.
  9. The imagery helps reinforce our efforts to communicate the challenge to preserve essential connectivity in the developed and undeveloped areas of Sonoma County.
    • In the Sonoma Valley there is a wildlife corridor of great interest to us as conservation priority. Aerial imagery has been an important part of discussing large land holdings such as the Sonoma Developmental Center, existing conserved land by Sonoma Land Trust and others, and the uses of the valley for housing and agriculture.
  10. Celebration of the landscape cannot be forgotten.
    • We often pair this high quality aerial imagery with artful nature photography. The message of the parts and their relation to the whole are succinctly and poetically made. This is essential feedback to members and donors who need to see the numbers of acres protected with their support and have the heartfelt sense of success.

We look forward to the continued use of this data and the effective way it is shared.
 
We hope that future imagery and other raster or elevation data can be served as well as this, it would benefit many engaged in science and conservation.

Thanks to Joseph Kinyon, GIS Manager, Sonoma Land Trust

Using Social Media to Discover Public Values, Interests, and Perceptions about Cattle Grazing on Park Lands

“Moment of Truth—and she was face to faces with this small herd…” Photo and comment by Flickr™ user, Doug GreenbergIn a recent open access journal article published in Envrionmental Management, colleague Sheila Barry explored the use of personal photography in social media to gain insight into public perceptions of livestock grazing in public spaces. In this innovative paper, Sheila examined views, interests, and concerns about cows and grazing on the photo-sharing website, FlickrTM. The data were developed from photos and associated comments posted on Flickr™ from February 2002 to October 2009 from San Francisco Bay Area parks, derived from searching photo titles, tags, and comments for location terms, such as park names, and subject terms, such as cow(s) and grazing. She found perceptions about cattle grazing that seldom show up at a public meeting or in surveys. Results suggest that social media analysis can help develop a more nuanced understanding of public viewpoints useful in making decisions and creating outreach and education programs for public grazing lands. This study demonstrates that using such media can be useful in gaining an understanding of public concerns about natural resource management. Very cool stuff!

Open Access Link: http://link.springer.com/article/10.1007/s00267-013-0216-4/fulltext.html?wt_mc=alerts:TOCjournals

Mapping and interactive projections with D3

D3 is a javascript library that brings data to life through an unending array of vizualizations.  Whether you've realized it or not, D3 has been driving many of the most compeling data visualizations that you have likely seen throughout the last year including a popular series of election tracking tools in the New York Times.

You can find a series of examples in D3's gallery that will keep you busy for hours!

In addition to the fantastic charting tools, D3 also enables a growing list of mapping capabilities.  It is really exciting to see where all this is heading.  D3's developers have been spending a lot of time most recently working on projections transformations.  Check out these amazing interactive projection examples:

Projection Transitions

Comparing Map Projections

Adaptive Composite Map Projections (be sure to use chrome for the text to display correctly)

Can't wait to see what the future has in store for bringng custom map projections to life in more web map applications!


Introduction to the Web-enabled Landsat Data (WELD) products using open source software

Introduction to the Web-enabled Landsat Data (WELD) products using open source software

At American Geophysical Union Fall 2012 Meeting, San Francisco December 6, 2012
______________________________

The NASA funded Web-enabled Landsat Data (WELD) project is providing near-continental scale 30m Landsat time series products (http://weld.cr.usgs.gov).

This 4.5 hour training workshop will provide student and expert users with tips and techniques to handle the WELD products.

Participants will bring their own laptops and a Linux-like Virtual Machine will be installed with remote sensing and GIS open source software, sample WELD products, scripts, and example exercises that illustrate a variety of WELD environmental monitoring and assessment applications. Participants will be assisted through the example exercises and all training material will be available for their later consultation. New WELD product versions will be available and participant feedback and suggestions to evolve the WELD processing
algorithms, product contents and format will be sought.
More information at http://globalmonitoring.sdstate.edu/projects/weld/weldtraining.html

Cost: Free (No AGU Registration Fee Needed)
Date: December 6, 2012
Time: 6:00pm - 10:30pm
Location: San Francisco Marriott
Room: Sierra A

CartoDB launches tools for visualizing temporal data

CartoDB, a robust and easy to use web mapping application, today launched "torque" a new feature enabling visualization of temporal data sets. 

From the CartoDB team:

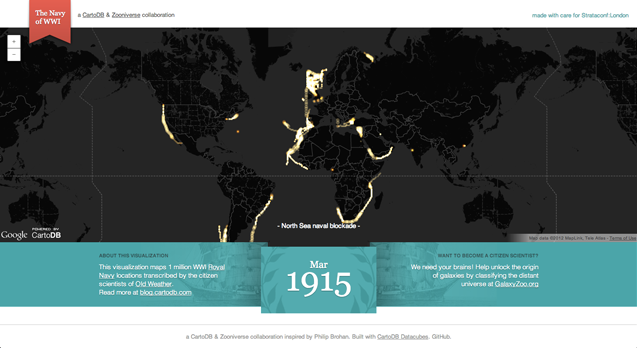
Torque is a library for CartoDB that allows you to create beautiful visualizations with temporal datasets by bundling HTML5 browser rendering technologies with an efficient data transfer format using the CartoDB API. You can see an example of Torque in action on the Guardian's Data Blog, and grab the open source code from here.

Be sure to check out the example based on location data recorded from Captain's logs from the British Royal Navy during the first World War.  Amazing stuff!


New open datasets for City of Oakland and Alameda County

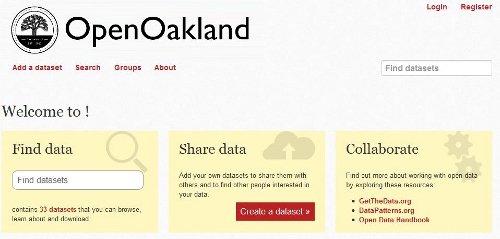
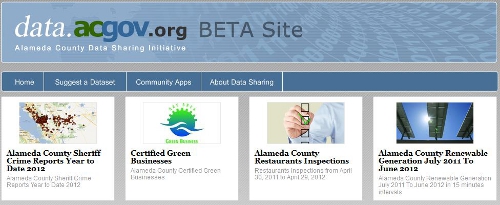
Following on the footsteps of the county and city of San Francisco open data repository at data.sfgov.org, two new beta open data repositories have recently been released for the City of Oakland and Alameda County. This development coincides with the recent 2012 Code for Oakland hackathon last week. The hackathon aims to make government more transparent in the city and county through the use of technology with apps and the web to make public access to government data easier. The City of Oakland’s open data repository at data.openoakland.org includes data on crime reports for a variety of spatial scales, a variety of tabular and geographic data such as parcels, roads, trees, public infrastructure, and locations of new development to name a few. It is important to note that the Oakland open data repository is currently not officially run or maintained by the City of Oakland. It is currently maintained by members of the community and the OpenOakland Brigade. Alameda County’s open data repository at data.acgov.org includes data on Sherriff crime reports, restaurant health reports, solar generation data, and a variety of tabular and geographic data and public health department data. Data can be viewed on a browser as an interactive table or an interactive map or the data can be downloaded in a variety of formats. Both sites are still in their infancy so expect more datasets to come online soon. Also on the same note, the Urban Strategies Council recently released a new version of their InfoAlamedaCounty webGIS data visualization and map viewer - check it out.

 Screenshot of City of Oakland Open Data: data.openoakland.org

Screenshot of Alameda County Open Data: data.acgov.org

New ArcGIS and QGIS desktop versions available

Big updates are now available to both ArcGIS and QGIS bringing more power and functionality to desktop GIS users!

ArcGIS 10.1 is now available with lots of new features.  Learn more from ESRI.com.  The GIF is now testing the updated software and we plan to make it available on lab workstations in the coming weeks.

QGIS 1.8 is also now available, and is free for download.  Visit QGIS.org for download instructions and to learn more about the new features available in this release.

ASPRS 2012 Wrap-up

ASPRS 2012, held in Sacramento California, had about 1,100 participants. I am back to being bullish about our organization, as I now recognize that ASPRS is the only place in geospatial sciences where members of government, industry, and academia can meet, discuss, and network in a meaningful way. I saw a number of great talks, met with some energetic and informative industry reps, and got to catch up with old friends. Some highlights: Wednesday's Keynote speaker was David Thau from Google Earth Engine whose talk "Terapixels for Everyone" was designed to showcase the ways in which the public's awareness of imagery, and their ability to interact with geospatial data, are increasing. He calls this phenomena (and GEE plays a big role here): "geo-literacy for all", and discussed new technologies for data/imagery acquisition, processing, and dissemination to a broad public(s) that can include policy makers, land managers, and scientists. USGS's Ken Hudnut was Thursday's Keynote, and he had a sobering message about California earthquakes, and the need (and use) of geospatial intelligence in disaster preparedness.

Berkeley was well represented: Kevin and Brian from the GIF gave a great workshop on open source web, Kevin presented new developments in cal-adapt, Lisa and Iryna presented chapters from their respective dissertations, both relating to wetlands, and our SNAMP lidar session with Sam, Marek, and Feng (with Wenkai and Jacob from UCMerced) was just great!

So, what is in the future for remote sensing/geospatial analysis as told at ASPRS 2012? Here are some highlights:

  • Cloud computing, massive datasets, data/imagery fusion are everywhere, but principles in basic photogrammetry should still comes into play;
  • We saw neat examples of scientific visualization, including smooth rendering across scales, fast transformations, and immersive web;
  • Evolving, scaleable algorithms for regional or global classification and/or change detection; for real-time results rendering with interactive (on-the-fly) algorithm parameter adjustment; and often involving open source, machine learning;
  • Geospatial data and analysis are heavily, but inconsistently, deployed throughout the US for disaster response;
  • Landsat 8 goes up in January (party anyone?) and USGS/NASA are looking for other novel parterships to extend the Landsat lifespan beyond that;
  • Lidar is still big: with new deployable and cheaper sensors like FLASH lidar on the one hand, and increasing point density on the other;
  • Obia, obia, obia! We organized a nice series of obia talks, and saw some great presentations on accuracy, lidar+optical fusion, object movements; but thorny issues about segmentation accuracy and object ontology remain; 
  • Public interaction with imagery and data are critical. The Public can be a broader scientific community, or a an informed and engaged community who can presumably use these types of data to support public policy engagement, disaster preparedness and response.